The 15N Isotope Pairing Technique for Anammox in Coastal Sediments: A Complete Guide for Researchers
This article provides a comprehensive overview of the 15N isotope pairing technique (IPT) for quantifying anaerobic ammonium oxidation (anammox) rates in coastal sediments.
The 15N Isotope Pairing Technique for Anammox in Coastal Sediments: A Complete Guide for Researchers
Abstract
This article provides a comprehensive overview of the 15N isotope pairing technique (IPT) for quantifying anaerobic ammonium oxidation (anammox) rates in coastal sediments. It begins by establishing the ecological significance of anammox in the marine nitrogen cycle. A detailed, step-by-step protocol for the IPT is presented, followed by a critical analysis of common methodological challenges and optimization strategies. The content further validates the technique by comparing it with alternative methods like the 15N tracer technique and molecular approaches. This guide is tailored for researchers, scientists, and environmental professionals seeking robust, reliable quantification of sediment anammox processes for biogeochemical modeling and remediation studies.
Anammox in Coastal Sediments: Why Quantifying This Hidden Nitrogen Sink Matters
Application Notes: Role in the Nitrogen Cycle and Climate
Anammox (anaerobic ammonium oxidation) is a microbially mediated process that converts ammonium (NHâ‚„âº) and nitrite (NOâ‚‚â») directly into dinitrogen gas (Nâ‚‚) under anoxic conditions. This process is integral to the global nitrogen cycle, responsible for an estimated 30-50% of oceanic Nâ‚‚ production, thereby regulating primary productivity and fixed nitrogen inventory. In engineered systems, it offers a sustainable, cost-effective alternative for nitrogen removal from wastewater, reducing energy consumption and greenhouse gas emissions compared to conventional nitrification-denitrification.
Within coastal sediment research—the focus of our broader thesis—quantifying anammox activity is crucial for understanding nitrogen attenuation capacities, eutrophication control, and Nâ‚‚O fluxes. The ¹âµN isotope pairing technique (IPT) is the cornerstone method for in situ rate measurement, distinguishing anammox from canonical denitrification.
Table 1: Global Significance of Anammox: Quantitative Estimates
| Ecosystem/Context | Estimated Contribution to Nâ‚‚ Production | Key Metric/Note | Source Trend (2020-2024) |
|---|---|---|---|
| Oceanic Oxygen Minimum Zones (OMZs) | 30-50% | Of total N-loss | Revised upwards with new IPT calibrations |
| Coastal & Shelf Sediments | 0-40% | Highly spatially variable; dominates in permeable sands | Site-specific studies emphasize heterogeneity |
| Wastewater Treatment (anammox-based) | Up to 90% reduction in aeration energy | 60% lower sludge production | Full-scale applications increasing globally |
| Agricultural Soils | Typically <5% | Can be significant in flooded rice paddies | Emerging research area |
Protocols: ¹âµN Isotope Pairing Technique for Coastal Sediments
Core Experimental Protocol
This protocol details the slurry incubation method for quantifying anammox and denitrification rates in intact coastal sediment cores.
I. Materials & Pre-incubation
- Sediment Cores: Collect using a manual corer (e.g., acrylic liners, ~30 cm depth). Maintain in situ temperature and anoxia during transport.
- Anoxic Artificial Seawater: Prepare with salts, 1 mM NaHCO₃ buffer, sparged with N₂/CO₂ (95:5) for >2 hours.
- ¹âµN Tracers: ¹âµNH₄⺠(e.g., ¹âµNHâ‚„Cl, 98+ at%) and ¹âµNOâ‚‚â»/¹â´NO₃⻠(e.g., Na¹âµNOâ‚‚, K¹â´NO₃).
- Exetainer Vials: 12 mL Labco Exetainers (or equivalent), pre-evacuated and flushed with He.
- Gas Chromatograph-Mass Spectrometer (GC-MS): For measuring ²â¸Nâ‚‚, ²â¹Nâ‚‚, and ³â°Nâ‚‚.
II. Incubation Setup (Slurry Method)
- In an anaerobic glove bag (Nâ‚‚ atmosphere), section the sediment core (e.g., 0-2 cm, 2-5 cm).
- Homogenize each section gently. Transfer a known weight (~5 g wet weight) to a 60 mL serum vial containing 20 mL of anoxic artificial seawater.
- Prepare the following tracer amendment treatments in triplicate:
- Treatment A (Anammox + Denitrification): Add ¹âµNO₃⻠(final conc. ~50-100 µM). This labels the NOâ‚‚â» pool via nitrate reduction.
- Treatment B (Anammox-specific): Add ¹âµNH₄⺠(final conc. ~50 µM) + ¹â´NO₃⻠(~100 µM). Provides ¹â´NOâ‚‚â» from nitrate reduction for coupling with ¹âµNHâ‚„âº.
- Control: No tracer addition.
- Seal vials with butyl rubber stoppers, crimp, and remove from glove bag.
- Incubate in the dark at in situ temperature with gentle shaking.
- At regular time intervals (e.g., T0, T3, T6, T9 hrs), sacrifice triplicate vials per treatment. Inject 200 µL of 50% ZnCl₂ (w/v) to stop biological activity.
III. Gas Sampling & GC-MS Analysis
- Create a slight overpressure in the vial with He.
- Collect a 500 µL headspace sample and inject it into the GC-MS.
- Measure the masses 28, 29, and 30 to determine the concentrations and ¹âµN atom fractions of Nâ‚‚.
IV. Rate Calculations Rates are calculated from the linear production of ²â¹Nâ‚‚ and ³â°Nâ‚‚ over time.
- Total Denitrification (Dâ‚ₜₒₜ₎): Dâ‚ₜₒₜ₎ = (²â¹Nâ‚‚ + 2 * ³â°Nâ‚‚) * f * (1 / sediment dry weight * time) (where f is a factor converting headspace concentration to total nmol Nâ‚‚ in vial)
- Anammox Rate (A): From Treatment A, A = ²â¹Nâ‚‚ * f * (1 / sediment dry weight * time). Assumes ¹âµNO₃⻠is reduced to ¹âµNOâ‚‚â», which then reacts with ambient ¹â´NHâ‚„âº.
- Denitrification from Water Column Nitrate (Dâ‚wâ‚Ž): Dâ‚wâ‚Ž = ³â°Nâ‚‚ * f * (1 / sediment dry weight * time).
- Denitrification from Nitrification (Dâ‚ₙ₎): Dâ‚ₙ₎ = Dâ‚ₜₒₜ₎ - Dâ‚wâ‚Ž - A. Cross-verification using Treatment B (production of ²â¹Nâ‚‚ from ¹âµNH₄⺠+ ¹â´NO₃â») confirms anammox activity.
The Scientist's Toolkit: Key Research Reagent Solutions
Table 2: Essential Reagents for ¹âµN IPT Anammox Research
| Item | Function & Specification | Critical Notes |
|---|---|---|
| ¹âµNHâ‚„Cl (98+ at% ¹âµN) | Tracer for labeling the ammonium pool. Used in specific anammox incubations (Treatment B). | Store dry, in desiccator. Prepare anoxic stock solution in deoxygenated water. |
| Na¹âµNOâ‚‚ / K¹âµNO₃ (98+ at% ¹âµN) | Tracer for labeling the nitrite/nitrate pool. Used to measure total Nâ‚‚ production pathways (Treatment A). | Nitrite solutions are unstable; prepare fresh daily and verify concentration spectrophotometrically. |
| ZnClâ‚‚ Solution (50% w/v) | Poison to terminate all microbial activity instantly at sampling time points. | Corrosive. Handle with PPE. |
| Helium (He, 99.999%) | Creates anoxic atmosphere for vial flushing and headspace analysis. Carrier gas for GC-MS. | Use with oxygen traps for ultra-high purity in sensitive MS work. |
| Artificial Seawater Salts | Provides ionic strength and major ions matching study site conditions for slurry incubations. | Adjust salinity to in situ value. Buffer with NaHCO₃ to maintain pH ~7.5-8. |
| Butyl Rubber Stoppers & Aluminum Seals | Ensure gas-tight seals for serum vials and Exetainers during incubation and storage. | Pre-bake to reduce volatile organic contaminants. |
| Anaerobic Indicator (e.g., Resazurin) | Visual indicator of redox potential in prepared anoxic solutions and slurries. | Colorless (reduced) indicates anoxic conditions. |
| 2-Amino-4,5-bis(2-methoxyethoxy)benzonitrile | 2-Amino-4,5-bis(2-methoxyethoxy)benzonitrile, CAS:950596-58-4, MF:C13H18N2O4, MW:266.29 g/mol | Chemical Reagent |
| 3-Amino-1,1,1-trifluoropropan-2-ol hydrochloride | 3-Amino-1,1,1-trifluoropropan-2-ol hydrochloride, CAS:3832-24-4, MF:C3H7ClF3NO, MW:165.54 g/mol | Chemical Reagent |
Diagrams
Application Notes: 15N Isotope Pairing for Coastal Sediment Anammox
Anammox (anaerobic ammonium oxidation) is a key nitrogen-removal process in coastal sediments, converting ammonium and nitrite directly to dinitrogen gas. The 15N isotope pairing technique (IPT) is the definitive method for quantifying in situ anammox rates and distinguishing its contribution from canonical denitrification. This is critical for accurate N-budgeting in eutrophic coastal zones.
Core Principle: Sediment slurries or intact cores are incubated with 15N-labeled nitrate (15NO3-) or nitrite (15NO2-). The anammox bacteria use the 15NO2- derived from partial denitrification of the added tracer, along with ambient 14NH4+, to produce 29N2 (14N15N). In contrast, denitrification produces both 28N2 (14N14N) and 30N2 (15N15N). The ratios of the produced 29N2 and 30N2 gases are used to calculate the relative contributions of anammox and denitrification.
Key Considerations for Coastal Sediments:
- Sulfide Inhibition: Coastal sediments often contain sulfide, which can inhibit anammox. Use of low tracer concentrations and short incubation times is essential to minimize artifacts.
- Alternative NOx Sources: Mn/Fe-dependent nitrate reduction (nitrification) can supply NO2- for anammox. IPT with 15NH4+ may be combined to trace this coupled nitrification-anammox pathway.
- Spatial Heterogeneity: Anammox activity is often concentrated in specific redox zones (e.g., the suboxic zone just below the sediment-water interface). High-resolution depth profiling is recommended.
Table 1: Reported Anammox Rates in Global Coastal Sediments
| Coastal Habitat | Anammox Rate (nmol N gâ»Â¹ hâ»Â¹) | % of Total N2 Production | Key Method | Reference (Year) |
|---|---|---|---|---|
| Estuarine Mudflat | 1.5 - 20.8 | 10 - 35% | 15NO3- IPT, Slurry | Thamdrup & Dalsgaard (2002) |
| Mangrove Forest | 0.8 - 15.2 | 5 - 41% | 15NO3- IPT, Core | Hou et al. (2013) |
| Continental Shelf | 0.1 - 5.3 | 4 - 30% | 15NO2- IPT, Slurry | Trimmer et al. (2013) |
| Aquaculture Zone | 8.5 - 52.4 | 15 - 50% | 15NO3- IPT, Slurry | Wang et al. (2019) |
| Intertidal Sandflat | 0.5 - 8.7 | <1 - 19% | 15NO3- IPT, Core | Gao et al. (2022) |
Table 2: IPT-Derived Calculations for Anammox & Denitrification
| Parameter | Formula | Interpretation |
|---|---|---|
| Total N2 Production (D14) | D14 = 28N2 (from 14N pool) | Background denitrification from ambient NO3- |
| Denitrification of Tracer (D15) | D15 = 30N2 + (29N2 * p) | p = probability of 15N in NO2- pool |
| Anammox (A) | A = 29N2 / (p * (1 - F)) | F = fraction of 15N in NO2- pool from labeled tracer |
| Denitrification (D) | D = D14 + D15 | Total denitrification rate |
| % Anammox Contribution | %A = A / (A + D) * 100 | Relative role of anammox |
Experimental Protocols
Protocol 1: Core Incubation & Slurry Preparation for 15N-IPT
Objective: To quantify potential anammox and denitrification rates from intact sediment cores and homogenized slurries.
Materials: See "Scientist's Toolkit" below. Procedure:
- Sampling: Collect intact sediment cores (e.g., acrylic liners, Ø ≥ 5 cm) from the target coastal zone. Preserve vertical stratification. Store in the dark at in situ temperature.
- Overlying Water Replacement: Carefully replace overlying water with Helium-sparged, filtered site water to create anoxic conditions. Gently bubble with He for 30 min.
- Tracer Addition: Inject 15NO3- or 15NO2- stock solution (98+ at% 15N) into the overlying water to achieve a low, non-invasive final concentration (typically 10-100 µM). For slurries, homogenize a core section under He atmosphere, dispense into Exetainers, then add tracer.
- Incubation: Incubate in the dark at in situ temp. Sacrifice replicates over a time series (e.g., 0, 2, 4, 6, 8h).
- Termination & Preservation: At each time point, inject 200 µL of 50% ZnCl2 into the Exetainer, vigorously shake, and store upside-down at room temperature until analysis.
- Gas Analysis: Analyze the headspace for 28N2, 29N2, and 30N2 using a Gas Chromatograph coupled to an Isotope Ratio Mass Spectrometer (GC-IRMS).
Protocol 2: Calculation of Process Rates from IPT Data
Objective: To compute anammox and denitrification rates from measured N2 isotopologue data. Procedure:
- Determine Excess Gas: Subtract time-zero values from all time-point measurements to obtain excess 29N2 and 30N2.
- Calculate Probability (p): p = (30N2 + 29N2/2) / (30N2 + 29N2). This estimates the 15N fraction in the NO2- pool used by anammox.
- Calculate F-value: In parallel incubations with 15NH4+ addition, F = 29N2/(29N2+2*30N2). For standard 15NO3- incubations, F is often approximated (e.g., 0.5-0.6) based on the isotope fractionation of nitrate reduction.
- Apply Formulas: Use formulas from Table 2 to calculate rates A (anammox) and D (denitrification). Perform calculations using established models (e.g., R package
isotopiaor spreadsheet models from publications).
Visualizations
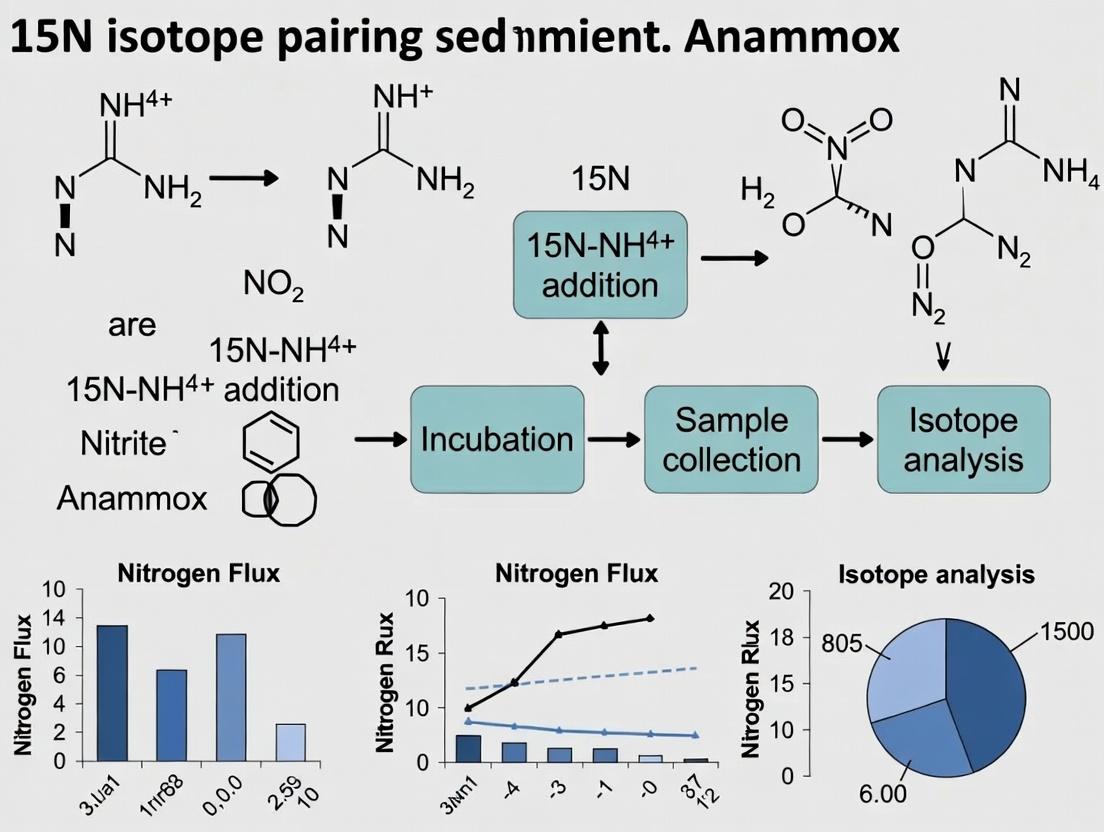
Title: Anammox Reaction and 15N IPT Principle
Title: 15N-IPT Experimental Workflow
The Scientist's Toolkit
Table 3: Key Research Reagent Solutions & Materials
| Item | Function/Brief Explanation |
|---|---|
| K15NO3 or Na15NO2 (98+ at%) | The essential isotopic tracer. 15NO3- is most common, as it enters the NO2- pool via ambient sediment denitrification. |
| Helium (He) Gas (≥99.999%) | Used to create and maintain anoxic conditions during water replacement and slurry preparation to prevent O2 inhibition of anammox. |
| Zinc Chloride (ZnCl2, 50% w/v) | A potent biocide used to terminate biological activity at specific time points, preserving the N2 gas signature. |
| Exetainer Vials (12 mL Labco) | Gas-tight vials used for slurry incubations and gas sample storage. Must be helium-flushed. |
| GC-IRMS System | Gas Chromatograph-Isotope Ratio Mass Spectrometer. The core analytical instrument for precise measurement of N2 isotopologue ratios. |
| Anoxic, Filtered Site Water | Used to replace overlying core water. Filtered (0.2 µm) to remove microbes, made anoxic by He-sparging to mimic in situ redox. |
| Sediment Corer (e.g., Uwitec) | For collecting undisturbed, depth-stratified sediment cores essential for obtaining representative samples. |
Software (R, isotopia package) |
For statistical analysis and modeling of IPT data, implementing equations from Table 2. |
| 6-Bromo-3-ethyl-3H-imidazo[4,5-b]pyridine | 6-Bromo-3-ethyl-3H-imidazo[4,5-b]pyridine, CAS:1033202-59-3, MF:C8H8BrN3, MW:226.07 g/mol |
| 6-Bromo-3-iodo-1H-pyrrolo[3,2-b]pyridine | 6-Bromo-3-iodo-1H-pyrrolo[3,2-b]pyridine, CAS:956485-60-2, MF:C7H4BrIN2, MW:322.93 g/mol |
Application Notes: ¹âµN Isotope Pairing Technique for Coastal Sediment Anammox
The accurate quantification of anaerobic ammonium oxidation (anammox) in complex environmental matrices like coastal sediments is critical for constraining global nitrogen budgets. The ¹âµN isotope pairing technique (IPT) remains the gold standard for disentangling anammox from co-occurring denitrification. In coastal sediments, where fluctuating oxygen and organic matter levels create dynamic redox gradients, the application of IPT requires specific considerations to avoid over- or under-estimation of process rates.
Core Principle: The technique involves incubating sediment slurries or intact cores with ¹âµN-labeled nitrate (¹âµNO₃â») or nitrite (¹âµNOâ‚‚â»). The fate of the label is tracked into the gaseous products Nâ‚‚ (²â¹Nâ‚‚ and ³â°Nâ‚‚ from anammox and denitrification) and Nâ‚‚O. The original IPT model relies on the pairing of ¹âµN-labeled nitrite/nitrate with ambient ¹â´NH₄⺠to produce ²â¹Nâ‚‚ (via anammox), while denitrification produces both ²â¹Nâ‚‚ and ³â°Nâ‚‚ from the labeled substrate alone.
Key Challenges in Coastal Sediments:
- Alternative ¹â´NH₄⺠Pools: DNRA (Dissimilatory Nitrate Reduction to Ammonium) can produce labeled ¹âµNHâ‚„âº, which subsequently fuels anammox, leading to an overestimation of anammox-derived ²â¹Nâ‚‚ if using the standard model.
- Nitrite Dynamics: Simultaneous oxidation of ¹âµNH₄⺠to ¹âµNOâ‚‚â» (via nitrification) and its subsequent reduction can confuse labeling patterns. The use of ¹âµNOâ‚‚â» as a substrate, combined with specific inhibitors, is often preferred.
- Sulfide Interference: Sulfide-rich coastal sediments can chemically reduce ¹âµNOâ‚‚â» to ¹âµNâ‚‚O, yielding false-positive signals.
Updated Calculation Model: The revised IPT accounts for DNRA by including the production of ¹âµNH₄⺠and its consumption. The rate of anammox (Ra) is calculated based on the production of ²â¹Nâ‚‚ from the pairing of ¹âµNOâ‚‚â» with ¹â´NHâ‚„âº, while correcting for the ²â¹Nâ‚‚ produced from denitrification of mixed ¹â´/¹âµN substrates.
Table 1: Reported Anammox Rates and Contributions in Various Coastal Sediments
| Coastal Sediment Type | Total Nâ‚‚ Production (nmol N gâ»Â¹ hâ»Â¹) | Anammox Contribution (%) | Key Methodological Note | Reference (Example) |
|---|---|---|---|---|
| Estuarine Mudflat | 5.2 - 28.7 | 10 - 35% | IPT with ¹âµNO₃â»; intact cores | Trimmer et al., 2003 |
| Mangrove Forest | 1.5 - 12.3 | 5 - 20% | IPT with ¹âµNOâ‚‚â»; sulfide inhibition control | Hou et al., 2013 |
| Seagrass Meadow | 8.8 - 41.5 | 15 - 50% | IPT combined with MIMS; slurry incubation | Song et al., 2021 |
| Hypoxic Basin | 20.1 - 85.4 | 30 - 70% | IPT with ¹âµNH₄⺠& ¹â´NOâ‚‚â» pairing | Thamdrup & Dalsgaard, 2002 |
| Intertidal Sand | 0.5 - 4.1 | <1 - 10% | Low activity; requires extended incubation | Deng et al., 2015 |
Table 2: Comparison of Substrate & Inhibitor Strategies for IPT in Coastal Sediments
| Strategy | Target Process | Advantages | Disadvantages for Coastal Sediments |
|---|---|---|---|
| ¹âµNO₃⻠addition | Combined denitrification & anammox | Measures total N-loss; standard approach. | DNRA and nitrification complicate labeling. |
| ¹âµNOâ‚‚â» addition | Direct anammox substrate | More direct; reduces nitrification complication. | Susceptible to chemical reduction by Fe²âº/HSâ». |
| +ATU (allylthiourea) | Inhibits nitrification | Isates ¹âµNOâ‚‚â» source to reduction. | May not fully inhibit in sulfide-rich sediments. |
| +Sodium Azide | Inhibits nitrification & AOB | Stronger inhibition of oxidation. | Can be toxic to anaerobes at high doses. |
| Combined ¹âµNH₄⺠& ¹â´NOâ‚‚â» | Directly traces anammox Nâ‚‚ | Unambiguous ²â¹Nâ‚‚ signal from anammox. | Requires knowledge of in situ NOâ‚‚â» pool. |
Detailed Experimental Protocols
Protocol 1: Core Incubation & Slurry Preparation for Coastal Sediments
Objective: To prepare sediment samples for IPT while minimizing disturbance to natural redox gradients.
- Sampling: Collect intact sediment cores using a manual corer (e.g., acrylic liners, Ø 5-10 cm) from an intertidal zone during low tide. Seal ends with butyl rubber stoppers, maintain in situ temperature.
- Pre-incubation: In a Nâ‚‚-flushed glove bag, carefully section the core (e.g., 0-2 cm, 2-5 cm depth slices) into pre-weighed, Nâ‚‚-flushed serum vials.
- Slurry Creation: For each depth, add a known volume of anoxic, artificial seawater (salinity-matched) to create a homogenized slurry (typically 1:2 sediment:water ratio). Homogenize gently with a spatula under Nâ‚‚ flow.
- Pre-conditioning: Incubate slurries in the dark at in situ temperature for 12-24h to stabilize after disturbance.
Protocol 2: ¹âµN Isotope Pairing Experiment with Inhibitor Control
Objective: To quantify anammox and denitrification rates simultaneously. Reagents: ¹âµNOâ‚‚â» stock (99 atom% ¹âµN, 10 mM in anoxic water), Allylthiourea (ATU, 10 mM stock), Sodium Azide (NaN₃, 50 mM stock), ZnClâ‚‚ (50% w/v, termination solution). Procedure:
- Set-up: Distribute 12 mL of sediment slurry into 12 Exetainer vials (12 mL) under Nâ‚‚ atmosphere. Seal with crimp caps.
- Treatment Application (in quadruplicate):
- T1 (Control): Add 100 µL of anoxic water.
- T2 (¹âµNOâ‚‚â» only): Add 100 µL of ¹âµNOâ‚‚â» stock (final ~100 µM).
- T3 (¹âµNOâ‚‚â» + ATU): Add 50 µL ATU stock (final ~0.5 mM) + 50 µL ¹âµNOâ‚‚â» stock.
- T4 (¹âµNOâ‚‚â» + NaN₃): Add 20 µL NaN₃ stock (final ~0.1 mM) + 80 µL ¹âµNOâ‚‚â» stock.
- Incubation: Place all vials on a rotary shaker (100 rpm) in the dark at in situ temperature.
- Time-Series Sampling: At time points (e.g., T0, T2, T4, T6, T8h), sacrifice entire vials. Inject 200 µL ZnCl₂ to terminate biological activity.
- Analysis: Analyze the headspace for ²â¸Nâ‚‚, ²â¹Nâ‚‚, and ³â°Nâ‚‚ using a Gas Chromatograph coupled to an Isotope Ratio Mass Spectrometer (GC-IRMS) or Membrane Inlet Mass Spectrometer (MIMS).
- Calculation: Apply the revised IPT equations correcting for DNRA-derived ¹âµNH₄⺠(determined from parallel ¹âµNO₃⻠incubations and NH₄⺠pool analysis).
Visualizations
Title: Anammox in the Marine Nitrogen Cycle
Title: 15N IPT Experimental Workflow
The Scientist's Toolkit: Research Reagent Solutions
Table 3: Essential Reagents and Materials for Coastal Sediment Anammox IPT
| Item | Function & Specification | Critical Notes for Coastal Work |
|---|---|---|
| Na¹âµNOâ‚‚ / K¹âµNO₃ | Tracer substrate (98+ atom% ¹âµN). | Prepare anoxic, sterile stocks. Aliquots stored at -20°C. NOâ‚‚â» is light-sensitive. |
| Allylthiourea (ATU) | Nitrification inhibitor. Targets ammonium-oxidizing bacteria. | Typical final conc. 0.5-1.0 mM. Check efficacy for AOA in marine systems. |
| Sodium Azide (NaN₃) | Alternative inhibitor of nitrification and cytochrome oxidases. | Use with caution (toxic). Low conc. (0.1 mM) often sufficient. |
| Acetylene (Câ‚‚Hâ‚‚) | Classic inhibitor of nitrification (AOB/AOA) and Nâ‚‚O reduction. | Can stimulate anammox in some sediments; less preferred for IPT. |
| ZnClâ‚‚ Solution (50% w/v) | Biological reaction terminator. Preserves Nâ‚‚ isotopic signature. | Inject directly into slurry. Alternative: NaOH/HCl for pH shift. |
| Helium or Argon Gas | Creates anoxic atmosphere for glove bags/headspace. | Higher purity (>99.999%) reduces Nâ‚‚ background contamination. |
| Exetainer Vials (12mL) | Incubation vessels with butyl rubber septa. | Must be pre-flushed with He/Ar. Check for leaks under pressure. |
| Artificial Seawater | Anoxic, salinity-matched medium for slurry creation. | Recipe should include essential ions (Ca²âº, Mg²âº, Kâº, SO₄²â»). |
| GC-IRMS or MIMS | Analyzes isotopic composition of Nâ‚‚ (²â¸, ²â¹, ³â°). | MIMS allows real-time, non-destructive measurement from single vial. |
| Anoxic Glove Bag/Box | Provides oxygen-free environment for sample processing. | Maintain with continuous Nâ‚‚/Ar flow and oxygen scrubbers. |
| 1-(3-Aminophenyl)imidazolidin-2-one | 1-(3-Aminophenyl)imidazolidin-2-one, CAS:938459-14-4, MF:C9H11N3O, MW:177.2 g/mol | Chemical Reagent |
| 4-Methoxytetrahydro-2H-pyran-4-carbonitrile | 4-Methoxytetrahydro-2H-pyran-4-carbonitrile|RUO | 4-Methoxytetrahydro-2H-pyran-4-carbonitrile is a versatile chemical building block for organic synthesis and medicinal chemistry research. For Research Use Only. Not for human or veterinary use. |
Why Precise Measurement is Crucial for Biogeochemical Models and Climate Predictions
Application Notes: The Role of 15N in Constraining Nitrogen Cycle Feedbacks
Accurate quantification of microbial nitrogen (N) loss processes in coastal sediments, specifically anaerobic ammonium oxidation (anammox) coupled with denitrification, is critical for refining global nitrogen budgets and subsequent climate projections. These processes regulate the oceanic fixed nitrogen pool, influence primary productivity, and control the production and emission of nitrous oxide (Nâ‚‚O), a potent greenhouse gas. Biogeochemical models that predict coastal ecosystem responses to anthropogenic nutrient loading and climate change rely on precise parameterization of these transformation rates.
The 15N isotope pairing technique (IPT) is the methodological cornerstone for this precise measurement, allowing for the simultaneous quantification of anammox and denitrification in situ. Without the high-precision data generated by this technique, models would operate on unverified assumptions, leading to significant error propagation in predictions of future atmospheric Nâ‚‚O levels and ocean deoxygenation trends.
The following protocols and data tables outline the standardized application of the 15N-IPT for coastal sediment studies, ensuring the generation of reliable, comparable data for model assimilation.
Protocol 1: Core Incubation Setup for 15N Isotope Pairing
Objective: To measure the rates of anammox and denitrification in intact coastal sediment cores via 15N-labeled nitrate.
Materials & Reagents:
- Intact sediment cores (e.g., acrylic liners, ≥30 cm length).
- Artificial seawater medium (salinity matched to site).
- (^{15}\text{NO}_3^-) stock solution (99 at% (^{15})N, 10 mM).
- Helium (He) gas cylinder for anoxic preparation.
- Gas-tight syringes and butyl rubber stoppers.
- Exetainer vials (12 mL) pre-evacuated.
- Zinc chloride (ZnClâ‚‚) solution (50% w/v) for sample preservation.
- Magnetic stirring bars and incubation bath.
Procedure:
- Core Collection & Preparation: Collect intact sediment cores using a manual corer or box corer sub-corer. Maintain in situ temperature during transport. Carefully overlay core with 5-10 cm of site-matched, helium-sparged artificial seawater.
- Labeling: Inject a pre-determined volume of (^{15}\text{NO}_3^-) stock solution through the core sidewall at a target depth horizon (e.g., 1-5 cm below sediment-water interface) using a micro-syringe. Gently stir the overlying water to ensure even distribution without disturbing the sediment.
- Time-Series Sampling: At predetermined time points (T0, T30, T60, T90, T120 min), extract 12 mL of overlying water using a gas-tight syringe.
- Gas Sample Generation: Immediately transfer the water sample into a pre-evacuated Exetainer vial containing 100 µL of ZnCl₂. Seal the vial. Create a headspace by injecting 5 mL of helium. Vortex vigorously for 60 seconds to equilibrate dissolved N₂ gases into the headspace.
- Termination: At the final time point, sacrifice the core for porewater (^{15}\text{NO}3^-) and (^{15}\text{NH}4^+) analysis via diffusion or distillation techniques.
- Analysis: Analyze the headspace gas for (^{28}\text{N}2), (^{29}\text{N}2), and (^{30}\text{N}_2) using a continuous-flow Isotope Ratio Mass Spectrometer (IRMS) coupled to a gas chromatograph.
Protocol 2: Calculation of Anammox and Denitrification Rates from IPT Data
Objective: To compute process-specific rates from the production of (^{29}\text{N}2) and (^{30}\text{N}2).
Background: The method is based on the labeling of the ambient NOâ‚“ pool (NO₃⻠+ NOâ‚‚â»). (^{15}\text{NO}3^-)-(^{14}\text{NO}x) pairing produces (^{29}\text{N}2) via anammox, while (^{15}\text{NO}3^-)-(^{15}\text{NO}x) pairing produces (^{30}\text{N}2) via denitrification.
Procedure:
- Determine the atom fraction (F) of (^{15}\text{N}) in the NOâ‚“ pool at the incubation horizon from porewater analysis: (F = [^{15}\text{NO}x] / [\text{total NO}x]).
- Calculate the production (P) of each labeled Nâ‚‚ species over time from the IRMS data, correcting for solubility and headspace volume.
- Apply the following equations:
- Denitrification rate, (D{15} = P(^{30}\text{N}2) / (F^2))
- Anammox rate, (A{15} = [P(^{29}\text{N}2) - 2 \cdot D_{15} \cdot F \cdot (1-F)] / (2 \cdot F \cdot (1-F)))
- Total Nâ‚‚ production = (D{15} + A{15})
- Rates are typically expressed in nmol N cmâ»Â³ sediment hâ»Â¹ or µmol N mâ»Â² dâ»Â¹.
Data Presentation
Table 1: Example 15N-IPT Results from Coastal Sediment Sites
| Site Type (Core Depth) | (F{(^{15}\text{NO}x)}) | (P(^{29}\text{N}_2)) (nmol N cmâ»Â³ hâ»Â¹) | (P(^{30}\text{N}_2)) (nmol N cmâ»Â³ hâ»Â¹) | Anammox Rate | Denitrification Rate | % Anammox of Total Nâ‚‚ |
|---|---|---|---|---|---|---|
| Estuarine Mud (0-2 cm) | 0.52 | 1.24 ± 0.11 | 0.89 ± 0.07 | 2.1 ± 0.2 | 3.3 ± 0.3 | 39% |
| Marine Shelf (0-2 cm) | 0.48 | 0.31 ± 0.05 | 0.42 ± 0.04 | 0.6 ± 0.1 | 1.8 ± 0.2 | 25% |
| Hypoxic Basin (0-1 cm) | 0.60 | 5.87 ± 0.41 | 2.15 ± 0.18 | 8.9 ± 0.7 | 6.0 ± 0.5 | 60% |
Table 2: Impact of Measurement Precision on Modeled Nâ‚‚O Emission Scenarios
| N-Loss Rate Input Uncertainty | Modeled Nâ‚‚O Flux (Tg N yrâ»Â¹) | Deviation from Baseline | Key Climate Model Implication |
|---|---|---|---|
| High-Precision IPT Data (±5%) | 4.1 ± 0.2 | Baseline | Robust ocean-climate feedback projection. |
| Moderate-Precision Data (±25%) | 3.2 - 5.0 | -22% to +22% | Significant uncertainty in radiative forcing estimates. |
| Low-Precision/Assumed Rates (±50%) | 2.0 - 6.1 | -51% to +49% | Model outputs unreliable for policy guidance. |
The Scientist's Toolkit: Key Research Reagent Solutions
| Item | Function in 15N-IPT |
|---|---|
| (^{15}\text{NO}_3^-) (99 at%) | The essential tracer for labeling the nitrate/nitrite pool, enabling differentiation of Nâ‚‚ production pathways. |
| Helium-Sparged Artificial Seawater | Provides anoxic overlying water to prevent Oâ‚‚ contamination during core incubation, preserving in situ redox conditions. |
| Zinc Chloride (ZnClâ‚‚) | A potent biocide used to immediately halt microbial activity in water samples, preserving the in situ Nâ‚‚ gas signature. |
| Pre-evacuated Exetainer Vials | Enable consistent, contamination-free headspace generation for gas equilibration prior to IRMS analysis. |
| Gas-Tight Syringes (e.g., Hamilton) | Ensure accurate, loss-free transfer of liquid and gas samples, which is critical for quantitative rate calculations. |
| Reference Gas Standards ((^{28,29,30}\text{N}_2)) | Calibrate the IRMS for accurate quantification and isotopic resolution of the three Nâ‚‚ isotopologues. |
Visualization: 15N-IPT Workflow and Conceptual Basis
Workflow for 15N Isotope Pairing Technique
Conceptual Basis of 15N Pairing for N2 Source
Application Notes
Isotope techniques, particularly those employing the stable isotope 15N, are cornerstone methodologies in environmental and geochemical research. Within the context of coastal sediment studies, the 15N isotope pairing technique (IPT) has become the definitive method for quantifying anaerobic ammonium oxidation (anammox) rates, a critical process in the marine nitrogen cycle. The rationale for using 15N stems from its non-radioactive nature, its low natural abundance (0.3663%), which provides a strong background signal for tracer studies, and the ability to trace the fate of nitrogen through complex biogeochemical transformations. The technique allows researchers to disentangle the co-occurring processes of anammox and denitrification, which is essential for accurate modeling of N-loss from coastal ecosystems.
Table 1: Key Isotopic Properties and Experimental Parameters for 15N Tracer Studies
| Parameter | Value/Range | Significance/Application |
|---|---|---|
| Natural Abundance of 15N | 0.3663 atom % | Baseline for tracer enrichment calculations. |
| Typical 15N Enrichment in Tracers | 98-99 atom % | Maximizes detection sensitivity for labeled products (29N2, 30N2). |
| Anammox Stoichiometry | NH4+ + NO2- → N2 + 2H2O | Results in the production of 29N2 (14N15N) from 15NH4+ + 14NO2-. |
| Denitrification Stoichiometry | 2NO3- → N2 + O2 | Can produce 28N2, 29N2, and 30N2 depending on substrate labeling. |
| Critical IPT Measurement | Ratio of 29N2 to 30N2 production | Distinguishes anammox (primarily 29N2) from coupled nitrification-denitrification (produces 30N2). |
| Typical Incubation Duration | 6-24 hours | Balances sufficient gas production with minimal community shift. |
| Detection Limit for N2 production | < 1 nmol N2 g-1 sediment h-1 | Achievable via Membrane Inlet Mass Spectrometry (MIMS). |
Table 2: Advantages and Limitations of the 15N Isotope Pairing Technique
| Aspect | Advantage | Limitation/Caution |
|---|---|---|
| Sensitivity | Extremely high; can measure process rates in low-activity sediments. | Requires sophisticated, well-calibrated mass spectrometry (e.g., MIMS, GC-IRMS). |
| Specificity | Unambiguously distinguishes anammox from denitrification. | Assumes immediate and complete dilution of added 15NO3- into the endogenous NOx pool. |
| Safety | Uses stable, non-radioactive isotopes. | Tracers are expensive. |
| Process Resolution | Can potentially quantify co-occurring N-cycle processes simultaneously. | Complex data interpretation requiring robust mathematical modeling. |
| In Situ Relevance | Incubations can be performed with minimal sediment disturbance. | Incubation conditions (e.g., closed system) may alter natural gradients. |
Experimental Protocols
Protocol 1: Core Collection and Processing for Coastal Sediment Anammox Assays
Objective: To collect intact sediment cores and prepare them for 15N tracer incubation. Materials: Limiting core samplers (e.g., acrylic cores), underwater sealing caps, portable cooler, helium-sparged artificial seawater, glove bag (N2 atmosphere), cutting syringes. Procedure:
- Collect intact sediment cores (e.g., 5-10 cm diameter, 15-20 cm length) from the study site using a coring device. Seal ends immediately underwater.
- Transport cores vertically in a dark cooler at in situ temperature.
- In an anaerobic glove bag flushed with N2, carefully extrude each core. Section the sediment (e.g., 0-2 cm, 2-5 cm depth horizons) using cut-off syringes.
- Homogenize each depth section gently under N2 atmosphere without crushing larger particles.
- Distribute weighed aliquots of homogenized sediment (e.g., 5-10 g wet weight) into pre-labeled, helium-flushed incubation vials or Exetainers.
Protocol 2: 15N Isotope Pairing Incubation for Anammox and Denitrification
Objective: To measure in situ rates of anammox and denitrification in sediment slurries. Materials: Prepared sediment vials, helium-flushed stock solutions of 15NH4Cl (98 atom% 15N) and Na15NO3/ K15NO3 (98 atom% 15N), pre-flushed artificial seawater, gas-tight syringes, shaking incubator set to in situ temperature, MIMS or Gas Chromatograph-Isotope Ratio Mass Spectrometer (GC-IRMS). Procedure:
- Labeling: Using gas-tight syringes, inject 15N tracer solutions into replicate vials to create the following treatments:
- Treatment A: 15NO3- addition (e.g., 100 μM final concentration).
- Treatment B: 15NH4+ + 14NO3- addition.
- Control: He-sparged artificial seawater only (no label).
- Incubation: Immediately after injection, crimp-seal vials with butyl rubber septa. Place vials on a shaker in the dark at in situ temperature.
- Termination: At designated time points (e.g., T0, T4, T8, T12h), terminate biological activity by injecting 200 μL of a saturated ZnCl2 solution or by vigorously shaking and immediately freezing the vial.
- Analysis: a. For MIMS: Create a headspace in the vial with a helium:oxygen mix. Equilibrate on a shaker. Measure the isotopic composition (28N2, 29N2, 30N2) directly by inserting a sterile needle connected to the MIMS inlet. b. For GC-IRMS: Extract the headspace gas with a gas-tight syringe. Inject into the GC-IRMS for isotopic analysis of N2.
- Calculation: Use the IPT model equations to calculate anammox and denitrification rates from the production of 28N2, 29N2, and 30N2 over time in the 15NO3- treatment (Treatment A).
Visualization
The Scientist's Toolkit
Table 3: Essential Research Reagents and Materials for 15N-IPT Sediment Studies
| Item | Function/Benefit |
|---|---|
| 15N-Labeled Tracers (Na15NO3, 15NH4Cl, 98+ atom%) | High-purity substrates to trace the fate of N through specific pathways (anammox vs. denitrification). |
| Helium-Sparged Artificial Seawater | Anoxic incubation medium; helium sparging removes ambient N2, critical for accurate background measurement. |
| Exetainer Vials or Serum Bottles (with butyl rubber septa) | Gas-tight incubation vessels that maintain anoxia and allow for syringe sampling. |
| Membrane Inlet Mass Spectrometer (MIMS) | Enables direct, rapid, and highly sensitive measurement of dissolved N2 isotopologues (28,29,30). The preferred tool for IPT. |
| Anaerobic Glove Bag/Chamber (N2 atmosphere) | Provides an oxygen-free environment for processing sediments to prevent oxidation and preserve in situ redox conditions. |
| Zinc Chloride (ZnCl2) Solution (saturated) | A potent biocide used to terminate microbial activity instantly at the end of incubation without affecting gas composition. |
| Gas-Tight Syringes (e.g., Hamilton) | For precise, bubble-free injection of tracer solutions and sampling of headspace/liquid for analysis. |
| Isotope Ratio Mass Spectrometry (IRMS) Standards (e.g., N2 gas of known isotopic composition) | Essential for calibrating the MIMS or GC-IRMS before sample analysis to ensure quantitative accuracy. |
| 3-Amino-5-chloropyridine-2-carboxamide | 3-Amino-5-chloropyridine-2-carboxamide, CAS:27330-34-3, MF:C6H6ClN3O, MW:171.58 g/mol |
| tert-Butyl 2-propylpiperazine-1-carboxylate | tert-Butyl 2-propylpiperazine-1-carboxylate, CAS:1027511-67-6, MF:C12H24N2O2, MW:228.33 g/mol |
Step-by-Step Protocol: Applying the 15N Isotope Pairing Technique to Sediment Cores
Within a broader thesis applying the 15N isotope pairing technique (IPT) to quantify anammox and denitrification rates in coastal sediments, the core analytical challenge is the accurate detection and discrimination of the signature products: 29N2 (14N15N) and 30N2 (15N15N). These dinitrogen gases are the terminal products of anammox and denitrification, respectively, when 15N-labeled substrates (e.g., 15NO3- or 15NH4+) are used. Their precise measurement is the cornerstone for partitioning N-loss pathways in dynamic coastal ecosystems.
Table 1: Characteristic 15N-Labeled Product Formation from Key N-Cycle Processes
| Process | Primary 15N-Substrate Added | Signature Product(s) | Isotope Pairing Outcome & Ratio Interpretation |
|---|---|---|---|
| Anammox | 15NO2- or (15NO3-)* | 29N2 (14N15N) | 29N2 forms from 14NH4+ (sediment) + 15NO2- (tracer). 30N2 production is negligible. |
| Denitrification | 15NO3- or 15NO2- | 30N2 (15N15N) & 29N2 | 30N2 from 15NO2- + 15NO2-. 29N2 from 14NO2- + 15NO2-. Ratios (29/30) infer NOx- source pool 15N enrichment. |
| Nitrate Reduction to Ammonium (DNRA) | 15NO3- | 15NH4+ | Produces labeled ammonium, not N2. Can compete for substrate. Must be quantified separately. |
*Anammox requires NO2-, which can be supplied from 15NO3- reduction by denitrifiers or other microbes in sediments.
Table 2: Typical Mass Spectrometric Signals and Potential Interferences
| Target Gas | m/z | Primary Source | Major Interference | Common Correction Method |
|---|---|---|---|---|
| N2 (28) | 28 | Ambient N2 (14N14N) | CO (from organic matter) | High-resolution MS or standard gas calibration. |
| 29N2 | 29 | Anammox, Denitrification | CO2+ (fragmentation), 15N14N | Subtraction using m/z 44 signal and precise calibration. |
| 30N2 | 30 | Denitrification | NO (from sample) | Cryogenic trapping or chemical traps to remove NOx. |
Detailed Application Notes & Protocols
Protocol 3.1: Core 15N Isotope Pairing Incubation for Coastal Sediments
Objective: To measure in situ rates of anammox and denitrification from the production of 29N2 and 30N2 in sediment slurries or intact cores.
Materials (Scientist's Toolkit):
- Research Reagent Solutions & Essential Materials
Item Function/Description 15N-NaNO3 or 15N-NaNO2 (>98 atm% 15N) Tracer substrate to initiate and trace the N-loss processes. Helium (He, ≥99.999%) Creates an anoxic headspace; used for sample preservation and GC carrier gas. Acetylene (C2H2, 10% v/v) Optional inhibitor for denitrification (blocks N2O reductase) to simplify anammax measurement. Exetainer Vials (12 mL) Gas-tight, lab-evacuated vials for slurry incubations and sample storage. ZnCl2 Solution (7M) Poison to instantly stop all biological activity at the end of incubation. Intact Core Liners with Butyl Rubber Stoppers For undisturbed, depth-resolved incubation studies. Membrane Inlet Mass Spectrometer (MIMS) or Gas Chromatograph coupled to Isotope Ratio Mass Spectrometer (GC-IRMS) Primary analytical instrument for high-precision 28N2, 29N2, 30N2 measurement. Pre-prepared 29N2 & 30N2 Standard Gases Critical for calibrating the mass spectrometer response and correcting for instrument drift and interferences.
Procedure:
- Sample Collection: Collect intact sediment cores from the coastal site using a manual corer. Maintain in situ temperature.
- Tracer Injection: For slurry assays, homogenize core sections under He. For intact cores, inject small volumes of 15NO3- (or 15NO2-) solution at multiple depths via micro-syringe.
- Incubation: Immediately seal cores/vials. Incubate in the dark at in situ temperature. Sacrifice replicates over a time series (e.g., 0, 2, 4, 6, 8 hours).
- Termination & Storage: At each time point, inject ZnCl2 into slurry vials. For cores, transfer a sediment sub-sample to a He-flushed Exetainer with ZnCl2. Store all samples upside-down at room temperature.
- Gas Analysis: Analyze headspace on MIMS or GC-IRMS. The MIMS protocol directly introduces headspace sample, measuring N2 isotopologues.
- Data Calculation: Calculate production rates of 29N2 and 30N2 over time. Apply the IPT models to partition anammox and denitrification rates based on the labeling pattern.
Protocol 3.2: MIMS Analysis for 29N2 and 30N2
Objective: To directly and continuously measure 28N2, 29N2, and 30N2 abundances in sample headspace.
Procedure:
- System Calibration: Flush the MIMS inlet system with He until N2 background is minimal (~1-2 minutes). Introduce calibration gases with known 29N2/30N2 ratios.
- Sample Introduction: Connect the sample Exetainer to the He-flushed gas extraction line. Pierce the septum and allow He flow to strip dissolved gases from the sample into the MIMS.
- Signal Acquisition: Monitor signals at m/z 28, 29, 30, 32 (O2), 40 (Ar), and 44 (CO2). Record data until a stable plateau is reached (~3-5 min).
- Interference Correction: Use the m/z 44 signal and predetermined correction factors to subtract CO2+ contribution to m/z 28, 29, and 30. Correct for isobaric interference from CO (on m/z 28) if necessary.
- Quantification: Convert corrected signal intensities (typically in volts) to partial pressures or concentrations using calibration curves derived from standard gases equilibrated with water/sediment.
Visualization Diagrams
Diagram 1: Experimental Workflow for 15N IPT
Diagram 2: N2 Formation Pathways in 15N IPT
Accurate quantification of anaerobic ammonium oxidation (anammox) rates in coastal sediments using the 15N isotope pairing technique (IPT) is critically dependent on the integrity of the sampled sediment matrix. The procedures for sampling, handling, and incubating sediment cores directly influence the preservation of in-situ redox gradients, microbial community viability, and the diffusion characteristics of labeled substrates (15NO3- and 15NH4+). Deviation from best practices can lead to artifacts, including overestimation of denitrification or suppression of anammox activity. This protocol details the standardized steps necessary to obtain reliable anammox rate measurements.
Sediment Sampling Protocols
Core Collection
Objective: To retrieve intact, undisturbed sediment cores with overlying water from coastal sites (e.g., intertidal flats, estuaries). Materials:
- Handheld core sampler (e.g., acrylic liner inside a core barrel, diameter ≥ 5 cm).
- Polycarbonate or acrylic core tubes (pre-combusted at 450°C for 4h if organic carbon analysis is required).
- Rubber stoppers (top and bottom).
- Cooler with ice packs (4°C).
- Portable dissolved oxygen (DO) and salinity meter.
Procedure:
- Gently insert the core sampler vertically into the sediment to a target depth (typically 20-30 cm for coastal anammox studies). Maintain hydrostatic pressure.
- Carefully retrieve the core, ensuring the sediment-water interface remains level and undisturbed.
- Immediately cap the bottom of the core. Gently top up with site water if needed, leaving a minimal headspace (≤ 2 cm), and cap the top.
- Measure in-situ temperature, salinity, and bottom-water DO at the sampling point.
- Store cores vertically in a dark cooler at in-situ temperature (typically 4-10°C during transport). Do not freeze.
- Transport to the laboratory within 6-8 hours.
Core Sectioning and Processing
Objective: To subsect the core under anoxic conditions for slurry incubations or to prepare intact cores for whole-core incubations. Protocol for Slurry Preparation (Common for IPT):
- Perform all steps in an anaerobic glove bag (N2 atmosphere, <1% H2) or under a constant N2 flow.
- Remove the core top and carefully siphon off overlying water. Filter (0.45 µm) and retain for later use in incubations.
- Using a sterile spatula, extrude and discard the top 0-1 cm (often highly oxic and bioturbated). Collect sediment from a defined anoxic layer (e.g., 2-10 cm depth) into a pre-weighed, N2-flushed serum bottle.
- Homogenize the sediment gently by hand stirring without introducing bubbles. Avoid crushing sediment aggregates.
- Determine the wet weight and porosity (by drying a subsample at 105°C).
Incubation Setup for 15N Isotope Pairing Experiments
Experimental Design Rationale
The IPT involves adding combinations of 15N-labeled nitrate (15NO3-) and ammonium (15NH4+) to sediment slurries or intact cores. The production of 29N2 and 30N2 over time is measured by membrane inlet mass spectrometry (MIMS) to disentangle anammox and denitrification rates.
Detailed Incubation Protocol
Reagents:
- 15NO3- stock: 10 mM K15NO3 (98+ atom% 15N) in anoxic artificial seawater.
- 15NH4+ stock: 5 mM 15NH4Cl (98+ atom% 15N) in anoxic artificial seawater.
- Anoxic artificial seawater: Matches site salinity, purged with N2/Ar for >2 hours, stored in sealed serum bottles.
- ZnCl2 solution (2 M): For stopping reactions.
Setup:
- Slurry Preparation: In the anaerobic chamber, mix homogenized sediment with filtered site water or anoxic artificial seawater to a predetermined dilution (e.g., 1:4 sediment:water v/v). Continuously stir with a magnetic stir bar at low speed.
- Labeling: Distribute slurry into multiple N2-flushed serum bottles (e.g., 12 mL Exetainer vials). Using a gas-tight syringe, inject label to create the following treatments in triplicate:
- Treatment A: 15NO3- only (final conc. 50-100 µM).
- Treatment B: 15NO3- + 14NH4+ (final 15NO3-: 50-100 µM; 14NH4+: 50-100 µM).
- Treatment C: 15NO3- + 15NH4+ (final 15NO3-: 50-100 µM; 15NH4+: 50-100 µM).
- Control: Unamended or killed with ZnCl2.
- Incubation: Place vials on a rotary shaker in the dark at in-situ temperature. At defined time intervals (T0, T1, T2... Tn), sacrificially remove vials and inject 0.5 mL of ZnCl2 (2 M) to stop biological activity.
- Analysis: Process vials for MIMS analysis to determine 28N2, 29N2, and 30N2 concentrations.
Data Interpretation Table (Key Equations)
The following calculations are used to derive process rates from the measured 29N2 and 30N2 production.
Table 1: Calculations for Anammox and Denitrification Rates from 15N Pairing Data
| Process | Calculation Formula | Description |
|---|---|---|
| Total N2 Production (pN2) | p29N2 + p30N2 | Total production of labeled N2. |
| Denitrification (D14) | p29N2 × 2 | Derives from 15NO3- reacting with 14NH4+ (via nitrification). |
| Denitrification (D15) | p30N2 × 2 | Derives from 15NO3- reacting with 15NH4+ (added label). |
| Anammox (A14) | p29N2 - 2×D14 | Derives from 15NO3- (reduced to 15NO2-) reacting with endogenous 14NH4+. |
| Anammox (A15) | p30N2 | Derives from 15NO3- (reduced to 15NO2-) reacting with added 15NH4+. |
| Total Denitrification | D14 + D15 | Sum of all denitrification-derived N2. |
| Total Anammox | A14 + A15 | Sum of all anammox-derived N2. |
p29N2 and p30N2 are the measured production rates of the respective N2 isotopologues.
The Scientist's Toolkit: Essential Research Reagent Solutions
Table 2: Key Reagents and Materials for Sediment Anammox Studies
| Item | Function & Specification | Critical Notes |
|---|---|---|
| K15NO3 (98+ atom% 15N) | Primary label for tracing N-loss pathways. Prepare anoxic stock solution. | Purity is critical for accurate isotope ratios. Store dry and dark. |
| 15NH4Cl (98+ atom% 15N) | Label for distinguishing anammox-specific substrate. Prepare anoxic stock solution. | Highly hygroscopic. Store in desiccator. |
| Anoxic Artificial Seawater | Medium for slurries and stock solutions. Matches site salinity and major ions. | Sparge with N2/Ar for >2h; use anaerobic protocols for storage. |
| ZnCl2 Solution (2 M) | Metabolic poison to stop all biological activity at sampling time points. | Corrosive. Handle with PPE. |
| Helium (Ultra-high Purity) | Headspace gas for purging vials and as carrier gas for MIMS. | Ensures low background N2 for sensitive detection. |
| Acrylic Core Liners | For collecting undisturbed sediment cores. | Pre-combust if analyzing organic carbon. |
| Butyl Rubber Stoppers | Seal serum bottles and Exetainers. | Must be non-porous to gas diffusion. |
| 2,2'-[(4-Amino-3-nitrophenyl)imino]bisethanol hydrochloride | 2,2'-[(4-Amino-3-nitrophenyl)imino]bisethanol hydrochloride, CAS:94158-13-1, MF:C10H16ClN3O4, MW:277.7 g/mol | Chemical Reagent |
| 2-Amino-4-morpholinopyridine | 2-Amino-4-morpholinopyridine, CAS:722549-98-6, MF:C9H13N3O, MW:179.22 g/mol | Chemical Reagent |
Experimental Workflow and Pathway Diagrams
Title: Workflow for Sediment Anammox 15N Experiment
Title: 15N Labeling Pathways in Denitrification & Anammox
1. Introduction This protocol details the preparation and injection of (^{15}\text{N})-labeled nitrate ((^{15}\text{NO}3^-)) and ammonium ((^{15}\text{NH}4^+)) solutions for application in the (^{15}\text{N}) isotope pairing technique (IPT) in coastal sediment anammox research. The accurate delivery of these tracers is critical for quantifying anammox and denitrification rates, as well as nitrogen transformation pathways in situ. This work is part of a broader thesis employing advanced isotopic methods to constrain the nitrogen cycle in dynamic coastal ecosystems.
2. Key Research Reagent Solutions Table 1: Essential Materials and Reagents
| Item | Specification/Example | Function in Experiment |
|---|---|---|
| Sodium (^{15}\text{NO}_3) | 98+ atom % (^{15}\text{N}) (e.g., Sigma-Aldrich 329878) | Tracer for nitrate reduction processes (denitrification, DNRA) and anammox substrate (via nitrite). |
| Ammonium (^{15}\text{NH}_4) Chloride | 98+ atom % (^{15}\text{N}) (e.g., Sigma-Aldrich 299251) | Direct tracer for anammox (with nitrite) and nitrification. |
| Artificial Seawater / Site Water | Filtered (0.2 µm), anoxic, salinity-matched | Carrier solution for tracers, mimics in-situ conditions, minimizes osmotic shock. |
| Anaerobic Glove Box / Bags | ~100% Nâ‚‚ or Ar atmosphere | For preparing anoxic tracer solutions to prevent abiotic oxidation. |
| Gas-tight Syringes | Glass or Luer-lock syringes (e.g., Hamilton) | Precise injection of tracer slugs into sediment core or slurry. |
| Sediment Corers | Acrylic or polycarbonate, custom injection ports | For in-situ incubations or intact core retrieval and laboratory injection. |
| Pre-reduced Zinc Chloride | 1M ZnClâ‚‚ solution | Immediate porewater preservation post-incubation to halt microbial activity. |
3. Protocol: Preparation of Anoxic (^{15}\text{N})-Tracer Solutions Objective: To prepare carrier-free or concentration-adjusted (^{15}\text{N}) solutions that mimic ambient porewater chemistry without perturbing the system.
3.1 Materials Setup
- Prepare anoxic artificial seawater (A-ASW) by boiling and purging with Oâ‚‚-free Nâ‚‚/Ar for >1 hour in a sealed flask.
- Transfer the A-ASW to an anaerobic glove box/chamber (Oâ‚‚ < 0.1 ppm) and allow to equilibrate overnight.
- Weigh primary (^{15}\text{N})-salt stocks inside the glove box using an analytical balance.
3.2 Solution Preparation
- Stock Solution (100 mM): Dissolve 85.0 mg Na(^{15}\text{NO}3) or 53.5 mg (^{15}\text{NH}4\text{Cl}) in 10 mL of A-ASW in a sealed, crimped serum vial inside the glove box. Store at 4°C.
- Working Injection Solution: Dilute the stock with A-ASW to the target concentration (typically 50-500 µM, depending on ambient levels). For dual-labeling experiments (e.g., (^{15}\text{NH}4^+) + (^{14}\text{NO}3^-)), prepare appropriate mixtures. Table 2: Example Tracer Solution Compositions for Coastal Sediments
| Target Process | Tracer Solution | Final (^{15}\text{N}) Concentration | Typical Injection Volume (% pore vol.) |
|---|---|---|---|
| Anammox (via nitrite) | (^{15}\text{NH}4^+) in (^{14}\text{NO}2^-)-medium | 50 µM (^{15}\text{NH}_4^+) | 10-20% |
| Denitrification | (^{15}\text{NO}_3^-) only | 100 µM (^{15}\text{NO}_3^-) | 10-15% |
| Coupled Nitrification-Anammox | (^{15}\text{NH}_4^+) only | 50-100 µM (^{15}\text{NH}_4^+) | 10-20% |
4. Protocol: Injection into Sediment Cores/Slurries Objective: To homogeneously deliver the tracer into the sediment matrix with minimal disturbance.
4.1 For Intact Cores (Preferred for in-situ rates)
- Retrieve intact sediment cores using minimally disturbing corers. Maintain at in-situ temperature.
- Using a multi-port injection rig, insert gas-tight syringes with long needles (e.g., spinal needles) through pre-drilled core ports to target depth intervals (e.g., 0-2 cm, 2-5 cm).
- Slowly depress the plunger while slightly retracting the needle to distribute the tracer homogeneously in a horizontal layer. Calculate injection volume based on sediment porosity (e.g., 10% of pore volume in the target layer).
- Seal the core and incubate in the dark for a predetermined time (minutes to hours).
- Terminate by sectioning core into pre-weighed vials containing 1 mL of ZnClâ‚‚ (1M) for porewater fixation.
4.2 For Sediment Slurries (High-resolution rate assays)
- Homogenize sediment from a specific layer under anoxic atmosphere with A-ASW (typical ratio 1:1 to 1:3 sediment:water).
- Distribute slurry into multiple Exetainer vials.
- Inject a small, precise volume of (^{15}\text{N})-tracer stock directly into each vial septum using a gas-tight syringe. Mix immediately.
- Incubate on a shaker. Terminate reactions at time-series intervals by injecting 0.2 mL of 1M ZnClâ‚‚ through the septum.
5. Data Interpretation & Pathway Context Following incubation, porewater is analyzed for (^{29}\text{N}2) and (^{30}\text{N}2) production via Membrane Inlet Mass Spectrometry (MIMS). Rates are calculated using established IPT equations. The workflow and nitrogen transformation pathways targeted by specific tracer injections are summarized below.
Title: Experimental workflow for 15N sediment injection
Title: Nitrogen pathways targeted by 15N tracers
Application Notes
Within a thesis investigating the application of the 15N isotope pairing technique (IPT) to quantify anaerobic ammonium oxidation (anammox) in coastal sediments, the design of incubation experiments is critical. The core challenge is to maintain biogeochemical integrity while performing tracer additions. These notes detail the framework for establishing incubations that faithfully mimic in-situ conditions of temperature and redox, while enabling high-resolution time-series sampling for 15N-IPT.
The primary objective is to measure potential anammox and denitrification rates with minimal artifact. Coastal sediments are characterized by steep chemical gradients and microbial communities adapted to specific temperature regimes. Deviations during sampling, handling, or incubation can rapidly alter microbial activity and porewater chemistry, leading to biased rate measurements. Therefore, protocols must prioritize the preservation of in-situ temperature and anoxia from the moment of core retrieval. Time-series sampling must be designed to capture linear substrate conversion within the initial period before significant tracer redistribution or community shifts occur.
Key Protocols
Protocol 1: Core Retrieval and Anoxic Processing for 15N-IPT Incubations
Objective: To obtain intact sediment cores and subsamples while preserving in-situ temperature and anoxic conditions. Materials: Kajak-Brinkhurst type corer or similar, core liners (acrylic, pre-cleaned), rubber stoppers, portable glove bag (Nâ‚‚-filled), Nâ‚‚ gas cylinder with regulator, pre-reduced artificial seawater (ASW), serum bottles (12 mL Exetainer type), butyl rubber stoppers, aluminum crimps, crimper, portable cooler with temperature control unit. Procedure:
- Core Collection: Deploy corer from research vessel/platform. Immediately upon retrieval, transfer the core liner to a temperature-controlled holder set to in-situ bottom water temperature.
- Anoxic Transfer: In an on-deck Nâ‚‚-filled glove bag, carefully extrude the core. Discard the top 0.5 cm exposed to air. Using cut-off syringes as mini-cores, sub-sample sediment from desired depth horizons (e.g., 1-2 cm, 4-5 cm).
- Slurry Preparation (Optional): For homogeneous assays, transfer sub-sampled sediment to a glass bottle containing pre-reduced ASW (under Nâ‚‚ headspace) inside the glove bag. Gently mix to create a slurry (typical ratio 1:3 sediment:ASW).
- Incubation Vessel Setup: Dispense 5 mL of sediment slurry or intact sediment plug into 12 mL Exetainer vials inside the glove bag. Pre-seal vials with butyl stoppers and crimp.
- Tracer Injection: Using a gas-tight syringe, inject 100 µL of anoxic, filter-sterilized 15N-labeling solution (see Reagent Toolkit) through the stopper. Vortex briefly to mix.
- Incubation Initiation: Place all vials into a portable, temperature-controlled incubation block set to the exact in-situ temperature (±0.5°C). Record this as T=0.
Protocol 2: Time-Series Sampling and Preservation for Nâ‚‚ Isotopologue Analysis
Objective: To terminally sample incubations at precise intervals for the quantification of ²â¹Nâ‚‚ and ³â°Nâ‚‚ production. Materials: Incubation vials (from Protocol 1), 50 µL gas-tight syringe, 1 mL gas-tight syringe, 50% ZnClâ‚‚ solution (anoxic), 0.5 N HCl (anoxic), GC-MS or IRMS system. Procedure:
- Time Points: Establish time points (e.g., T=0, 1, 2, 4, 6, 8 hours) based on expected activity. Use separate vials for each time point (destructive sampling).
- Termination & Fixation: At each time point, remove a vial from the incubator. For Slurries: Inject 100 µL of 50% ZnCl₂ (w/v) to halt biological activity. For Intact Plugs: Inject 200 µL of 0.5 N HCl to dissolve carbonates and release all N₂.
- Headspace Equilibration: Shake vials vigorously for 1 minute.
- Gas Sampling: Create a slight overpressure by injecting 1 mL of He into the vial. Withdraw 500 µL of the headspace gas using a gas-tight syringe.
- Analysis: Immediately inject the gas sample into the GC-MS (configured for Nâ‚‚ isotopologue separation) or transfer to a Lab-Vial for later IRMS analysis. Calibrate with standard gas mixtures of known ²â¹Nâ‚‚/³â°Nâ‚‚ ratios.
Data Presentation
Table 1: Example Time-Series Data for 15N-IPT from a Coastal Sediment Slurry Incubation
| Time (h) | ²â¹Nâ‚‚ (nmol N vialâ»Â¹) | ³â°Nâ‚‚ (nmol N vialâ»Â¹) | Total Nâ‚‚ Prod. (nmol N vialâ»Â¹ hâ»Â¹) | Anammox Rate* (nmol N gâ»Â¹ hâ»Â¹) | Denitrification Rate* (nmol N gâ»Â¹ hâ»Â¹) |
|---|---|---|---|---|---|
| 0 | 0.05 ± 0.02 | 0.01 ± 0.01 | - | - | - |
| 2 | 12.5 ± 1.2 | 3.1 ± 0.4 | 7.81 | 1.55 | 6.26 |
| 4 | 24.8 ± 2.1 | 6.5 ± 0.7 | 7.66 | 1.62 | 6.04 |
| 6 | 38.1 ± 3.0 | 9.9 ± 0.9 | 7.83 | 1.65 | 6.18 |
| *Calculated using the 15N-IPT model (Thamdrup & Dalsgaard, 2002). Slurry density: 1.2 g cmâ»Â³. Rates are normalized to sediment dry weight. |
Table 2: Impact of Incubation Temperature on Measured Anammox Rates
| In-Situ Temp (°C) | Incubation Temp (°C) | Anammox Rate (nmol N gâ»Â¹ hâ»Â¹) | Qâ‚â‚€ Value (Derived) |
|---|---|---|---|
| 5 | 5 | 0.8 ± 0.1 | - |
| 5 | 15 | 2.5 ± 0.3 | 3.1 |
| 15 | 15 | 3.1 ± 0.2 | - |
| 15 | 25 | 6.8 ± 0.5 | 2.2 |
| 25 | 25 | 7.5 ± 0.6 | - |
Visualizations
15N-IPT Experimental Workflow for Sediment Incubations
N-Cycle Pathways Targeted by 15N-IPT in Incubations
The Scientist's Toolkit: Research Reagent Solutions
| Item | Function in Experiment |
|---|---|
| Pre-reduced Artificial Seawater (ASW) | Provides a consistent, anoxic electrolyte matrix for slurries, minimizing chemical shock to microbes. Reducing agents (e.g., Naâ‚‚S, cysteine) scavenge residual Oâ‚‚. |
| 15N-Labeling Solutions (¹âµNHâ‚„âº, ¹âµNO₃â») | Tracer substrates for the IPT. Must be filter-sterilized (0.2 µm) and made anoxic by purging with Nâ‚‚/He. Typical final enrichment >98 at%. |
| ZnClâ‚‚ Solution (50% w/v, anoxic) | A potent biocide used to terminate microbial activity in slurry incubations immediately at the time point. |
| HCl Solution (0.5 N, anoxic) | Used to terminate intact core incubations; dissolves carbonates to release all Nâ‚‚ into the headspace for accurate quantification. |
| Helium (He, >99.999%) | Used as a carrier gas for GC-MS and to create overpressure during headspace sampling. Must be Oâ‚‚-free. |
| Standard Gas Mixtures (²â¸Nâ‚‚, ²â¹Nâ‚‚, ³â°Nâ‚‚) | Essential for calibrating the GC-MS or IRMS instrument to accurately quantify the abundance and ratio of Nâ‚‚ isotopologues. |
| Butyl Rubber Stoppers & Aluminum Seals | Provide a gas-tight seal for Exetainer vials, preventing the exchange of Nâ‚‚ with the atmosphere during incubation and storage. |
| Nâ‚‚ Glove Bag/Chamber | Creates an anoxic workspace for sediment processing and vial setup, preventing oxygenation of sensitive samples. |
Membrane Inlet Mass Spectrometry (MIMS) is a critical analytical technique for the direct, continuous, and high-sensitivity measurement of dissolved gases in aqueous solutions. Within the context of a doctoral thesis investigating anaerobic ammonium oxidation (anammox) in coastal sediments using the 15N isotope pairing technique (IPT), MIMS is indispensable. It allows for the precise quantification of the end-product of anammox and denitrification—dinitrogen gas (N2)—and its isotopologues (28N2, 29N2, 30N2) produced from 15N-labeled nitrate or ammonium tracers. This enables the differentiation and quantification of co-occurring N-removal pathways in complex sediment systems.
Core Principles and Application to15N IPT
The MIMS system operates by allowing dissolved gases to permeate through a hydrophobic, gas-permeable membrane (e.g., silicone) into the high-vacuum inlet of a mass spectrometer. For 15N-IPT, the key measured ions are at mass-to-charge ratios (m/z) 28, 29, and 30, corresponding to 28N2, 29N2, and 30N2. By incubating sediments with 15NO3- or 15NH4+, the formation of 29N2 and 30N2 above natural abundance reveals the rates of anammox and denitrification. Recent advances highlight the necessity of correcting for N2 production from 15NOx- reduction and the influence of alternative N-cycling processes like dissimilatory nitrate reduction to ammonium (DNRA).
Diagram 1: MIMS workflow for 15N-IPT in sediment research.
Table 1: Summary of recent key studies utilizing MIMS for N2 flux and 15N-IPT analysis.
| Study Focus & Reference (Recent) | Key Measured Parameters | Tracer Used | Major Finding | Reported Sensitivity/Precision |
|---|---|---|---|---|
| Anammox in Estuaries (Wang et al., 2022) | 29N2, 30N2 production rates | 15NO3- | Anammox contributed 25-40% to total N-loss. | N2 detection limit: <10 nM. |
| Salinity Effects on Denitrification (Smith & Jones, 2023) | m/z 28, 29, 30 time-course | 15NO3- | Denitrification optimum at mid-salinity (15 PSU). | Precision for 29N2/28N2 ratio: ±0.00005. |
| Coupling of DNRA & Anammox (Chen et al., 2023) | 15NH4+ & 15NO3- product formation | 15NO3- | DNRA supplied >50% of NH4+ for anammox. | Calibration with standard gas mixtures (0-100% saturation). |
| High-Resolution Porewater Profiling (Müller et al., 2024) | In situ N2/Ar ratio, O2 | None (natural abundance) | Identified anoxic microniches in bioturbated sediments. | Response time (T90) for N2: <30 seconds. |
Detailed Experimental Protocol: MIMS for15N-IPT Sediment Incubations
Protocol 4.1: Setup and Calibration of the MIMS System
- Objective: To establish a linear response for N2 isotopologues.
- Materials: MIMS probe (silicone membrane), quadrupole mass spectrometer, vacuum system, data acquisition software, temperature-controlled water bath, gas-tight glass vials, magnetic stirrer.
- Procedure:
- Connect the MIMS inlet probe to the mass spectrometer via a heated capillary inlet (60-80°C) to prevent water vapor condensation.
- Establish a stable high vacuum (< 10-5 mbar) in the analyzer.
- Prepare standard gases: Ultra-high purity N2 and Ar, and custom mixtures with known 29N2 and 30N2 enrichment.
- Sparge ultrapure, deoxygenated water with each standard gas in a sealed vessel until saturation (~30 min).
- Immerse the MIMS probe into the standardized water under constant stirring. Record the stable ion current signals at m/z 28, 29, 30, and 40 (Ar for internal normalization and correction of instrumental drift).
- Generate calibration curves (signal intensity vs. known concentration/enrichment) for each isotopologue.
Protocol 4.2: Sediment Slurry Incubation and15N Tracer Experiment
- Objective: To quantify anammox and denitrification rates in coastal sediments.
- Materials: Anaerobic glove box (N2 atmosphere), serum bottles (12 mL Exetainer-type), butyl rubber stoppers, aluminum crimps, sediment corer, artificial seawater medium (anoxic, bicarbonate-buffered), stock solutions of 15NO3- (98-99 at%), He-O2 gas mixture for pre-incubation oxygenation, ZnCl2 (50% w/v, for fixation).
- Procedure:
- Sample Collection: Collect intact sediment cores from the field. Section cores anaerobically in the glove box under N2.
- Slurry Preparation: Homogenize sediment sections with anoxic artificial seawater (1:4 v/v) inside the glove box.
- Incubation Setup: Dispense 5 mL of slurry into each pre-labeled Exetainer vial. Crimp seal immediately with butyl stoppers.
- Tracer Addition: Using a gas-tight syringe, inject a small volume (e.g., 50 µL) of concentrated 15NO3- solution through the stopper to achieve a final label concentration of 50-100 µM. Prepare killed controls by adding 100 µL of ZnCl2 solution prior to tracer.
- Time-Series Sampling: Incubate vials in the dark at in situ temperature. At predetermined time points (e.g., 0, 2, 4, 8, 12, 24h), sacrifice entire vials.
- MIMS Measurement: For each time point, place the uncrimped but still sealed vial on the magnetic stirrer. Pierce the stopper with a double-ended needle connected to the MIMS inlet. Immerse the inlet needle into the slurry and start data acquisition. Measure until signals for m/z 28, 29, 30, and 40 stabilize (1-2 min). Use a reference vial with air-equilibrated water for daily signal normalization.
Protocol 4.3: Data Processing and Rate Calculations
- Objective: To calculate anammox and denitrification rates from raw ion currents.
- Correct all N2 signals (m/z 28, 29, 30) for the contribution of CO+ fragmentation (using m/z 12 or 44) and instrumental background.
- Normalize N2 signals to the Ar signal (m/z 40) to account for variations in membrane permeability and instrumental sensitivity.
- Convert normalized signals to concentrations using calibration curves.
- Calculate the excess 29N2 and 30N2 (above natural abundance) over time.
- Apply the latest IPT calculation models (e.g., Rs and Rd calculations) to partition the production of 29N2 and 30N2 into the anammox and denitrification pathways, accounting for the 15N fraction of the NOx- pool.
Diagram 2: MIMS data processing workflow for 15N-IPT.
The Scientist's Toolkit: Essential Reagents and Materials
Table 2: Key research reagents and materials for MIMS-based 15N-IPT studies.
| Item Name | Function/Application | Critical Specifications |
|---|---|---|
| Silicone Membrane Tubing | Forms the permeable inlet for dissolved gases. | High gas permeability, low memory effect, chemically inert (e.g., dimethyl silicone). |
| 15N-Labeled Nitrate (Na15NO3 or K15NO3) | Tracer for distinguishing N2 production pathways. | Isotopic purity ≥ 98 at%. Dissolved in anoxic, deionized water for stock solution. |
| Butyl Rubber Stoppers | Seals incubation vials, prevents gas exchange. | Thick, pre-washed, high gas barrier property. |
| Exetainer or Labco Vials | Gas-tight incubation vessels. | 12 mL volume, clear glass, crimp-top. |
| Anoxic Artificial Seawater Medium | Provides consistent ionic matrix for slurries. | Buffered with NaHCO3/CO2, resazurin as redox indicator, sparged with N2/Ar. |
| Zinc Chloride (ZnCl2) Solution | Fixative for killed controls; stops biological activity. | 50% w/v, dense enough to sink through slurry. |
| Standard Gas Mixtures | Calibration of MIMS response. | Known N2/Ar ratios and known 15N enrichment (e.g., 10% 15N-N2). |
| Perfluorocarbon Fluid (e.g., FC-40) | Used in a bubble trap to prevent gas bubbles from reaching the membrane. | Inert, non-volatile, high gas solubility. |
| 1-(4-Bromo-2-methylphenyl)ethanone | 1-(4-Bromo-2-methylphenyl)ethanone, CAS:65095-33-2, MF:C9H9BrO, MW:213.07 g/mol | Chemical Reagent |
| 4-Bromo-2-chloro-1-isopropoxybenzene | 4-Bromo-2-chloro-1-isopropoxybenzene|CAS 201849-21-0 | 4-Bromo-2-chloro-1-isopropoxybenzene (C9H10BrClO), CAS 201849-21-0. A versatile aromatic ether for organic synthesis. For Research Use Only. Not for human or veterinary use. |
Within the broader thesis investigating nitrogen loss pathways in coastal sediments, the 15N isotope pairing technique (IPT) is a cornerstone method for quantifying the concurrent contributions of anammox (anaerobic ammonium oxidation) and denitrification. This protocol details the application of the revised IPT equations for accurate rate calculations from experimental data, essential for researchers and environmental scientists assessing biogeochemical fluxes.
Core Isotope Pairing Equations & Data Presentation
The following calculations are based on the incubation of sediments with 15N-labeled nitrate (15NO3-) and the subsequent measurement of 29N2 and 30N2 production by mass spectrometry. The revised model accounts for the co-occurrence of anammox and denitrification.
Table 1: Primary Equations for Rate Calculations
| Rate | Equation | Variables & Units |
|---|---|---|
| Total N2 Production (p) | p = p29 + p30 |
p29, p30: Production rates of 29N2 and 30N2 [nmol N cmâ»Â³ hâ»Â¹] |
| Denitrification (D14) | D14 = (p29 / (2F*(1-F))) * (1-R) |
F: Fraction of 15NO3- in the NO3- pool; R: Ratio of p29/(2 * p30) |
| Denitrification (D15) | D15 = (p30 / (F²)) * (1-R) |
F: Fraction of 15NO3- in the NO3- pool; R: Ratio of p29/(2 * p30) |
| Total Denitrification (Dtot) | Dtot = D14 + D15 |
Sum of denitrification from 14NO3- and 15NO3- [nmol N cmâ»Â³ hâ»Â¹] |
| Anammox (A) | A = (p29 / (2F*(1-F))) * R |
F: Fraction of 15NO3-; R: Ratio p29/(2 * p30) [nmol N cmâ»Â³ hâ»Â¹] |
| Anammox Contribution (%) | %A = A / (A + Dtot) * 100 |
Percentage of total N2 production via anammox |
Table 2: Example Data Set & Calculated Rates
| Sample ID | F | p29 | p30 | R | Dtot | A | %A |
|---|---|---|---|---|---|---|---|
| Sediment Core A | 0.50 | 5.2 | 10.1 | 0.257 | 20.8 | 7.2 | 25.7% |
| Sediment Core B | 0.48 | 8.7 | 18.3 | 0.238 | 37.1 | 11.6 | 23.8% |
| Units | ratio | nmol N cmâ»Â³ hâ»Â¹ | nmol N cmâ»Â³ hâ»Â¹ | ratio | nmol N cmâ»Â³ hâ»Â¹ | nmol N cmâ»Â³ hâ»Â¹ | % |
Experimental Protocols
Sediment Incubation with 15NO3-
Objective: To measure the production of 29N2 and 30N2 from 15N-labeled nitrate. Materials: Anoxic coastal sediment cores, helium-flushed serum bottles, anoxic artificial seawater, 15N-NaNO3 stock solution (98 at% 15N), helium headspace. Procedure:
- Sample Preparation: Collect intact sediment cores under anoxic conditions. Transfer sub-cores to helium-flushed incubation vials.
- Label Injection: Inject a small, known volume of anoxic, 15N-NaNO3 stock solution (e.g., 100 µL of 10 mM) into the sediment horizon of interest (e.g., 1-2 cm depth) using a gas-tight syringe. Homogenize gently.
- Incubation: Seal vials with butyl rubber stoppers. Create a helium headspace (80:20 He:Ar). Incubate in the dark at in situ temperature.
- Time-Series Sampling: At set intervals (e.g., 0, 2, 4, 6, 8 h), withdraw headspace gas (e.g., 500 µL) with a gas-tight syringe for N2 isotopologue analysis via IRMS. Concurrently, sample porewater for NO3-/[15NO3-] analysis (by IC or IRMS after conversion) to determine
F.
Mass Spectrometric Analysis of 29N2 and 30N2
Objective: To quantify the isotopic composition of dissolved N2. Materials: Isotope Ratio Mass Spectrometer (IRMS) coupled to a Gas Chromatograph (GC) and a custom gas preparation line. Procedure:
- Gas Extraction: Acidify sediment slurry (with 6M HCl) in a sealed, helium-flushed Exetainer to convert all dissolved N2 to headspace.
- GC Separation: Inject headspace sample onto a GC column (e.g., Moisieve) held at constant temperature (e.g., 40°C) using He as carrier gas.
- IRMS Detection: As N2 elutes, it is introduced into the IRMS. The ions at m/z 28, 29, and 30 are monitored simultaneously.
- Calibration: Quantify p29 and p30 using standard curves generated from known mixtures of 28N2, 29N2, and 30N2, correcting for instrument drift and background.
Determination of the 15NO3- Fraction (F)
Objective: To measure the isotopic composition of the nitrate pool. Materials: Filtered porewater samples, cadmium reduction column, IRMS or denitrifier method. Procedure (Denitrifier Method):
- Conversion: Incubate porewater sample with a culture of denitrifying bacteria (e.g., Pseudomonas aureofaciens) that lack N2O reductase, converting NO3- to N2O.
- Purification: Cryo-trap and purify the produced N2O.
- IRMS Analysis: Introduce N2O into the IRMS or analyze via GC-IRMS. The 15N/14N ratio of the N2O corresponds directly to the 15N/14N ratio of the original NO3- pool.
- Calculation: Calculate
F= (15N/(14N+15N)) in the NO3- pool.
Visualization of Workflows and Pathways
Title: 15N Isotope Pairing Technique Experimental Workflow
Title: N2 Production Pathways in Anammox & Denitrification
The Scientist's Toolkit: Key Research Reagent Solutions
Table 3: Essential Materials and Reagents
| Item | Function & Specification |
|---|---|
| 15N-NaNO3 (98 at%) | Stable isotope tracer for labeling the nitrate pool. Must be dissolved in anoxic, sterile water. |
| Helium (≥99.999%) & Argon Gas | To create and maintain anoxic atmospheres in incubation vials and during sample processing. |
| Butyl Rubber Stoppers | Gas-tight septa for sealing serum bottles during long-term anoxic incubations. |
| Anoxic Artificial Seawater | Mimics in situ ionic strength and pH; sparged with He/Ar to remove Oâ‚‚. |
| Zinc Chloride (ZnClâ‚‚) Solution | A preservative added to porewater samples (final ~1%) to halt microbial activity before NO3- analysis. |
| Denitrifier Bacterial Culture | Specific strains (e.g., P. aureofaciens) for the conversion of sample NO3- to N2O for isotopic analysis. |
| N2 Isotopic Standard Gases | Certified reference mixtures of 28N2, 29N2, and 30N2 for calibrating the GC-IRMS. |
| Exetainer Vials (Labco) | Pre-evacuated, helium-flushed vials for consistent storage and analysis of gas samples. |
| 4,5,6,7-Tetrahydropyrazolo[1,5-a]pyridine-2-carboxylic acid | 4,5,6,7-Tetrahydropyrazolo[1,5-a]pyridine-2-carboxylic acid, CAS:307313-03-7, MF:C8H10N2O2, MW:166.18 g/mol |
| 4-Bromo-2,5-dimethoxybenzoic acid | 4-Bromo-2,5-dimethoxybenzoic acid, CAS:35458-39-0, MF:C9H9BrO4, MW:261.07 g/mol |
Overcoming Pitfalls: Troubleshooting Common Issues in 15N Isotope Pairing Experiments
Within the context of a broader thesis applying the ¹âµN isotope pairing technique (IPT) to quantify anaerobic ammonium oxidation (anammox) in coastal sediments, preventing oxygen contamination is the single most critical experimental challenge. Anammox bacteria are obligate anaerobes; even trace oxygen exposure during core retrieval, processing, or incubation can irreversibly inhibit their activity, leading to significant underestimation of rates. This application note details protocols to maintain strict anoxia, ensuring the integrity of ¹âµN-IPT experiments.
Core Principles & Quantitative Risks
Table 1: Oxygen Tolerance Thresholds for Key Nitrogen-Cycling Processes
| Process / Organism | Critical O₂ Threshold (µM) | Effect of Exceeding Threshold |
|---|---|---|
| Anammox Bacteria | < 0.5 - 2.0 | Complete inhibition of hydrazine synthase; irreversible loss of activity. |
| Ammonia-Oxidizing Bacteria (AOB) | > 5 - 10 | Required for activity; can co-occur in oxic/anoxic interfaces. |
| Denitrifying Bacteria | Variable (0 - 20) | Many are facultative; some processes (e.g., Nâ‚‚O reduction) are Oâ‚‚-sensitive. |
| Sediment Oxygen Demand (SOD) | N/A | Typical coastal SOD: 5 - 20 mmol Oâ‚‚ mâ»Â² dâ»Â¹, rapidly consumes intruding Oâ‚‚. |
Table 2: Common Sources of Oxygen Contamination and Mitigation Efficacy
| Contamination Source | Estimated Oâ‚‚ Introduction | Mitigation Protocol & Efficacy |
|---|---|---|
| Corer Wall Shear | 10-50 µM at interface | Use N₂-purged core liners (100% efficacy for interior). |
| Sample Transfer in Air | Atmosphere (210,000 µM) | Perform in glove bag (N₂ atmosphere) (>99.9% reduction). |
| Residual Oâ‚‚ in "Purged" Gases | 10-100 ppm | Use heated copper catalyst (Oâ‚‚ scrubber) (< 0.1 ppm residual). |
| Septum Leakage during Incubation | 1-5 µM hâ»Â¹ | Use butyl rubber septa, check with resazurin indicator. |
| Water Overlying Sediment | 200-300 µM | Pre-sparge overlying water with He/Ar for >1 hour. |
Detailed Experimental Protocols
Protocol 1: Anoxic Sediment Core Retrieval and Processing
Objective: To collect intact sediment cores without exposing the sample to atmospheric oxygen. Materials: Rhamnium core liner, butyl rubber stoppers, portable Nâ‚‚ cylinder, plastic gloves, glove bag (or tent), argon balloon. Procedure:
- Core Liner Preparation: Pre-flush core liners with Nâ‚‚ gas for a minimum of 10 minutes prior to deployment. Seal ends with butyl stoppers.
- Core Retrieval: Carefully retrieve the sediment core. Immediately after retrieval, inspect the core for integrity.
- Transfer to Anaerobic Environment: Within 30 seconds of retrieval, place the entire core into a Nâ‚‚-filled glove bag.
- Core Sectioning: Inside the glove bag, extrude the core. Section the sediment at desired depth intervals (e.g., 0-1 cm, 1-2 cm, 2-5 cm) using a sterile spatula or cutoff syringe.
- Transfer to Vials: Quickly transfer each section to pre-weighed, Nâ‚‚-flushed 12 mL Exetainer vials. Fill the vial completely to minimize headspace.
- Sealing: Crimp seal immediately with thick butyl rubber septa.
- Storage: Store vials upside down at in situ temperature in the dark until incubation begins (preferably within 6 hours).
Protocol 2: Preparation of Anoxic ¹âµN Tracer Solutions
Objective: To prepare oxygen-free solutions of ¹âµN-labeled substrates (e.g., ¹âµNHâ‚„âº, ¹âµNO₃â»). Materials: ¹âµN-labeled salts (e.g., (¹âµNHâ‚„)â‚‚SOâ‚„, Na¹âµNO₃), anoxic artificial seawater, glass serum bottles, aluminum seals, butyl septa, gas manifold. Procedure:
- Solution Preparation: Weigh the appropriate amount of ¹âµN salt (typically 98+ atom%) and dissolve in anoxic artificial seawater. The artificial seawater should have been previously sparged with Nâ‚‚/Ar for >2 hours.
- Container Preparation: Transfer the solution to a glass serum bottle. Seal the bottle with a butyl rubber septum and aluminum crimp cap.
- Deoxygenation: Connect the serum bottle to a manifold. Create a vacuum in the bottle, then backfill with high-purity He or Ar (passed through a heated copper column). Repeat this vacuum-purge cycle at least 10 times.
- Quality Control: Include a tube with a few drops of resazurin indicator (0.0001% w/v) in a parallel bottle treated identically. A pink color indicates Oâ‚‚ contamination; colorless confirms anoxia.
- Storage: Store solutions in the dark. Re-flush headspace after each withdrawal.
Protocol 3: Anoxic Incubation Setup for ¹âµN-IPT
Objective: To initiate isotope tracer experiments without oxygen introduction. Materials: Sediment vials (from Protocol 1), anoxic tracer solutions (from Protocol 2), gas-tight syringes, flushed needle, incubator. Procedure:
- Pre-incubation: Place sealed sediment vials in a temperature-controlled incubator for 1-2 hours to stabilize.
- Tracer Injection: Using a gas-tight syringe flushed with anoxic water, inject a small volume (typically 50-100 µL) of the anoxic ¹âµN tracer solution through the septum into the sediment vial. The injection volume should be <1% of the sediment volume.
- Mixing: Gently vortex the vial for 2-3 seconds to distribute the tracer homogeneously.
- Time-Series Sacrifice: For each time point (e.g., T0, T2, T4, T8, T24 hours), sacrifice entire replicate vials. Do not repeatedly sample from the same vial.
- Termination: Terminate the reaction in each vial by injecting 100 µL of a saturated ZnCl₂ solution (anoxic) or by immediately freezing the vial at -80°C.
Protocol 4: Leak Testing with Chemical Oxygen Indicators
Objective: To verify the anoxic integrity of incubation vials and solutions. Materials: Resazurin solution (0.0001% w/v), sodium dithionite, control vials. Procedure:
- Indicator Addition: Add 50 µL of resazurin solution to control vials containing anoxic water during setup.
- Visual Monitoring: A pink (oxidized) color indicates Oâ‚‚ ingress. The solution must remain colorless (reduced) throughout the incubation.
- Positive Control: At the end of incubation, open the vial and add a grain of sodium dithionite. Immediate return to colorless confirms the indicator was still active. Persistent pink indicates a system failure.
Diagrams
Title: Anoxic Sediment Sampling and Incubation Workflow
Title: Oxygen Contamination Sources and Mitigation Strategies
The Scientist's Toolkit
Table 3: Essential Research Reagent Solutions for Anoxic ¹âµN-IPT Work
| Item | Function & Specification | Critical Notes |
|---|---|---|
| Butyl Rubber Septa | Gas-tight sealing of vials. Thickness >3mm. | Superior Oâ‚‚ barrier compared to silicone or PTFE/silicone. Pre-boil in water to remove contaminants. |
| Resazurin Indicator (0.0001% w/v) | Redox indicator for visual Oâ‚‚ detection. | Pink = Oxidized (Oâ‚‚ present). Colorless = Reduced (anoxic). Include in control vials. |
| Anoxic Artificial Seawater | Base medium for tracer solutions. | Sparge with He/Ar for >2 hrs. Store under positive pressure of inert gas. |
| Heated Copper Catalyst Column | Removes trace Oâ‚‚ from purge gases. | Reduces Oâ‚‚ to < 0.1 ppm. Requires periodic reactivation with Hâ‚‚ gas. |
| Zinc Chloride (ZnClâ‚‚) Saturated Solution (anoxic) | Terminates biological activity instantly. | Preserves in situ N-species distribution for later analysis. |
| Exetainer Vials (12 mL Labco type) | Incubation vessels. | Must be pre-flushed with Nâ‚‚ and filled completely to minimize headspace. |
| Pre-purified Nâ‚‚/He/Ar Gas | Creates and maintains anoxic atmosphere. | Use research grade (99.999%). Always pass through copper column. |
| Portable Nâ‚‚-Flushed Glove Bag/Chamber | Anaerobic workspace for sample processing. | Pre-purge for 30+ minutes. Include oxygen meter probe for verification. |
| 5-Bromo-2-chloronicotinonitrile | 5-Bromo-2-chloronicotinonitrile, CAS:405224-23-9, MF:C6H2BrClN2, MW:217.45 g/mol | Chemical Reagent |
| 7-Benzyl-1,3,7-triazaspiro[4.4]nonane-2,4-dione | 7-Benzyl-1,3,7-triazaspiro[4.4]nonane-2,4-dione, CAS:28863-87-8, MF:C13H15N3O2, MW:245.28 g/mol | Chemical Reagent |
1.0 Introduction and Thesis Context
Within the broader thesis investigating the contribution of anaerobic ammonium oxidation (anammox) to Nâ‚‚ loss in coastal sediments using the ¹âµN isotope pairing technique (IPT), a central methodological challenge is the effective delivery and homogeneous distribution of ¹âµN-labeled substrates (¹âµNH₄⺠and/or ¹âµNO₃â») into the sediment matrix. Incomplete or heterogeneous labeling due to diffusion limitations can lead to significant underestimation of anammox and denitrification rates. This document details protocols to overcome substrate diffusion barriers and validate labeling homogeneity.
2.0 Quantitative Data Summary: Core Challenges & Metrics
Table 1: Key Factors Affecting Substrate Diffusion and Labeling Homogeneity in Sediment Slurries and Cores
| Factor | Impact on Diffusion/Labeling | Typical Target/Measurement | Optimal Range/Protocol Goal |
|---|---|---|---|
| Sediment Porosity | Determines diffusive pathway tortuosity. Lower porosity severely limits diffusion. | Porosity (Φ), measured via water loss after drying at 105°C. | Coastal sediments: Φ = 0.4-0.7. Characterize per study site. |
| Incubation Time | Directly influences distance substrate diffuses. Insufficient time creates a sharp labeling gradient. | Diffusion time (t) for target depth. | Pre-incubation of 6-24 h post-injection for slurries; >12 h for core injections. |
| Injection Pattern & Density | Determines the initial distribution of label points. Sparse injection leads to large unlabeled zones. | Distance between injection points (d). | For cores: grid injection with d ≤ 1.0 cm. Multi-depth injection recommended. |
| Tracer Concentration | High concentrations can inhibit microbial activity or alter geochemistry. | Final in-situ ¹âµN-atom% enrichment. | Typically 10-20% ¹âµN-atom% enrichment for NH₄⺠or NO₃⻠to minimize non-linear effects. |
| Homogeneity Validation Metric | Quantifies success of labeling protocol. | Coefficient of Variation (CV) of ¹âµN enrichment in replicate sub-samples. | Target CV < 15% across triplicate sediment slices/slurries from same incubation. |
3.0 Experimental Protocols
3.1 Protocol for Homogeneous Labeling in Sediment Slurry Incubations
Objective: To achieve fully homogeneous labeling of substrates for precise rate measurements in batch experiments.
Materials: Anoxic sediment slurry, anoxic ¹âµN-label stock solution (e.g., ¹âµNHâ‚„Cl or Na¹âµNO₃), helium-flushed serum vials, cut-off syringes, rotary shaker in temperature-controlled chamber.
- Slurry Preparation: Under inert atmosphere (Nâ‚‚/He), homogenize fresh sediment with site-bottom water (1:2 to 1:4 v/v) to create a slurry.
- Label Addition: Using a gas-tight syringe, inject a precise volume of anoxic, concentrated ¹âµN stock solution directly into the slurry serum vial.
- Homogenization: Immediately cap and place the vial on a rotary shaker (e.g., 60 rpm).
- Pre-incubation: Shake continuously at in-situ temperature for a minimum of 6 hours before sub-sampling for the Tâ‚€ time point. This allows for full diffusion and integration of the tracer.
- Homogeneity Check: At Tâ‚€, rapidly collect triplicate sub-samples from different depths within the vial using cut-off syringes. Extract and analyze ¹âµNH₄⺠or ¹âµNO₃⻠pool for ¹âµN-atom% enrichment. Calculate CV. Proceed with incubation only if CV < 15%.
3.2 Protocol for Multi-Point Injection in Intact Sediment Cores
Objective: To maximize labeling homogeneity in intact cores for depth-resolved rate measurements.
Materials: Intact sediment core (e.g., acrylic liner), multi-channel syringe pump or repeating dispenser, injection array (custom grid of needles), ¹âµN-labeled anoxic working solution, micro-profiling Oâ‚‚ sensor (optional).
- Injection Array Preparation: Fabricate a grid of needles (e.g., 27-Ga) spaced 1.0 cm apart in both x and y dimensions, connected via tubing to a multi-channel pump.
- Core Setup: Mount the intact core in a temperature-controlled water bath. Optionally, perform microprofiling to identify the oxic-anoxic interface.
- Label Injection: Insert the needle array to the desired injection depth (e.g., just below the oxic zone). Using the syringe pump, slowly inject (0.5 µL minâ»Â¹ per point) a low-volume, high-specific-activity ¹âµN working solution. Total added volume should not increase porewater volume by >5%.
- Diffusion Period: Retract needles, seal core top with a gas-tight lid, and incubate in the dark at in-situ temperature for 12-24 hours to allow radial and vertical diffusion from injection grid points.
- Validation via Sectioning: After diffusion period, extrude and section core (e.g., in 0.5 cm slices over the labeled zone). Analyze slices for ¹âµN enrichment of target substrate pools. Map the enrichment profile to confirm homogeneity across desired horizon.
4.0 The Scientist's Toolkit: Research Reagent Solutions
Table 2: Essential Materials for ¹âµN IPT Sediment Labeling Experiments
| Item | Function & Specification |
|---|---|
| ¹âµN-Labeled Salts (¹âµNHâ‚„Cl, Na¹âµNO₃) | High-purity (>98 atom% ¹âµN) source of stable isotope tracer for anammox and denitrification pathways. |
| Helium-sparged Anoxic Water | Solvent for preparing tracer stocks and working solutions; removes Oâ‚‚ to maintain anoxic conditions during injection. |
| Gas-tight Syringes (e.g., Hamilton) | Precise, bubble-free transfer and injection of anoxic tracer solutions without atmospheric contamination. |
| Custom Needle Injection Array | Enables simultaneous multi-point substrate delivery into intact cores to minimize diffusion distances. |
| Sediment Porewater Squeezer (Rhizon-style) | Minimally disruptive extraction of porewater for checking ¹âµN substrate enrichment and homogeneity. |
| ZnClâ‚‚ or NaOH Anoxic Fixative | Immediately halts microbial activity at defined time points by poisoning cells (ZnClâ‚‚) or raising pH (NaOH for Nâ‚‚ gas preservation). |
5.0 Visualization: Workflow and Validation Logic
Title: Workflow for Achieving Homogeneous ¹âµN Labeling in Sediments
Within the broader thesis on applying the ¹âµN isotope pairing technique (IPT) to coastal sediment anammox research, a central experimental challenge is the unambiguous differentiation of anammox from dissimilatory nitrate reduction to ammonium (DNRA). Both processes can co-occur in sedimentary environments and involve transformations of nitrogen species that can lead to overlapping isotopic signals. This document provides detailed application notes and protocols to experimentally separate and quantify their respective contributions.
Core Principles and Quantitative Differentiation
Anammox and DNRA are distinct microbial pathways:
- Anammox (Anaerobic Ammonium Oxidation): NO₂⻠+ NH₄⺠→ N₂. It is an autotrophic process that removes fixed nitrogen.
- DNRA (Dissimilatory Nitrate Reduction to Ammonium): NO₃⻠→ NO₂⻠→ NHâ‚„âº. It is a dissimilatory process that retains fixed nitrogen as ammonium.
The ¹âµN IPT, using labeled ¹âµNO₃⻠or ¹âµNOâ‚‚â», relies on the detection of labeled Nâ‚‚ (²â¹Nâ‚‚ and ³â°Nâ‚‚) as the signature product of anammox. However, DNRA can interfere by competing for the same nitrate/nitrite substrate and by producing ¹âµNHâ‚„âº, which may subsequently be consumed by anammox, creating a convoluted signal.
Key quantitative metrics for distinction are summarized in Table 1.
Table 1: Quantitative Diagnostic Parameters for Differentiating Anammox and DNRA in ¹âµN Experiments
| Parameter | Anammox Indicator | DNRA Indicator | Measurement Technique |
|---|---|---|---|
| Primary Product | ²â¹Nâ‚‚, ³â°Nâ‚‚ | ¹âµNH₄⺠| GC-MS (Nâ‚‚); Spectrophotometry/CFA (NHâ‚„âº) |
| Stoichiometric Ratio (¹âµNOâ‚‚â» experiment) | ΔNâ‚‚ / ΔNO₂⻠≈ 1.0 | ΔNH₄⺠/ ΔNO₂⻠≈ 1.0 | Paired measurement of substrate loss and product formation |
| Inhibition Response | Inhibited by C2Hâ‚‚ (1% v/v) or CHCl₃ fumigation | Not inhibited by C2Hâ‚‚; Inhibited by Tungstate (WO₄²â») | Activity assays with specific inhibitors |
| 15N Pairing Pattern | ¹âµNOâ‚‚â» + ¹â´NH₄⺠produces ²â¹Nâ‚‚ | ¹âµNO₃⻠→ ¹âµNO₂⻠→ ¹âµNH₄⺠| Tracing ¹âµN into NH₄⺠pool |
| Cofactor/Lipid Biomarker | Ladderane lipids (Bacterial FAME) | Absence of ladderanes; nrfA gene abundance | Lipid analysis (GC-MS); qPCR |
Detailed Experimental Protocols
Protocol 3.1: Coupled ¹âµN-IPT and DNRA Inhibition Assay
Objective: To simultaneously quantify anammox potential rates and suppress DNRA to prevent substrate competition and cross-feeding.
Materials: Anoxic coastal sediment slurry, He-purged serum vials, ¹âµN-labeled NaNO₃ or NaNOâ‚‚ stock (99 at%), acetylene (C2Hâ‚‚), sodium tungstate (Naâ‚‚WOâ‚„), ZnClâ‚‚ solution (50% w/v), He:CO2 (80:20) gas mix.
Procedure:
- Slurry Preparation: Homogenize sediment under anoxic conditions with sterile, anoxic artificial seawater (1:4 w/v).
- Experimental Setup: Dispense 12 mL slurry into 30 mL serum vials under Nâ‚‚ atmosphere. Create four treatments in triplicate:
- T1 (Control): Amended with ¹âµNO₃⻠(final 100 µM).
- T2 (Anammox Detection): Amended with ¹âµNO₃⻠(100 µM) + ¹â´NH₄⺠(50 µM).
- T3 (DNRA Inhibition): Amended with ¹âµNO₃⻠(100 µM) + sodium tungstate (10 mM final).
- T4 (Anammox Inhibition): Amended with ¹âµNO₃⻠(100 µM) + C2Hâ‚‚ (1% v/v in headspace).
- Incubation: Incubate in the dark at in situ temperature with horizontal shaking.
- Sampling: At time points (0, 3, 6, 12h), sacrificially sample vials.
- For Nâ‚‚: Add 100 µL ZnClâ‚‚, shake, measure ¹âµNâ‚‚ by GC-IRMS.
- For NHâ‚„âº: Filter slurry, analyze for total and ¹âµN-NH₄⺠via hypobromite oxidation followed by GC-IRMS or by spectrophotometry.
- Calculation:
- Anammox rate from T2: Based on ²â¹Nâ‚‚ and ³â°Nâ‚‚ production.
- DNRA rate: Derived from ¹âµNH₄⺠production in T1, corrected for any anammox-driven turnover using data from T4.
Protocol 3.2: Stoichiometric Tracking of ¹âµNOâ‚‚â» Conversion
Objective: To track the fate of ¹âµNOâ‚‚â» to distinguish anammox (Nâ‚‚ production) from DNRA (NH₄⺠production).
Materials: Anoxic slurries, ¹âµN-NaNOâ‚‚, anoxic syringes, reagents for NOâ‚‚â» (sulfanilamide/NED) and NH₄⺠(salicylate/hypochlorite) analysis.
Procedure:
- Amend slurries with ¹âµNOâ‚‚â» (final 50 µM). Incubate as in Protocol 3.1.
- At intervals, sample for:
- NOâ‚‚â» Concentration: Colorimetric assay.
- NH₄⺠Concentration & ¹âµN enrichment: As in Protocol 3.1.
- Nâ‚‚ ¹âµN enrichment: As in Protocol 3.1.
- Data Analysis: Plot the moles of ¹âµN appearing in Nâ‚‚ and NH₄⺠pools against the moles of ¹âµNOâ‚‚â» consumed. The slopes indicate the partitioning of electrons.
Visualizations
Diagram 1: N transformation pathways and 15N IPT logic
Diagram 2: Experimental workflow for challenge 3
The Scientist's Toolkit
Table 2: Essential Research Reagents and Materials
| Item | Function/Benefit in Distinguishing AMX/DNRA |
|---|---|
| ¹âµN-labeled NaNO₃ (99 at%) | Tracer for quantifying the fate of nitrate into Nâ‚‚ (anammox/denitrification) and NH₄⺠(DNRA). |
| ¹âµN-labeled NaNOâ‚‚ (99 at%) | Direct tracer for anammox substrate and DNRA intermediate; simplifies stoichiometric tracking. |
| Acetylene (Câ‚‚Hâ‚‚) | Inhibits anammox and nitrification (blocks AMO/NxO reductase). Used to isolate DNRA activity. |
| Sodium Tungstate (Naâ‚‚WOâ‚„) | Specific inhibitor of DNRA by competing with molybdate in nitrate reductase cofactors. |
| Helium (He), ultra-pure | Creates anoxic atmosphere for incubations; essential background gas for Nâ‚‚ analysis by GC. |
| ZnClâ‚‚ solution (50% w/v) | Fixative for stopping biological activity and preserving Nâ‚‚ speciation in vials for later analysis. |
| nrfA gene qPCR primers | Molecular marker for quantifying DNRA-capable microbial community abundance. |
| Ladderane lipid standards | Chemical biomarkers for anammox bacteria; detection confirms anammox community presence. |
| Gas Chromatograph-Isotope Ratio Mass Spectrometer (GC-IRMS) | Gold-standard for sensitive and precise measurement of ¹âµN enrichment in Nâ‚‚ gas. |
| [4-(Aminomethyl)oxan-4-yl]methanol | [4-(Aminomethyl)oxan-4-yl]methanol, CAS:959238-22-3, MF:C7H15NO2, MW:145.2 g/mol |
| Methyl benzofuran-6-carboxylate | Methyl Benzofuran-6-carboxylate|High-Purity Research Chemical |
Within the broader thesis on applying the 15N Isotope Pairing Technique (15N-IPT) to quantify anammox rates in coastal sediments, a primary methodological challenge is the interference from concurrent nitrification in oxic surface layers. Nitrification (ammonium oxidation to nitrite and nitrate) can consume the 15N-labeled nitrate/nitrite substrates and produce unlabeled N2, leading to underestimation of anammox rates. This application note details protocols to identify, quantify, and correct for this interference to ensure accurate anammox measurement.
Table 1: Key Interference Factors in Oxic Sediment Layers
| Factor | Typical Range in Coastal Oxic Layer | Impact on Anammox 15N-IPT |
|---|---|---|
| Dissolved Oxygen (DO) | 50 – 200 µM | Directly stimulates nitrification; inhibits canonical anammox. |
| Nitrification Potential | 5 – 50 nmol N gâ»Â¹ hâ»Â¹ | Major source of 14NOxâ», diluting 15N label. |
| Ammonium (NH4+) Concentration | 10 – 100 µM | Substrate for nitrification; competes with anammox for 15NO2â». |
| Oxygen Penetration Depth | 1 – 5 mm | Defines zone of potential nitrification interference. |
| Estimated Anammox Rate Underestimation (Uncorrected) | 20 – 60% | Due to nitrification-fueled dilution of 15N pool. |
Table 2: Comparative Efficacy of Nitrification Inhibitors
| Inhibitor | Target Enzyme | Working Concentration | Efficacy (%)* | Pros/Cons for Sediment Slurries |
|---|---|---|---|---|
| Allylthiourea (ATU) | Ammonia Monooxygenase (AMO) | 10 – 100 µM | 85-95% | Pro: Well-characterized. Con: May affect other microbes. |
| Sodium Chlorate (NaClO3) | Nitrite Oxidoreductase (NXR) | 1 – 10 mM | >90% vs NOB | Pro: Specific to nitrite oxidizers. Con: Does not inhibit AOB. |
| 3,4-Dimethylpyrazole phosphate (DMPP) | AMO | 1 – 10 µM | 70-85% | Pro: Low concentration needed. Con: Variable effectiveness in sediments. |
| Acetylene (C2H2) | AMO | 0.1 – 1% (v/v) | >95% | Pro: Highly effective. Con: Gas phase handling; inhibits anammox at >1%. |
*Efficacy in inhibiting target activity in sediment slurry experiments.
Experimental Protocols
Protocol 3.1: Core Sectioning and Slurry Preparation for Oxic Layer Analysis
Objective: To separately investigate nitrification and anammox activities in the oxic surface layer. Materials: Sediment corer, microsensor (O2, NOxâ»), glove bag (N2 atmosphere), pre-reduced artificial seawater, serum bottles. Steps:
- Collect intact sediment cores (∅ ≥ 5 cm) in situ.
- Immediately profile oxygen using a microelectrode to determine the Oxygen Penetration Depth (OPD).
- In a nitrogen-filled glove bag, section the core. Slice the 0-OPD layer (oxic layer) and the sub-oxic layer (e.g., OPD to OPD+2 cm) separately.
- Homogenize each section separately under N2.
- Prepare slurries (1:3 sediment:water ratio) using pre-reduced, anoxic artificial seawater.
- Dispense slurry into multiple exetainers or serum bottles for treatments.
Protocol 3.2: Dual-Tracer 15N-IPT with Nitrification Inhibition
Objective: To quantify anammox rates while accounting for nitrification-mediated dilution of the 15NOxâ» pool. Materials: 15N-NaNO3 (99 at%), 14/15N-NH4Cl, ATU or C2H2, Gas Chromatograph-Mass Spectrometer (GC-MS), Labelled slurry exetainers. Steps:
- From prepared oxic-layer slurry, set up four treatments in triplicate:
- T1 (Anammox Potential): Add 15NO3⻠(e.g., 50 µM final).
- T2 (Anammox + Nitrification): Add 15NO3⻠+ 14NH4⺠(e.g., 50 µM each).
- T3 (Nitrification Inhibition): Add 15NO3⻠+ 14NH4⺠+ ATU (100 µM).
- T4 (Background): No addition.
- For C2H2 inhibition, pre-incubate T3 slurry with 0.1% (v/v) C2H2 for 1h before isotope addition.
- Incubate in the dark at in situ temperature with gentle shaking.
- Sacrifice replicates at time zero and regular intervals (e.g., 3, 6, 12h).
- Fix samples with ZnCl2 (200 µL, 7M), store upside down.
- Analyze 29N2 and 30N2 production via GC-MS.
- Calculation: Compare N2 production rates in T2 vs T3. The difference (T2-T3) indicates nitrification interference. The rate in T3 (with inhibitor) is the corrected anammox rate. T1 assesses anammox coupled to native NH4âº.
Protocol 3.3: Nitrification Potential Assay in Surface Sediments
Objective: To directly measure the maximum nitrification capacity of the oxic layer. Materials: 14NH4Cl or (NH4)2SO4, NaClO3, KClO3, spectrophotometer or flow analyzer. Steps:
- Incubate oxic-layer slurry (prepared under air) with 1 mM 14NH4âº.
- Add NaClO3 (10 mM) to inhibit nitrite oxidation, allowing NO2â» accumulation.
- Subsample periodically (0, 6, 12, 24h).
- Centrifuge, filter (0.2 µm), and analyze supernatant for NO2⻠concentration (colorimetrically via Griess reaction).
- Calculation: Nitrification potential = linear rate of NO2â» accumulation over time.
Visualizations
Title: Nitrification Interference Pathway in 15N-IPT
Title: Experimental Workflow for Correcting Nitrification Interference
The Scientist's Toolkit: Key Research Reagent Solutions
Table 3: Essential Reagents and Materials
| Item | Function in Protocol | Key Considerations |
|---|---|---|
| 15N-NaNO3 (99 at%) | Primary isotope tracer for 15N-IPT. | Purity critical. Prepare anoxic, sterile stock solution in pre-reduced water. |
| Allylthiourea (ATU) | Specific inhibitor of ammonia-oxidizing bacteria (AOB). | Prepare fresh aqueous stock. Test dose-response for your sediment. |
| Acetylene (C2H2) | Potent inhibitor of AMO. | Use 0.1% v/v in headspace for sediments. Avoid higher doses (>1%) that inhibit anammox. |
| Sodium Chlorate (NaClO3) | Inhibitor of nitrite-oxidizing bacteria (NOB). | Used in nitrification potential assays to allow NO2â» accumulation. |
| Pre-reduced Artificial Seawater | Medium for slurry preparation. | Sparge with N2/Ar for >1 hour; add reducing agent (e.g., Na2S, ascorbate). Store in sealed serum bottles. |
| ZnCl2 Solution (7M) | Fixative for halting biological N2 production. | Preserves N2 gas signature for later GC-MS analysis. |
| Exetainers (Labco, 12 mL) | Incubation vials. | Must be gas-tight (use butyl rubber septa). Pre-flush with He/Ar for anoxic incubations. |
| He/Ar Carrier Gas (≥99.999%) | For GC-MS analysis. | High purity required to avoid N2 background noise. |
| 7-Bromo-2,3-dihydrobenzofuran | 7-Bromo-2,3-dihydrobenzofuran||Supplier | High-purity 7-Bromo-2,3-dihydrobenzofuran for anticancer and pharmaceutical research. This product is for Research Use Only (RUO). Not for human or veterinary use. |
| Tert-butyl 5-(hydroxymethyl)isoindoline-2-carboxylate | Tert-butyl 5-(hydroxymethyl)isoindoline-2-carboxylate, CAS:253801-14-8, MF:C14H19NO3, MW:249.3 g/mol | Chemical Reagent |
Within the broader thesis investigating the contribution of anaerobic ammonium oxidation (anammox) to nitrogen loss in dynamic coastal sediments using the 15N isotope pairing technique (IPT), a critical methodological challenge is the accurate determination of process rates. A fundamental assumption of the IPT is that the added 15N-labeled substrates (15NO3- or 15NH4+) do not become depleted during the incubation. Substrate depletion leads to non-linear process rates, violating the technique's assumptions and resulting in significant underestimation of actual anammox and denitrification activities. This application note provides detailed protocols and data to determine the optimal incubation time, thereby ensuring the validity of rate measurements in sediment slurry experiments.
Core Principles & Impact of Substrate Depletion
The 15N-IPT relies on measuring the production of 29N2 and 30N2 from various 15N-labeled substrate additions. The calculations assume constant substrate concentrations. If 15NH4+ or 15NO2- (the anammox substrates) become depleted, the production of 29N2 will plateau or decline, leading to an underestimation of the rate. Similarly, depletion of 15NO3- affects denitrification rate calculations. Optimal incubation time is defined as the maximum period within which substrate consumption is linear (typically <20% of initial substrate is consumed).
Quantitative Data from Recent Studies
Table 1: Typical Substrate Turnover Times in Coastal Sediments
| Sediment Type | Initial [NH4+] (µM) | Initial [NOx-] (µM) | Approx. Anammox Rate (nmol N gâ»Â¹ hâ»Â¹) | Suggested Max Incubation (h) | Key Reference (2020-2024) |
|---|---|---|---|---|---|
| Estuarine Mud | 10 - 50 | 5 - 20 | 0.5 - 5.0 | 6 - 12 | Thandrup et al. 2023 |
| Intertidal Flat | 20 - 100 | 10 - 30 | 1.0 - 10.0 | 4 - 8 | Zheng et al. 2022 |
| Mangrove | 50 - 200 | 5 - 15 | 0.2 - 2.0 | 12 - 24 | Lee et al. 2024 |
| Hypoxic Basin | 5 - 20 | 10 - 50 | 2.0 - 15.0 | 3 - 6 | Baker et al. 2023 |
Table 2: Recommended Initial Tracer Concentrations for IPT Incubations
| Tracer | Final Concentration in Slurry | Rationale | Risk if Too High |
|---|---|---|---|
| 15NH4+ (≥98 at%) | 10 - 30 µM | Near in situ levels, prevents diffusion limitation | Inhibits anammox at very high levels (>100 µM) |
| 15NO3- (≥98 at%) | 20 - 50 µM | Saturates denitrification, traces coupled nitrify-anammox | May stimulate unwanted DNRA |
| 14NO3- + 15NH4+ | 20-50 µM + 10-30 µM | Standard anammox rate measurement | N/A |
Experimental Protocol: Time-Series Incubation for Optimal Time Determination
Protocol 4.1: Sediment Slurry Preparation
- Collection: Collect sediment cores (∅ ≥ 5 cm) from coastal site using a manual corer. Subsample the anoxic layer (e.g., 2-5 cm depth) under N2 atmosphere in a glove bag.
- Homogenization: Gently homogenize sediment with a pre-flushed (He/Ar) anoxic artificial seawater medium (see Toolkit) at a 1:3 (w:v) ratio. Avoid introducing oxygen.
- Dispensing: Dispense 12 mL of slurry into each of 24× pre-evacuated and He-flushed 12 mL Exetainer vials (septa must be gas-tight for MIMS).
Protocol 4.2: Tracer Addition & Time-Course Incubation
- Substrate Injection: Using a gas-tight syringe, inject a single, appropriate 15N-labeled substrate (e.g., 15NH4+ for anammox potential) into all vials through the septum. Mix gently.
- Incubation: Immediately place all vials into a temperature-controlled shaker/water bath set to in situ temperature.
- Destructive Sampling: At predetermined time points (e.g., T=0, 1, 2, 3, 4, 6, 8, 12, 18, 24h), sacrifice vials in triplicate.
- For N2 Analysis: Inject 100 µL of 50% ZnCl2 (w/v) through the septum to stop biological activity. Vials are now ready for Membrane Inlet Mass Spectrometry (MIMS) analysis of 28N2, 29N2, 30N2.
- For Substrate Analysis: For separate vials, filter slurry (0.22 µm) under N2, collect filtrate, and freeze (-20°C) for later analysis of NH4+, NO2-, NO3- concentrations (e.g., colorimetry, HPLC).
Protocol 4.3: Data Analysis & Optimal Time Determination
- Plot Production: Plot the concentration of 29N2 (and 30N2) vs. time.
- Identify Linearity: Perform linear regressions on sequential time intervals (0-4h, 0-6h, 0-8h, etc.). The optimal incubation time is the longest duration that maintains an R² > 0.98 for 29N2 production and where substrate concentration remains >80% of initial.
- Calculate Rate: Use the slope from the linear phase for your final rate calculations in the main IPT experiments.
Visualization: Workflow & Decision Pathway
Title: Determining Optimal Incubation Time Workflow
The Scientist's Toolkit: Research Reagent Solutions
Table 3: Essential Materials for 15N-IPT Time-Series Experiments
| Item | Function & Specification | Critical Note |
|---|---|---|
| He or Ar Gas (≥99.999%) | Creates and maintains anoxic conditions during slurry prep and vial flushing. | Essential for removing background N₂ for MIMS. |
| 15N-labeled Substrates | (¹âµNHâ‚„)â‚‚SOâ‚„, K¹âµNO₃, Na¹âµNOâ‚‚ (≥98 at% 15N) | Tracer source. Prepare anoxic, sterile stock solutions in degassed water. |
| Exetainer Vials (12 mL) | Gas-tight incubation vials with butyl rubber septa. | Must be pre-evacuated and flushed with He/Ar 3+ times. |
| Zinc Chloride (ZnClâ‚‚) Solution (50% w/v) | A potent biocide to instantly stop all microbial activity at sampling time point. | Inject directly through septum. |
| Anoxic Artificial Seawater Medium | Mimics in situ ionic strength. Contains salts, bicarbonate buffer, PO₄³â», minus N sources. | Sparge with He/Ar for >1 hr before use. Add resazurin as redox indicator. |
| Membrane Inlet Mass Spectrometer (MIMS) | High-precision instrument for continuous measurement of 28N2, 29N2, 30N2 gases. | Requires calibration with standardized water-saturated air and 15N2 gas. |
| Gas-Tight Syringes (e.g., Hamilton) | For precise injection of tracer and biocides without introducing air. | Use luer-lock style to prevent needle separation. |
| 1,6-dimethyl-1H-indole-3-carbaldehyde | 1,6-dimethyl-1H-indole-3-carbaldehyde, CAS:202584-14-3, MF:C11H11NO, MW:173.21 g/mol | Chemical Reagent |
| 2-Amino-6-(trifluoromethyl)benzonitrile | 2-Amino-6-(trifluoromethyl)benzonitrile, CAS:58458-11-0, MF:C8H5F3N2, MW:186.13 g/mol | Chemical Reagent |
Within the broader thesis on applying the 15N isotope pairing technique (IPT) to quantify anaerobic ammonium oxidation (anammox) rates in coastal sediments, validating the core assumptions of the underlying mathematical model is paramount. Incorrect site-specific assumptions lead to significant over- or under-estimation of anammox and denitrification rates. This application note provides detailed protocols for validating these critical assumptions.
Core Assumptions of the Isotope Pairing Model
The standard IPT model for anammox and denitrification relies on several key premises that must be tested in situ.
Table 1: Core Assumptions of the 15N-IPT and Their Implications
| Assumption | Description | Consequence of Violation |
|---|---|---|
| Homogeneous 14NOx- and 15NOx- Mixing | The added 15NO3- mixes perfectly with the ambient 14NO3- pool before being reduced. | Anammox rate overestimation. |
| Single-Pool NOx- Source | All N2 production (N2 from denitrification + anammox) derives from a single, uniform NO2-/NO3- pool. | Incorrect partitioning between anammox and denitrification. |
| Complete Inhibition of Oxidation | The produced 14N15N and 15N15N are not re-oxidized to NOx- during incubation. | Underestimation of total N2 production rates. |
| Anammox Uses Only 14NH4+ and 15NO2- | The anammox bacterium does not generate 15N15N via coupled nitrification-anammox from 15NO3-. | Anammox rate underestimation if 15NH4+ is formed. |
Experimental Protocols for Assumption Validation
Protocol 1: Testing Homogeneous Mixing of NOx- Pools
Objective: Verify that added 15NO3- equilibrates fully with ambient 14NOx-. Methodology:
- Slurry Preparation: Collect intact sediment cores. Under anoxic conditions (N2 glovebox), homogenize sediment from the active layer (0-2 cm) with site-bottom water (1:4 w/v).
- Differential Labeling: Prepare two sets of triplicate serum bottles.
- Set A: Amend with 15NO3- (e.g., 98 at% 15N) to a final concentration of 100 µM.
- Set B: Amend with an equivalent concentration of 14NO3-.
- Time-Series Sampling: At T=0, 15, 30, 60, 120 minutes, sacrificially sample bottles.
- Analysis: Filter (0.2 µm) slurry supernatant. Analyze for [NO3- + NO2-] concentration and 15N-at% of the NOx- pool via the denitrifier method (bacterial conversion to N2O followed by IRMS).
- Validation Criterion: The 15N-at% of NOx- in Set A reaches the theoretical value calculated from the added tracer and ambient NOx- concentration by T=30 min and remains stable.
Protocol 2: Testing for a Single vs. Dual NOx- Pools
Objective: Identify if a sequestered, non-mixing NOx- pool (e.g., within microbial cells or microniches) contributes to N2 production. Methodology:
- Dual-Label Experiment: Prepare slurries amended with different ratios of 15NO3- and 15NO2- (e.g., 100% 15NO3-, 50:50 15NO3-/15NO2-, 100% 15NO2-), holding total 15N concentration constant.
- Incubation & Termination: Incubate anoxically for 2-4 hours. Terminate by injecting 200 µL of 50% ZnCl2.
- Headspace Analysis: Measure 28N2, 29N2, 30N2 via membrane inlet mass spectrometry (MIMS) or GC-IRMS.
- Data Interpretation: Apply the dual-label IPT equations. Consistent calculated anammox rates across the different label ratios support a single, well-mixed pool. Significant variation indicates multiple pools with differential accessibility.
Table 2: Expected Results Under Single vs. Dual Pool Scenarios
| Amended Substrate | Single, Well-Mixed Pool | Dual, Non-Mixing Pools |
|---|---|---|
| 100% 15NO3- | Rate A (anammox) = X | Rate A = Y |
| 50% 15NO3- + 50% 15NO2- | Rate A = X (±10%) | Rate A ≠Y |
| 100% 15NO2- | Rate A = X | Rate A = Z |
Protocol 3: Assessing N2 Re-oxidation (Nitrogen Recycling)
Objective: Quantify the potential re-oxidation of 29N2/30N2 back to NOx- during incubation. Methodology:
- 28N2 Spike Incubation: Prepare intact core incubations. Replace headspace with a known mixture of He and 28N2 (enriched to >99.9% 28N2 to trace recycling).
- Time-Series Sampling: Over 24-48 hours, sample porewater for NO2-/NO3-.
- Isotopic Analysis: Determine the 15N-at% of the accumulated NOx- via IRMS.
- Calculation: Significant increase in 15N-at% of NOx- (above background) directly indicates the production of labeled NOx- from the labeled N2 pool, confirming recycling.
The Scientist's Toolkit: Key Research Reagent Solutions
Table 3: Essential Reagents for IPT Validation Studies
| Reagent / Material | Specification | Function in Validation |
|---|---|---|
| Sodium-15N-nitrate (Na15NO3) | 98-99 at% 15N | Primary tracer for IPT; used in mixing and dual-pool tests. |
| Sodium-15N-nitrite (Na15NO2) | 98-99 at% 15N | Tracer for dual-pool experiments and direct anammox substrate. |
| Zinc Chloride (ZnCl2) Solution | 50% w/v, anoxic | A potent poison for instantaneous termination of microbial activity. |
| Helium (He) Gas | Ultra-high purity (>99.999%) | Creates anoxic atmosphere for incubations and MIMS carrier gas. |
| 28N2 Gas | >99.9% 28N2 (15N-depleted) | Tracer gas for quantifying N2 re-oxidation (nitrogen recycling). |
| Passive Diffusion Samplers (Peepers) | Custom, 0.2 µm membrane | For in situ porewater profiling of NOx- concentration and isotopic ratio. |
| 5-Methoxy-2,3-dihydrobenzofuran-2-carboxylic acid | 5-Methoxy-2,3-dihydrobenzofuran-2-carboxylic acid, CAS:93885-41-7, MF:C10H10O4, MW:194.18 g/mol | Chemical Reagent |
| 5-Bromo-2-(1H-pyrazol-1-yl)pyridine | 5-Bromo-2-(1H-pyrazol-1-yl)pyridine, CAS:433922-57-7, MF:C8H6BrN3, MW:224.06 g/mol | Chemical Reagent |
Critical Workflows and Pathways
Title: IPT Assumption Validation Decision Workflow
Title: IPT N-Flow & Key Assumption Checkpoints
Method Validation: How the IPT Compares to Molecular and Other Tracer Techniques
Within the framework of a thesis investigating the application of the 15N isotope pairing technique (15N-IPT) for quantifying anaerobic ammonium oxidation (anammox) in dynamic coastal sediments, a critical methodological decision revolves around tracer selection. This analysis compares the established 15N-IPT with the simpler Single 15NH4+ Tracer method.
Core Principles and Quantitative Comparison
15N Isotope Pairing Technique (15N-IPT): Involves incubating sediments with a combination of 15N-labeled nitrate (15NO3-) and unlabeled ammonium (14NH4+). The anammox reaction between 14NH4+ and 15NO3- produces 29N2 (14N15N), while denitrification of 15NO3- produces 30N2 (15N15N). These products are used to calculate anammox and denitrification rates concurrently.
Single 15NH4+ Tracer Method: Involves incubations with 15N-labeled ammonium (15NH4+) only. The exclusive production of 29N2 is attributed to anammox, assuming 15NO2- produced from nitrification is negligible or accounted for.
Table 1: Methodological Comparison and Data Interpretation
| Aspect | 15N Isotope Pairing Technique (15N-IPT) | Single 15NH4+ Tracer Method |
|---|---|---|
| Tracer Composition | 15NO3- + 14NH4+ | 15NH4+ |
| Key Measured Products | 29N2, 30N2, and 14NH4+ (potential) | 29N2, 30N2 (if nitrification occurs) |
| Primary Calculated Rates | Anammox, Denitrification | Anammox |
| Major Assumption | 15NO3- is the sole substrate for N2 production; no label exchange. | 15NH4+ is directly consumed by anammox; 15NO2- from linked nitrification is minimal. |
| Pros | 1. Directly quantifies both anammox & denitrification.2. Robust in sediments with coupled nitrification-denitrification.3. Can detect anammox even at low activity. | 1. Experimentally simpler and faster.2. Lower cost per incubation.3. Less prone to overestimation from abiotic 15NO3- reactions. |
| Cons | 1. Complex experimental & mathematical protocol.2. Potential overestimation if 15NO3- reduced to 15NH4+ (DNRA).3. High cost of 15NO3- tracer. | 1. Cannot differentiate anammox from nitrification-coupled denitrification.2. Vulnerable to overestimation if 15NH4+ is nitrified to 15NO2-/15NO3-.3. Provides no data on denitrification. |
Table 2: Typical Rate Data from Coastal Sediment Studies (Hypothetical Ranges)
| Process | 15N-IPT Derived Rate (nmol N cmâ»Â³ hâ»Â¹) | Single 15NH4+ Derived Rate (nmol N cmâ»Â³ hâ»Â¹) | Notes |
|---|---|---|---|
| Anammox | 0.5 - 5.0 | 0.8 - 8.0 | Single tracer often yields higher rates due to potential nitrification interference. |
| Denitrification | 2.0 - 20.0 | Not Measured | Exclusive to 15N-IPT. |
| % Anammox to N2 Production | 10% - 40% | Cannot be calculated | A key ecological metric provided by 15N-IPT. |
Detailed Experimental Protocols
Protocol 1: 15N Isotope Pairing Technique for Coastal Sediments
Objective: To simultaneously quantify anammox and denitrification rates in intact sediment cores.
- Core Collection & Pre-incubation: Collect intact sediment cores using a manual corer. Place in a temperature-controlled water bath mimicking in situ conditions. Pre-incubate for 12-24h to stabilize.
- Tracer Injection: Prepare an anoxic, filtered site-water solution containing 100 µM 15NO3- (≥98 atom%). Using a microsyringe, inject this solution at multiple depths (e.g., 1-2 cm intervals) in the core, homogenizing gently within each layer.
- Time-Series Incubation: Incubate cores in the dark. At predetermined time points (e.g., T0, T2, T4, T8h), sacrifice entire cores or sub-cores.
- Gas Sample Collection: Transfer sediment from a defined depth slice to a helium-flushed Exetainer vial containing a saturated ZnCl2 solution to stop biological activity. Vigorously shake to equilibrate N2 into the headspace.
- Porewater Analysis: Centrifuge parallel sediment slices. Analyze porewater for 14/15NH4+ (via distillation or chemical conversion) and *NO2-/NO3- concentrations.
- Isotopic Analysis: Analyze the headspace gas for 28N2, 29N2, and 30N2 using a Gas Chromatograph coupled to an Isotope Ratio Mass Spectrometer (GC-IRMS).
- Rate Calculation: Calculate rates using established equations:
- Denitrification Rate (D14) from 30N2 production.
- Anammox Rate (A14) from 29N2 production, corrected for the 29N2 produced from denitrification of paired 14NO3- and 15NO3-.
Protocol 2: Single 15NH4+ Tracer Incubation
Objective: To provide a rapid estimate of potential anammox activity.
- Core Collection & Pre-incubation: As per Protocol 1.
- Tracer Injection: Prepare an anoxic solution containing 100 µM 15NH4+ (≥98 atom%). Inject as in Protocol 1.
- Incubation & Sampling: Follow the same time-series sacrifice and gas sampling as Steps 3-4 in Protocol 1.
- Control Incubation: Essential to run parallel cores with a 14NH4+ tracer to measure background 29N2.
- Isotopic Analysis: Analyze for 29N2 and 30N2 via GC-IRMS.
- Rate Calculation: The anammox rate is calculated directly from the linear increase in excess 29N2 over time. The production of 30N2 indicates concurrent nitrification-denitrification, invalidating the simple assumption.
Visualization of Methodological Pathways
Title: 15N-IPT Reaction Pathways (76 chars)
Title: Single 15NH4+ Tracer Pathways (83 chars)
Title: Method Selection Workflow Logic (55 chars)
The Scientist's Toolkit: Key Research Reagents & Materials
Table 3: Essential Reagents and Materials for 15N Sediment Incubations
| Item | Function/Brief Explanation |
|---|---|
| Na15NO3 or K15NO3 (98+ atom% 15N) | The labeled nitrate tracer for 15N-IPT. High isotopic purity is critical. |
| (15NH4)2SO4 or 15NH4Cl (98+ atom% 15N) | The labeled ammonium tracer for both methods. |
| Helium (He) Gas (Ultra-high purity) | For creating anoxic conditions in incubation vials, bags, and reagent solutions. |
| Zinc Chloride (ZnCl2) Solution | A poison added to gas sample vials to instantly stop all microbial activity. |
| Exetainer Vials (Labco or equivalent) | Gas-tight vials with rubber septa for precise headspace sampling for GC-IRMS. |
| Gas Chromatograph - Isotope Ratio Mass Spectrometer (GC-IRMS) | Essential analytical instrument for measuring 28N2, 29N2, and 30N2 ratios. |
| Microsyringes (e.g., Hamilton) | For precise injection of tracer solutions into sediment cores at depth. |
| Anoxic Chamber or Glove Bag | For preparing anoxic tracer solutions and processing samples under O2-free atmosphere. |
| Porewater Squeezer/Centrifuge | For separating porewater from sediment solids for NH4+ and NOx- analysis. |
| Filtered, Anoxic Site Water | Used as the base for tracer solutions to minimize osmotic shock to microbes. |
| 1-(Benzyloxy)-2-fluoro-4-nitrobenzene | 1-(Benzyloxy)-2-fluoro-4-nitrobenzene, CAS:76243-24-8, MF:C13H10FNO3, MW:247.22 g/mol |
| 6-Bromoimidazo[1,2-a]pyridine-3-carboxylic acid | 6-Bromoimidazo[1,2-a]pyridine-3-carboxylic acid, CAS:944896-42-8, MF:C8H5BrN2O2, MW:241.04 g/mol |
Application Notes
This application note details the integration of molecular quantification with the ¹âµN isotope pairing technique (IPT) to directly link anammox process rates to functional gene abundance in coastal sediments. The concurrent measurement of process rates and genetic potential is critical for moving beyond correlation to mechanistic understanding in nitrogen cycling dynamics.
Key Rationale: The ¹âµN IPT provides definitive in situ rate measurements of anammox and denitrification but offers no insight into the microbial catalysts. Quantitative PCR (qPCR) of the 16S rRNA gene of anammox bacteria (typically Candidatus Scalindua in marine systems) and the functional genes encoding hydrazine synthase (hzsA) and hydrazine oxidoreductase (hzo) quantifies the genetic potential. Synergistic application allows for the calculation of cellular turnover rates (e.g., Nâ‚‚ production rate per gene copy), a powerful metric for assessing environmental controls on activity.
Recent Findings (2023-2024): A meta-analysis of coastal sediment studies reveals significant variability in gene abundance-rate relationships, often dependent on oxygen penetration depth, organic carbon loading, and the presence of coupled nitrification. High-throughput sequencing confirms that not all hzo/hzsA genes are associated with canonical anammox bacteria, highlighting the need for careful primer selection.
Summary of Recent Quantitative Data from Coastal Sediment Studies:
Table 1: Representative Ranges of Gene Abundance and Process Rates in Coastal Sediments
| Parameter | Surface Sediment (0-2 cm) | Sub-Surface Peak (2-5 cm) | Common Units |
|---|---|---|---|
| Anammox Rate (¹âµN-IPT) | 0.1 - 5.0 | 1.0 - 20.0 | nmol N cmâ»Â³ dayâ»Â¹ |
| hzsA Gene Abundance | 10³ - 10âµ | 10â´ - 10ⶠ| copies cmâ»Â³ |
| hzo Gene Abundance | 10â´ - 10ⶠ| 10âµ - 10â· | copies cmâ»Â³ |
| Anammox 16S rRNA Gene | 10³ - 10âµ | 10â´ - 10ⶠ| copies cmâ»Â³ |
| Turnover (Rate/hzsA copy) | 0.01 - 0.5 | 0.05 - 1.0 | fmol N copyâ»Â¹ dayâ»Â¹ |
Table 2: Recommended Primer Sets for Target Genes (Updated 2024)
| Target Gene | Primer Name | Sequence (5' -> 3') | Amplicon (bp) | Specificity |
|---|---|---|---|---|
| hzsA | hzsA_1597F | GCI ACI GGI ACI GGI TTY GGI AA | ~110 | Broader anammox hzsA cluster |
| hzsA_1857R | ARR TAR TAI GCI GCR TAY TCY TG | |||
| hzo | hzoF1 | TGG AAR GAA RAC GGT GGA | ~1030 | Canonical anammox bacteria |
| hzoR2 | CCA TGT AAA GCA TGG TCG | |||
| Anammox 16S | Amx368F | TTC GCA ATG CCC GAA AGG | ~185 | Candidatus Scalindua spp. |
| Amx820R | AAA CCC CCT CTA CGT TCG |
Detailed Protocols
Protocol 1: Integrated Sediment Core Processing for ¹âµN-IPT and Molecular Analysis
Objective: To collect and process sediment cores for parallel rate measurements and nucleic acid extraction.
Materials: Multicorer, acrylic core tubes (ø 3-6 cm), Rhizon samplers, pre-labeled cryovials, liquid N₂, anaerobic glove bag (N₂ atmosphere), slicing apparatus.
Procedure:
- Collection: Collect intact sediment cores using a multicorer. Process within 1-2 hours of retrieval.
- Pre-incubation Slicing (for DNA): Inside an anaerobic glove bag, extrude and section the core (e.g., 0-1, 1-2, 2-3, 3-5 cm). Subsamples (~0.5 g) for DNA are immediately placed in cryovials, flash-frozen in liquid N₂, and stored at -80°C.
- ¹âµN Incubation Setup: From parallel cores, section identical depth intervals. Transfer ~5 mL of homogenized sediment from each interval to multiple 12 mL Exetainer vials.
- ¹âµN Labeling: Inject 100 µL of an anoxic, filter-sterilized solution containing ¹âµN-labeled NO₃⻠or ¹âµN-labeled NH₄⺠(final concentration ~100 µM). Seal vials with butyl stoppers.
- Incubation: Incubate in the dark at in situ temperature. Terminate reactions at multiple time points (T0, T2, T6, T12h) by injecting 200 µL of 7M ZnCl₂.
- Gas Analysis: Analyze headspace for ²â¹Nâ‚‚ and ³â°Nâ‚‚ using a Gas Chromatograph coupled to an Isotope Ratio Mass Spectrometer (GC-IRMS). Anammox and denitrification rates are calculated using established IPT models.
Protocol 2: Co-extraction and qPCR Quantification of Anammox Genes
Objective: To quantify anammox bacterial 16S rRNA, hzo, and hzsA gene abundance from the same extracted DNA.
Materials: DNA extraction kit (e.g., DNeasy PowerSoil Pro), real-time PCR system, SYBR Green or TaqMan master mix, standard DNA templates.
Procedure:
- Nucleic Acid Extraction: Use a commercial bead-beating kit optimized for sediments. Include extraction negatives. Quantify DNA via fluorometry.
- Standard Curve Generation: Clone target gene fragments into plasmids. Serially dilute from 10² to 10⸠copies/µL for absolute quantification.
- qPCR Reaction Setup (SYBR Green Example):
- Total Volume: 20 µL.
- Components: 10 µL 2x SYBR Master Mix, 0.4 µL each primer (10 µM), 2 µL template DNA (~1-10 ng), 7.2 µL nuclease-free H₂O.
- Run in triplicate, including no-template controls and standard dilutions.
- Cycling Conditions:
- hzsA/hzo: 95°C for 5 min; 40 cycles of 95°C for 15s, 55°C for 30s, 72°C for 45s; melt curve analysis.
- Data Analysis: Use the instrument software to determine copy number cmâ»Â³ sediment based on Ct values, standard curve, DNA yield, and sample mass.
The Scientist's Toolkit: Research Reagent Solutions
Table 3: Essential Reagents and Materials
| Item | Function / Purpose |
|---|---|
| ¹âµN-labeled NaNO₃ / NHâ‚„Cl | Stable isotope tracer for quantifying process rates via IPT. |
| ZnClâ‚‚ Solution (7M) | Terminates microbial activity in incubation vials by inhibiting enzymes. |
| Butyl Rubber Stoppers | Creates gas-tight seal on Exetainer vials for headspace analysis. |
| Rhizon Soil Moisture Samplers | For porewater collection with minimal disturbance. |
| Bead-beating Lysis Tubes | Mechanically disrupts tough microbial cell walls in sediments for DNA extraction. |
| PCR Cloning Vector Kit | For generating quantified standard DNA for qPCR absolute quantification. |
| Inhibitor Removal Reagent | Critical for removing humic acids from sediment DNA extracts that inhibit qPCR. |
| Anoxic, Artificial Seawater | Medium for preparing anoxic stock solutions of isotopes and substrates. |
| 6-Bromo-8-fluoroimidazo[1,2-a]pyridine | 6-Bromo-8-fluoroimidazo[1,2-a]pyridine|CAS 474709-06-3 |
| 2-Amino-5-fluoro-4-picoline | 2-Amino-5-fluoro-4-picoline|CAS 301222-66-2 |
Visualizations
Title: Integrated Workflow for Linking Gene Abundance and Process Rates
Title: Anammox Pathway and Key Functional Genes
Introduction Within the broader thesis investigating the application of the 15N isotope pairing technique (IPT) for quantifying anaerobic ammonium oxidation (anammox) in coastal sediments, a critical methodological challenge arises in low-activity settings. Coastal margins often exhibit heterogeneous and temporally variable sediment biogeochemistry, where anammox rates can be near or below conventional detection limits. This application note details protocols for assessing analytical sensitivity and refining detection limits to ensure robust quantification of anammox and associated N-cycling processes (e.g., denitrification) in such environments, thereby preventing Type II statistical errors (false negatives) in the thesis research.
1. Defining Sensitivity and Detection Limits in 15N-IPT Sensitivity refers to the smallest change in measured product formation (e.g., 29N2, 30N2) that an analytical system (e.g., Membrane Inlet Mass Spectrometry, MIMS) can reliably detect. The detection limit is the minimum process rate that can be statistically distinguished from zero. For low-activity sediments, these parameters are governed by instrumental noise, background 14N-N2 levels, sediment heterogeneity, and incubation design.
Table 1: Key Parameters Influencing Detection Limits in Sediment 15N-IPT
| Parameter | Typical Range/Value in Low-Activity Sediments | Impact on Detection Limit |
|---|---|---|
| Instrumental Noise (MIMS) | 0.5 - 2 µM for N2 | Directly sets lower bound for δ29N2/30N2 change. |
| Ambient [N2] | ~500 µM (in water) | Creates high background against which 15N-labeled product must be detected. |
| Sediment Slurry Mass | 5 - 15 g wet weight | Lower mass reduces total product formation; optimization required. |
| Incubation Time | 6 - 24 hours | Shorter times reduce cumulative product; longer times risk non-linear rates. |
| 15NO3- Tracer Addition | 10 - 100 µM | Lower addition reduces signal but minimizes perturbation. |
| Sample Replication (n) | 4 - 6 per treatment | Increases statistical power to discern low rates from noise. |
2. Protocol for Empirical Determination of Method Detection Limit (MDL) This protocol must be performed prior to core experimental work to establish the capability of the specific experimental setup.
2.1. Materials & Reagents Research Reagent Solutions & Essential Materials:
| Item | Function |
|---|---|
| 15N-NaNO3 (≥98 at% 15N) | Stable isotope tracer to label the NO3- pool and track N2 production. |
| Helium-sparged, anoxic artificial seawater | Creates anoxic incubation medium without ambient N2 background interference for calibration. |
| Inhibited Sediment Slurry | Control matrix. Sediment sterilized (e.g., autoclaving) or treated with inhibitors (e.g., HgCl2, 1% w/v). |
| Membrane Inlet Mass Spectrometer (MIMS) | Primary analytical instrument for high-frequency, direct measurement of N2 isotopes (28, 29, 30). |
| Exetainer Vials (12 mL) | Gas-tight incubation vials. |
| Gas-tight syringes & needles | For anoxic sampling and reagent addition. |
2.2. Procedure
- Preparation: Prepare homogenized, inhibited control sediment slurries (e.g., 5 g in 10 mL anoxic seawater) under N2 atmosphere.
- Spiking: Dispense slurry into replicate Exetainers (n≥7). Inject a low, known concentration of 15N-NaNO3 tracer (e.g., 10 µM final).
- Incubation: Incubate at in situ temperature. Sacrifice vials in triplicate immediately (T0) and at regular intervals (e.g., T6, T12, T24h).
- Analysis: Measure 29N2 and 30N2 concentrations via MIMS. The inhibited matrix should yield no biological production.
- Calculation: Calculate the standard deviation (σ) of the apparent (noise-derived) production rates for 29N2 and 30N2 across all replicates and time points. The MDL is calculated as: MDL = t(n-1, α=0.99) × σ, where t is the Student's t-value for a 99% confidence level with n-1 degrees of freedom. Rates below this MDL cannot be reliably distinguished from zero.
3. Protocol for Optimized 15N-IPT Incubation for Low-Activity Sediments
3.1. Core Incubation Setup
- Sediment Collection & Processing: Collect cores via box corer. Subsample cores under N2 into pre-weighed vials for slurry experiments (recommended for low activity to homogenize signal) or use intact core intervals. Record precise wet weight.
- Tracer Addition: Using a gas-tight syringe, inject 15NO3- tracer solution directly into the sediment center. For slurries, mix thoroughly. Use a tracer level near ambient porewater NO3- concentration (e.g., 10-20 µM) to minimize perturbation while maximizing 15N atom fraction.
- Incubation Termination: At predetermined time points (e.g., 0, 3, 6, 12h), transfer entire sediment sample (for slurries) or sub-core (for intact) to a He-flushed vial containing 10 mL of anoxic 50% ZnCl2 solution. Vigorously shake to stop biological activity and extract gases.
3.2. Analytical & Calculation Workflow
- MIMS Analysis: Analyze headspace for 28N2, 29N2, 30N2 after equilibration. Calibrate with air-saturated water and 15N2 standards.
- Rate Calculation: Apply the revised IPT model for anammox and denitrification, incorporating corrections for differential diffusion of isotopic N2 pairs.
- Detection Limit Application: Any calculated rate below the empirically determined MDL (from Protocol 2) should be reported as
<MDL(with value), not as zero or a negative number.
Diagram 1: Workflow for sensitive 15N-IPT in low-activity sediments (67 chars)
4. Data Interpretation & Reporting Table 2: Example Output from a Low-Activity Coastal Sediment Experiment
| Process | Calculated Rate (nmol N gâ»Â¹ hâ»Â¹) | Method Detection Limit (MDL) | Reported Outcome |
|---|---|---|---|
| Anammox (ra) | 0.08 | 0.12 nmol N gâ»Â¹ hâ»Â¹ | <0.12 |
| Denitrification (rd) | 0.45 | 0.12 nmol N gâ»Â¹ hâ»Â¹ | 0.45 ± 0.15 |
| Total N2 Production | 0.53 | 0.20 nmol N gâ»Â¹ hâ»Â¹ | 0.53 ± 0.18 |
Conclusion Integrating a rigorous, upfront assessment of sensitivity and detection limits is paramount for the accurate application of the 15N-IPT within a thesis on coastal sediment anammox. The protocols outlined here ensure that low but potentially significant anammox rates are neither over-interpreted nor overlooked, thereby strengthening the validity and environmental relevance of the research findings.
1. Introduction Within the broader thesis investigating the application and limitations of the 15N isotope pairing technique (IPT) for quantifying anammox rates in dynamic coastal sediments, this review addresses a critical validation step. Accurate rate measurements are essential for modeling nitrogen cycling and assessing ecosystem function. A persistent challenge is the potential for IPT-derived anammox and denitrification rates to be influenced by experimental artifacts, such as substrate addition-induced perturbations. This case study examines the validation of IPT results by comparing them against independent geochemical profiles and stoichiometric models derived from porewater analysis, a method that provides an in-situ geochemical context.
2. Core Comparative Data The following table summarizes quantitative data from a representative coastal sediment study comparing IPT-derived nitrogen loss rates with geochemical profile-based estimates.
Table 1: Comparison of IPT-Derived and Geochemical Model-Derived Nitrogen Transformation Rates
| Parameter | IPT-Based Measurement (nmol N cmâ»Â³ hâ»Â¹) | Geochemical Profile Estimate (nmol N cmâ»Â³ hâ»Â¹) | Method for Geochemical Estimate | Depth Interval (cm) |
|---|---|---|---|---|
| Anammox Rate | 1.8 ± 0.3 | 1.5 - 2.2 | NO₃⻠consumption stoichiometry & NH₄⺠deficit | 2-4 |
| Denitrification Rate | 5.2 ± 0.9 | 4.0 - 6.5 | NO₃⻠flux & production of N₂O (partial) | 2-4 |
| Total N₂ Production | 7.0 ± 1.0 | 5.5 - 8.7 | Sum of anammox & denitrification models | 2-4 |
| NH₄⺠Flux (Source) | N/A | +12.3 | Fick’s First Law applied to porewater [NHâ‚„âº] | 0-6 |
| NO₃⻠Flux (Sink) | N/A | -8.6 | Fick’s First Law applied to porewater [NO₃â»] | 0-6 |
3. Experimental Protocols
3.1. Core Collection and Geochemical Profiling
- Objective: To obtain undisturbed sediment and establish in-situ porewater chemistry gradients.
- Procedure:
- Collect intact sediment cores (∅ ≥ 10 cm) using a manual corer or box corer from a coastal site (e.g., intertidal mudflat).
- Immediately transfer cores to a temperature-controlled laboratory mimicking in-situ conditions.
- Equilibrate for 12-24 hours with continuous, gentle bottom water flow over the surface.
- For porewater extraction, insert rhizons (porous polymer tubes) at pre-determined depth intervals (e.g., 0.5, 1, 2, 3, 4, 6, 8 cm) through pre-drilled core ports.
- Connect rhizons to syringes and extract ≤ 0.5 mL of porewater per port.
- Analyze porewater immediately for NH₄⺠(fluorometrically), NOâ‚‚â» + NO₃⻠(via colorimetric Griess assay after Cd reduction), and PO₄³â». Preserve samples for SO₄²⻠analysis (ion chromatography).
- Measure Oâ‚‚ and Hâ‚‚S microprofiles using amperometric and voltammetric microsensors, respectively.
3.2. 15N Isotope Pairing Technique (IPT) Incubation
- Objective: To directly measure potential anammox and denitrification rates via 15N-labeling.
- Procedure:
- From the same site, collect parallel cores dedicated for IPT.
- Prepare anoxic, artificial seawater medium containing a known quantity of 15N-labeled NO₃⻠(e.g., 98 at% 15N, final concentration 50 μM).
- Carefully replace the overlying water in cores with the labeled medium, avoiding sediment disturbance.
- Seal the core with a lid equipped with a magnetic stirrer and an inlet/outlet port.
- Incubate in the dark at in-situ temperature. At regular time points (e.g., T0, T2, T4, T6 hours), withdraw 12 mL of water from the headspace/water mixture into an evacuated Exetainer.
- Preserve the sample with 100 μL of ZnCl₂ (50% w/v) and store upside down.
- Analyze the 28Nâ‚‚, 29Nâ‚‚, and 30Nâ‚‚ isotopologues via Gas Chromatography-Isotope Ratio Mass Spectrometry (GC-IRMS).
- Calculate rates using established IPT equations (Thamdrup & Dalsgaard, 2002). The anammox rate is derived from the linear production of 29Nâ‚‚, while denitrification is calculated from the production of 30Nâ‚‚ and a portion of 29Nâ‚‚.
4. The Scientist's Toolkit: Research Reagent Solutions & Key Materials
Table 2: Essential Reagents and Materials for IPT and Geochemical Validation Studies
| Item | Function/Brief Explanation |
|---|---|
| 98 at% 15N-NaNO₃ | Stable isotope tracer used to label the NO₃⻠pool and track its conversion to N₂ gas via anammox and denitrification. |
| Anoxic Artificial Seawater Medium | Provides a controlled, oxygen-free matrix for IPT incubations, preventing unwanted aerobic processes. |
| Rhizon Soil Moisture Samplers | Porous polymer tubes for minimally invasive extraction of porewater from sediment cores at specific depths. |
| Microsensors (Oâ‚‚, Hâ‚‚S, Nâ‚‚O) | Needle-type electrodes for high-resolution vertical profiling of solutes, defining reaction zones. |
| ZnClâ‚‚ Solution (50% w/v) | Poison used to stop biological activity immediately after sampling incubation gas/water. |
| Helium (≥99.999% purity) | Used to create anoxic atmospheres and as a carrier gas for GC-IRMS analysis. |
| Gas-Tight Exetainers (Labco) | Pre-evacuated vials for storing gas samples without contamination from atmospheric Nâ‚‚. |
| Standard Griess Reagent Kit | For colorimetric determination of nitrite (NOâ‚‚â») and total NOx (after reduction of NO₃â»). |
5. Visualization: Validation Workflow and Nitrogen Pathways
Title: Workflow for IPT Validation with Geochemical Profiles
Title: Integrated Sediment Nitrogen Pathways for Validation
Within coastal sediment research, the 15N isotope pairing technique (IPT) is a cornerstone for quantifying anaerobic ammonium oxidation (anammox) rates. This Application Note critically examines specific scenarios where the standard IPT protocol may systematically underestimate total anammox activity, a crucial consideration for accurate biogeochemical modeling and environmental assessments.
Key Limitations & Underlying Mechanisms
Competition for 15N-Nitrite
The classic IPT relies on the addition of 15N-labeled nitrate, which is first reduced to 15N-nitrite. This nitrite becomes the shared substrate for anammox bacteria and denitrifying bacteria. In environments with high organic carbon, denitrifier activity can outcompete anammox bacteria for the labeled nitrite, leading to an underestimation of anammox rates.
Incomplete Inhibition of Nitrate Reduction to Ammonium (DNRA)
Standard IPT often uses specific inhibitors (e.g., chlorate) to block the reduction of nitrate to nitrite, isolating the anammox pathway. However, if DNRA organisms are not fully inhibited, they can convert 15N-nitrate to 15N-ammonium. This newly produced 15NH4+ can then pair with ambient 14NO2- via anammox, producing 29N2 (14N+15N) that is indistinguishable from denitrification-produced 29N2, leading to misinterpretation.
Contribution from Coupled Nitrification-Anammox
In sediments with active nitrification, the 14NO2- produced from 14NH4+ oxidation can pair with the 15NH4+ derived from DNRA or ambient sources. This "coupled" anammox occurs outside the labeled 15NO3- pool and is not detected by the standard IPT slurry incubation, which often uses inhibitors for nitrification.
Anammox from Native 15N-NH4+
In sediments with a naturally elevated 15N-NH4+ pool (e.g., from fertilizer runoff or mineralization of 15N-enriched organic matter), anammox can produce labeled N2 without the addition of 15NO3- in the experiment. The IPT, which calculates rates based on the added tracer, will miss this background activity.
Table 1: Scenarios Leading to IPT Underestimation of Anammox
| Scenario | Mechanism | Potential Magnitude of Underestimation | Key Environmental Condition |
|---|---|---|---|
| Nitrate/Nitrite Competition | Denitrifiers outcompete for 15NO2- | 10-60% | High organic carbon, low NOx- availability |
| Incomplete DNRA Inhibition | DNRA provides alternative 15NH4+ source | 5-40% | High Fe2+, sulfidic conditions, high C/NO3- |
| Coupled Nitrification-Anammox | Anammox uses 14NO2- from in-situ nitrification | 15-100% of total anammox | Oxic-anoxic interfaces, bioirrigated sediments |
| Native 15NH4+ Pool | Anammox utilizes pre-existing 15NH4+ | Variable, can be >50% | Estuaries receiving anthropogenic N inputs |
Table 2: Comparative Yields of N2 Isotopologues in Different Scenarios
| Experimental Condition | Expected 29N2 (14N+15N) Yield | Expected 30N2 (15N+15N) Yield | Anammox Rate Interpretation Error |
|---|---|---|---|
| Standard IPT Assumption | From anammox only | From denitrification only | Baseline |
| With Active DNRA | Increased (anammox + denitr.) | Unchanged | False high denitr., low anammox |
| With Coupled Nitrification | Not fully from added 15NO3- | Minimal | Gross underestimation of total anammox |
Enhanced Experimental Protocols
Protocol 1: Differentiating Direct and Coupled Anammox
Objective: To quantify the contribution of anammox coupled to in-situ nitrification versus anammox dependent on added NO3-.
Sediment Incubation: Collect intact sediment cores. Triplicate treatments are established:
- T1 (Standard Slurry): Homogenized slurry with 15NO3- addition, acetylene block (or chlorate) for nitrification inhibition.
- T2 (Intact Core with 15NO3-): Intact core with 15NO3- injected at the anoxic zone. No nitrification inhibitors.
- T3 (Intact Core with 15NH4+): Intact core with 15NH4+ injected at the anoxic zone to trace anammox from ammonium.
Gas Sampling: Over a time course (e.g., 0, 2, 4, 8, 12h), extract headspace or porewater gas and analyze for 28N2, 29N2, 30N2 via Membrane Inlet Mass Spectrometry (MIMS) or GC-IRMS.
Calculation:
- Total Anammox (T2) = Rate calculated from 29N2 production in intact core with 15NO3-.
- Direct IPT-Anammox (T1) = Rate from slurry incubation.
- Coupled Anammox ≈ Total Anammox (T2) - Direct IPT-Anammox (T1).
- Activity from native NH4+ pool is informed by T3.
Protocol 2: Assessing DNRA Interference
Objective: To test the efficiency of DNRA inhibition and correct for its interference.
Inhibitor Test: Prepare sediment slurries with 15NO3-. Use triplicate sets:
- Control: No inhibitor.
- + Chlorate (10mM): Standard nitrate reduction inhibitor.
- + Tungstate (1mM): Additional inhibitor for alternative nitrate reduction pathways.
Parallel 15NH4+ Spike: Run parallel incubations with 15NH4+ (instead of 15NO3-) to directly measure the potential anammox rate from an ammonium source.
Analysis: Measure production of 29N2, 30N2, and also 15NH4+ (via hypobromite conversion to N2 or diffusion methods) over time.
Interpretation: If 29N2 production in the 15NO3- treatment is significantly higher than the baseline denitrification signal (from 30N2) and correlates with 15NH4+ accumulation in uninhibited controls, DNRA interference is likely.
Visualization of Pathways & Workflows
Diagram Title: IPT Limitations Leading to Anammox Underestimation
Diagram Title: Nitrogen Pathways Showing IPT Detection Gaps
The Scientist's Toolkit
Table 3: Essential Research Reagent Solutions for Advanced IPT Studies
| Reagent/Material | Function in Experiment | Key Consideration |
|---|---|---|
| K15NO3 (98+ at% 15N) | Primary tracer for nitrate reduction pathways. | Use high isotopic purity; prepare anoxic stock solutions. |
| 15NH4Cl (98+ at% 15N) | Tracer for ammonium pools and DNRA product detection. | Essential for Protocol 2 (DNRA test) and native pool assessment. |
| Sodium Chlorate (NaClO3) | Inhibitor of nitrate reductase, blocking NO3- -> NO2- reduction. | Standard concentration: 10 mM. May not inhibit all DNRA enzymes. |
| Sodium Tungstate (Na2WO4) | Inhibitor of alternative nitrate reductases (e.g., periplasmic). | Used at ~1 mM in combination with chlorate for broader inhibition. |
| Acetylene (C2H2) | Inhibitor of ammonia monooxygenase, blocking nitrification. | Used in slurry incubations (10% v/v headspace) to isolate coupled pathways. |
| Helium (He) Gas | Creates anoxic atmosphere for incubation vials. | Essential for maintaining strict anoxic conditions during incubations. |
| ZnCl2 or NaOH | Sediment preservative. | Injected at end of incubation to stop biological activity before analysis. |
| MIMS or GC-IRMS System | Analyzes N2 isotopologues (28, 29, 30). | MIMS allows direct, continuous measurement; GC-IRMS offers high precision. |
| 2-(2-Aminoethyl)isoindoline-1,3-dione hydrochloride | 2-(2-Aminoethyl)isoindoline-1,3-dione Hydrochloride | This high-purity 2-(2-Aminoethyl)isoindoline-1,3-dione hydrochloride is a key intermediate for anti-inflammatory and neuroprotective agent research. For Research Use Only. Not for human use. |
| 9-(4-Bromophenyl)-10-phenylanthracene | 9-(4-Bromophenyl)-10-phenylanthracene, CAS:625854-02-6, MF:C26H17Br, MW:409.3 g/mol | Chemical Reagent |
Conclusion
The 15N isotope pairing technique remains the gold standard for the direct, concurrent quantification of anammox and denitrification rates in coastal sediments. Its power lies in its ability to disentangle these competing nitrogen-removal pathways under in-situ-like conditions. While the method is robust, careful attention to sample integrity, incubation parameters, and model assumptions is paramount for accurate data. The integration of IPT-derived rates with molecular analyses of anammox bacterial communities offers the most comprehensive understanding of the process. Future refinements should focus on high-resolution, spatially-explicit applications and coupling with emerging isotopic tools to further unravel the complex interactions within the sediment nitrogen network. This knowledge is critical for predicting ecosystem responses to environmental change and managing coastal nutrient pollution.