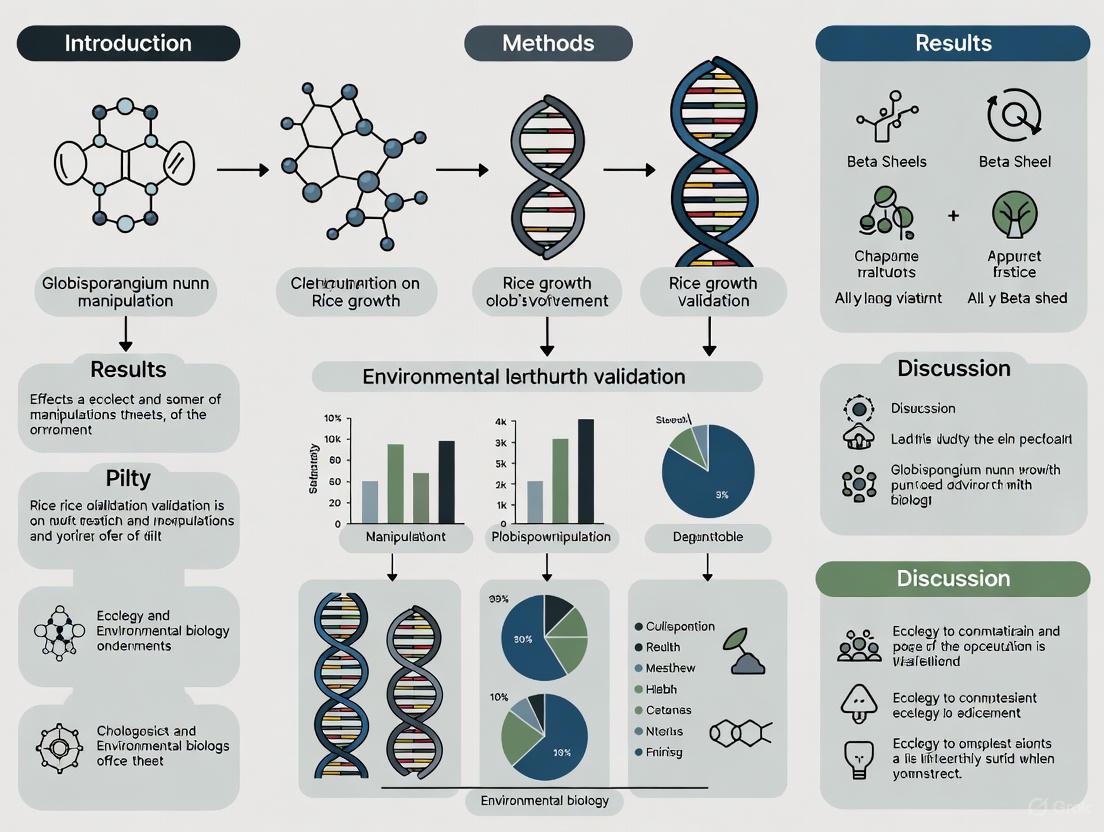
Validating Globisporangium nunn Effects on Rice Growth: An Ecological Network Approach
Sustainable food production requires harnessing ecological interactions in agriculture.
Validating Globisporangium nunn Effects on Rice Growth: An Ecological Network Approach
Abstract
Sustainable food production requires harnessing ecological interactions in agriculture. This study validates a framework to detect influential organisms for crop growth, focusing on the oomycete Globisporangium nunn. We integrated intensive field monitoring of rice growth and ecological communities via quantitative environmental DNA metabarcoding with nonlinear time series analysis. This method identified 52 potentially influential organisms from over 1,000 detected species. A field manipulation experiment confirmed that the addition of Globisporangium nunn significantly altered rice growth rates and gene expression patterns. Our proof-of-concept provides a methodological pipeline for identifying previously overlooked biotic factors affecting crop performance, offering a new avenue for sustainable agricultural management by leveraging ecological complexity.
The Ecological Complexity of Rice Fields: Uncovering Hidden Influencers on Crop Performance
The Challenge of Sustainable Rice Production and Environmental Impacts
Global rice production constitutes a fundamental component of food security for over 3.5 billion people worldwide, yet it simultaneously presents significant environmental challenges [1] [2]. As a major driver of greenhouse gas emissions and other environmental loads, conventional rice cultivation methods create a critical paradox: how to maintain productivity while reducing ecological harm [1] [3]. This challenge has spurred research into innovative approaches that move beyond traditional agricultural interventions, exploring instead how ecological interactions within rice paddies can be harnessed for sustainable production [4] [2].
Within this context, a groundbreaking study demonstrated an ecological-network-based approach to identify previously overlooked organisms influencing rice growth [1] [4] [2]. The research identified 52 potentially influential organisms through intensive monitoring and nonlinear time series analysis, with the oomycete Globisporangium nunn emerging as a particularly significant organism [4] [2]. This review comprehensively compares this novel ecological manipulation approach against broader agricultural strategies, examining their relative efficacies, methodological requirements, and potential contributions to sustainable rice production.
Comparative Analysis of Sustainable Rice Production Approaches
Ecological Network-Based Detection and Manipulation
Theoretical Foundation: This approach recognizes that rice is grown under field conditions where it is inevitably influenced by surrounding ecological community members [1] [2]. Traditional agricultural research has underexplored how these complex ecological communities influence rice performance despite their potential to establish environment-friendly agricultural systems [4] [2]. The methodology builds on ecological principles that biotic variables such as microbial mutualists and pathogens play important roles in determining transcriptome dynamics and crop productivity, though their complex, nonlinear dynamics make them challenging to study [2] [3].
Experimental Framework: The research employed a multi-year experimental design beginning with intensive monitoring in 2017 followed by validation in 2019 [1] [2]. In the initial phase, researchers established small experimental rice plots and monitored both rice growth and ecological communities extensively for 122 consecutive days [1]. Ecological monitoring employed quantitative environmental DNA (eDNA) metabarcoding with four universal primer sets (16S rRNA, 18S rRNA, ITS, and COI regions) targeting prokaryotes, eukaryotes, fungi, and animals respectively [2]. This approach detected more than 1,000 species in the rice plots, including both microbes and macrobes [4] [2].
Table 1: Key Experimental Parameters for Ecological Network Approach
| Parameter | 2017 Monitoring Phase | 2019 Validation Phase |
|---|---|---|
| Duration | 122 days (23 May - 22 September 2017) | Not specified |
| Rice Variety | Hinohikari | Hinohikari |
| Monitoring Frequency | Daily | Not specified |
| Organisms Detected | 1,197 species | Focus on 2 target species |
| Analysis Method | Nonlinear time series analysis | Manipulative experiments |
| Key Metrics | Rice growth rate, ecological community dynamics | Rice growth rate, gene expression patterns |
Validation through Manipulation: Based on the 2017 analysis, researchers identified 52 potentially influential organisms [4] [2]. In 2019, they selected two species for manipulative experiments: Globisporangium nunn (an oomycete) and Chironomus kiiensis (a midge species) [4] [2]. The team established artificial rice plots where they manipulated the abundance of these species - adding G. nunn and removing C. kiiensis - then measured rice growth rates and gene expression patterns before and after manipulation [4]. The results confirmed that G. nunn especially produced statistically clear effects on rice performance, changing both growth rate and gene expression patterns [4] [2].
Alternative Sustainable Rice Production Methods
Genetic Conservation and Breeding Approaches: The International Rice Research Institute (IRRI) has emphasized genetic conservation and breeding as a key sustainability strategy [5]. Their International Rice Genebank preserves 132,000 rice seed samples, both wild and cultivated varieties, which are distributed globally to researchers, breeders, and farmers for developing varieties with improved yield, quality, nutritional content, and climate resilience [5]. In 2023, a US$2M grant from Google.org enabled the application of artificial intelligence for rapid identification of rice varieties, accelerating the evaluation of traits such as drought, flood, and salinity tolerance [5].
Large-Scale Agroecological Management: In Vietnam, a large-scale initiative promotes "Sustainable Development of One Million Hectares of High-Quality and Low-Emission Rice Associated with Green Growth in the Mekong River Delta by 2030" [5]. This approach bundles climate-smart farming practices including alternate wetting and drying (AWD), precision mechanized direct seeding combined with fertilizer deep placement, sustainable straw management, and digital advisory tools [5]. Pilot sites across five provinces demonstrated reductions of up to 30% in fertilizer use, 40% water savings, and income increases exceeding VND5M per hectare [5].
AI-Informed Seasonal Management Strategies: Recent research applying artificial intelligence to 50 years of rice cultivation data from IRRI's Long-Term Continuous Cropping Experiment (LTCCE) revealed that season-tailored breeding and more frequent varietal changes can sustain productivity [6]. Key findings showed that better nitrogen fertilizer use, rapid varietal replacement, and solar radiation consistently lifted yields, though results varied by season [6]. The analysis identified that dry season crops thrived in cooler reproductive-stage temperatures, while early wet season crops benefited from warmer conditions that boosted soil nitrogen mineralisation [6].
Table 2: Comparison of Sustainable Rice Production Approaches
| Approach | Key Features | Measured Outcomes | Limitations |
|---|---|---|---|
| Ecological Network Manipulation | eDNA monitoring, nonlinear time series analysis, species-specific manipulation | Changes in rice growth rate and gene expression patterns | Relatively small effect sizes; artificial system conditions |
| Genetic Conservation & Breeding | Seed preservation (132,000 accessions), AI-assisted trait identification, global distribution | Development of climate-resilient varieties with improved yield and stress tolerance | Long development timeline; complex trait integration |
| Large-Scale Agroecological Management | Alternate wetting and drying, precision direct seeding, fertilizer deep placement, digital tools | 30% less fertilizer, 40% water savings, increased farmer income | Requires significant infrastructure and farmer training |
| AI-Informed Seasonal Management | Machine learning analysis of long-term data, season-specific variety recommendations | Improved nitrogen responsiveness, reduced disease risks | Dependent on extensive historical data collection |
Methodological Protocols for Ecological Network Analysis
Experimental Setup and Monitoring Protocols
Rice Plot Establishment: Researchers established five artificial rice plots using small plastic containers (90 × 90 × 34.5 cm; 216 L total volume) in an experimental field at the Center for Ecological Research, Kyoto University, in Otsu, Japan [1]. Each plot contained sixteen Wagner pots filled with commercial soil, with three rice seedlings (var. Hinohikari) planted in each pot on 23 May 2017 and harvested on 22 September 2017 (122 days) [1]. The containers were filled with well water and maintained without pesticide application throughout the monitoring period [1].
Rice Growth Measurement: Daily rice growth was monitored by measuring rice leaf height of target individuals every day using a ruler, specifically measuring the largest leaf heights [1]. Growth rates were calculated as cm/day in height [2]. The daily growth rate reached its maximum during late June to early July, and rice height stopped increasing after the middle of August, with first headings appearing on 12 or 13 August in the five plots [2]. During the monitoring period, occasional decreases in rice heights due to mechanical damage or insect herbivores were observed, but these were deemed unlikely to significantly affect causal inferences due to their smaller magnitude and frequency compared to growth-related changes [2].
Environmental DNA Analysis: Water samples (approximately 200 ml) were collected daily from each of the five rice plots and filtered using two types of Sterivex filter cartridges (φ 0.22-µm and φ 0.45-µm) [1]. This resulted in 1220 water samples (122 days × 2 filter types × 5 plots) plus negative control samples [1]. eDNA was extracted from filters and purified, followed by quantitative eDNA metabarcoding analysis [1]. The quantitative aspect was achieved through sequencing with internal spike-in DNAs, which enabled more informative community data [2].
Data Analysis and Causal Inference
Time Series Analysis: The research employed nonlinear time series analytical tools to reconstruct complex interaction networks [2] [3]. These methods can detect and quantify biological interactions in complex systems by identifying causality between variables [2]. The analysis of the time series data containing 1,197 species and rice growth rates produced a list of 52 potentially influential species using a time-series-based causality analysis [2] [3]. This approach helped overcome issues of confounding factors under field conditions that often lead to spurious correlations [7].
Diagram 1: Experimental workflow for detecting and validating influential organisms, showing progression from field monitoring to manipulative validation.
The Researcher's Toolkit: Essential Reagents and Materials
Table 3: Key Research Reagent Solutions for Ecological Network Analysis
| Reagent/Material | Specification | Experimental Function |
|---|---|---|
| Sterivex Filter Cartridges | φ 0.22-µm and φ 0.45-µm pore sizes | Environmental DNA capture from water samples |
| Universal Primer Sets | 16S rRNA, 18S rRNA, ITS, and COI regions | Comprehensive amplification of prokaryotes, eukaryotes, fungi, and animals |
| Internal Spike-in DNAs | Quantified reference DNA sequences | Enable quantitative eDNA metabarcoding by normalizing sequencing data |
| CMA-PARP Medium | Corn meal agar with pimaricin, ampicillin, rifampicin, PCNB | Semi-selective isolation of oomycetes from environmental samples |
| Wagner Pots | Standardized container size (90 × 90 × 34.5 cm) | Maintain consistent experimental growing conditions across replicates |
| Methyl 4-Formylbenzoate | Methyl 4-Formylbenzoate, CAS:1571-08-0, MF:C9H8O3, MW:164.16 g/mol | Chemical Reagent |
| 2-Amino-5-bromo-4-methylpyridine | 2-Amino-5-bromo-4-methylpyridine, CAS:98198-48-2, MF:C6H7BrN2, MW:187.04 g/mol | Chemical Reagent |
Mechanistic Insights: From Ecological Interaction to Rice Growth Response
Proposed Signaling Pathways: The manipulative experiments demonstrated that addition of Globisporangium nunn to rice plots resulted in changes to both rice growth rates and gene expression patterns [4] [2]. While the exact molecular mechanisms remain to be fully elucidated, the observed transcriptome changes suggest that this oomycete influences rice physiological states through modulation of gene expression [2]. Previous research has shown that ecological community members can influence rice performance through various mechanisms, including modification of habitat structures through foraging behavior and excrement, which can subsequently change the abundance of other key species and even ecosystem functions [7].
Ecological Network Effects: The study framework operates on the principle that ecological communities in paddy fields comprise complex interaction networks where species influence each other through direct and indirect pathways [2] [7]. The identification of 52 potentially influential organisms suggests that rice growth is not determined by isolated factors but rather emerges from network-level interactions [4] [2]. This aligns with ecological theory recognizing that less abundant species can disproportionately affect community diversity and function through strong interspecific interactions - the so-called "keystone" species concept [2] [3].
Diagram 2: Proposed signaling pathway of organism manipulation effects on rice growth, showing potential mechanistic routes from intervention to growth response.
The ecological network approach for detecting and validating influential organisms represents a paradigm shift in sustainable rice production research, moving beyond conventional agricultural interventions to harness ecological complexity [4] [2]. While the effects of manipulating individual species like Globisporangium nunn were relatively small, the research framework itself offers significant future potential for utilizing ecological interactions in agriculture [4]. This proof-of-concept study provides an important basis for further development of field-based system management that acknowledges the intricate web of species interactions influencing crop performance [4] [2].
When compared to alternative approaches like genetic conservation, large-scale agroecological management, and AI-informed seasonal strategies, the ecological network method offers unique advantages in identifying previously overlooked biological factors affecting rice growth [4] [5] [6]. Each approach presents distinct strengths, and an integrated strategy combining ecological insights with genetic improvement, management optimization, and climate adaptation will likely prove most effective for addressing the dual challenge of sustainable rice production and environmental impact reduction.
The methodological rigor of intensive eDNA monitoring coupled with nonlinear time series analysis provides a powerful template for future research seeking to understand complex agricultural ecosystems [1] [2]. As these approaches mature, they may ultimately contribute to agricultural systems that work with, rather than against, ecological principles to achieve sustainable food production for a growing global population.
For decades, traditional plant breeding has driven significant genetic gains in rice production, primarily through the development of improved varieties with higher yield potential and stress resistance. However, this approach has largely overlooked the complex ecological context in which crops grow. While modern breeding techniques like genomic selection and high-throughput phenotyping have accelerated genetic gains—estimated at averages of 36.3 kg/ha/year across global rice breeding programs—a critical component has remained underexplored: the influence of field biotic communities on rice performance. This review examines the limitations of traditional breeding approaches in accounting for complex ecological interactions and presents emerging methodologies that harness environmental DNA (eDNA) metabarcoding and nonlinear time series analysis to detect influential organisms. Focusing specifically on validation research involving Globisporangium nunn manipulation, we demonstrate how integrating ecological community monitoring can complement traditional breeding to achieve more sustainable agricultural productivity.
Traditional rice breeding has achieved remarkable success over the past century, with public breeding programs such as the Louisiana State University (LSU) program documenting an average increase of 4.55 kg/ha per generation across 110 years of breeding cycles [8]. More recently, from 1994 to 2018, genetic gains for grain yield reached approximately 56.54 kg/ha per year through conventional breeding approaches [8]. These improvements have primarily been driven by methodologies focusing on intrinsic plant characteristics and abiotic factors, with breeding programs strategically allocating resources to balance cost-effectiveness and genetic improvement [8].
However, this traditional paradigm possesses significant limitations. Rice is typically grown under field conditions where it is inevitably influenced by surrounding ecological community members, yet how these biotic variables influence rice performance has been largely underexplored despite its importance for sustainable agriculture [3] [9]. The dynamics of biotic variables under field conditions are difficult to predict because they often show more complex, nonlinear dynamics than abiotic variables [3] [9]. While advanced breeding techniques combined with technologies such as high-throughput field-based phenotyping represent promising approaches to improve crop performance [3] [9], they traditionally focus on plant genetics and physiological responses to abiotic stressors, overlooking the intricate ecological networks surrounding crops.
Table 1: Estimated Genetic Gains in Rice Breeding Programs Worldwide
| Program/Region | Time Period | Genetic Gain (kg/ha/year) | Percentage Gain (%/year) | Primary Focus |
|---|---|---|---|---|
| Global average (29 studies) | 1999-2023 | 36.3 | 0.1-3.0% | Yield improvement [10] |
| LSU Rice Breeding Program | 110 years | 4.55 per generation | - | Long-term genetic improvement [8] |
| LSU Rice Breeding Program | 1994-2018 | 56.54 | - | Modern genetic gains [8] |
| Southern Brazil | 1972-2016 | 37.91 | 0.62% | Irrigated rice [10] |
| India | 2005-2014 | 34.0 | 0.68% | Irrigated control [10] |
| IRRI Drought Program | 1980-2015 | 10.22 | 0.23% | Non-stress conditions [10] |
| China | 1991-2017 | ~80.0 | ~1.0% | General improvement [11] |
The limitations of traditional observation- and manipulation-based approaches in ecology have been recognized for decades. Despite substantial contributions to ecology, these approaches have critical limitations: the identification of multitaxa species and the quantification of their abundance under field conditions are challenging, and the quantification of their interactions is even more difficult [3] [9]. This gap is particularly problematic given that paddy fields host incredibly diverse ecological communities—more than 5,000 species have been recorded in paddy fields in Japan alone [7]. Understanding how these ecological community members influence rice performance under field conditions will provide crucial insights into how we can improve rice performance and how rice responds to ongoing and future anthropogenic impacts [3] [9].
The Methodological Revolution: eDNA Metabarcoding and Ecological Network Analysis
Environmental DNA Metabarcoding
A promising approach for overcoming the limitations of traditional breeding and ecological assessment involves frequent monitoring of agricultural systems and detecting interspecific interactions using time series data. Recent advances in empirical and statistical methods provide a practical way to achieve this goal. Environmental DNA (eDNA) enables researchers to efficiently detect ecological community members under field conditions [3] [9]. eDNA metabarcoding, an approach to comprehensively amplify and sequence DNAs belonging to target taxa in environmental samples, represents a cost- and time-effective means to detect a large number of species [3] [9].
The eDNA-based community data is especially informative when obtained quantitatively through sequencing with internal spike-in DNAs [3] [9]. For example, quantitative eDNA metabarcoding has enabled effective evaluation of intraspecific genetic diversity and frequent, comprehensive monitoring of community dynamics [3]. In rice paddy studies, this approach has successfully detected more than 1,000 species (including microbes and macrobes such as insects) in experimental rice plots [3] [9], dramatically surpassing the scope of traditional ecological assessment methods.
Nonlinear Time Series Analysis
Complementing eDNA metabarcoding, nonlinear time series analytical tools enable researchers to reconstruct complex interaction networks and detect causality among many variables [3] [9]. These methods have detected and quantified biological interactions in complex systems such as microbiomes and have contributed to understanding and forecasting complex dynamics driven by these interactions [3] [9].
In practice, researchers establish small experimental rice plots and monitor rice performance (e.g., growth rates) and ecological community dynamics intensively and extensively. Rice performance is quantified by measuring growth rates (cm/day), while ecological community members are monitored via quantitative eDNA metabarcoding [3] [9]. The resulting extensive time series data containing thousands of species and rice growth rates can be analyzed to produce lists of potentially influential species using time-series-based causality analysis [3] [9].
Figure 1: Experimental workflow for detecting and validating influential organisms in rice fields using eDNA metabarcoding and ecological network analysis
Research Reagent Solutions for Ecological Monitoring in Agricultural Systems
Table 2: Essential Research Reagents and Materials for eDNA-Based Ecological Monitoring
| Reagent/Material | Function | Application Example |
|---|---|---|
| Sterivex filter cartridges (φ 0.22-µm and φ 0.45-µm) | Capture DNA fragments from water samples | Filtration of approximately 200 ml of water collected from rice plots [1] |
| Universal primer sets (16S rRNA, 18S rRNA, ITS, COI) | Amplify taxonomic marker genes from diverse organisms | Detection of prokaryotes, eukaryotes, fungi, and animals respectively in eDNA samples [9] |
| Internal spike-in DNAs | Enable quantitative eDNA analysis | Precise quantification of species abundance in ecological communities [3] [9] |
| High-throughput sequencing platforms | Generate comprehensive DNA sequence data | Simultaneous processing of hundreds of environmental samples [3] |
| Wagner pots (90 × 90 × 34.5 cm) | Standardized experimental rice plots | Containment for controlled rice growth studies with commercial soil [1] |
Case Study: Validating Globisporangium nunn Effects on Rice Growth
Detection through Ecological Network Analysis
In a comprehensive study conducted in 2017, researchers established five artificial rice plots in Japan and monitored rice growth and ecological community dynamics daily for 122 consecutive days [3] [9]. Through quantitative eDNA metabarcoding of water samples, they detected more than 1,000 species in the rice plots [3] [9]. Nonlinear time series analysis of the resulting data identified 52 potentially influential organisms with lower-level taxonomic information, including an Oomycetes species, Globisporangium nunn (syn. Pythium nunn), which was flagged as a potentially influential organism for rice growth [3] [9].
This analytical approach represented a significant advancement over traditional methods, as it could detect potentially causal relationships between specific organisms and rice growth performance within complex ecological communities where direct observation would be impractical or impossible [7]. The time series-based causality analysis required quantitative time series, for which the quantitative eDNA data proved particularly suitable [9].
Experimental Validation of G. nunn Effects
In 2019, researchers empirically tested the effects of two species identified as potentially influential in the 2017 study through manipulative experiments [3] [9]. During the growing season, G. nunn was added to small artificial rice plots, and the responses of rice—including growth rate and gene expression patterns—were measured before and after the manipulation [3] [9].
The results confirmed that G. nunn indeed had statistically clear effects on rice performance [3] [9]. Specifically, in the G. nunn-added treatment, rice growth rate and gene expression patterns were significantly changed [3] [9]. Although the effects of the manipulations were relatively small, this validation demonstrated that the integration of eDNA-based monitoring and time series analysis could effectively detect previously overlooked influential organisms in agricultural systems [3] [9].
Table 3: Comparative Analysis of Traditional vs. Ecological Network Approaches
| Aspect | Traditional Breeding Approach | Ecological Network Approach |
|---|---|---|
| Primary focus | Intrinsic plant genetics, yield components, abiotic stress tolerance | Interspecific interactions, ecological community dynamics |
| Scope of consideration | Limited number of pest and pathogen species | Comprehensive community monitoring (1000+ species simultaneously) |
| Methodology | Pedigree selection, phenotypic evaluation, molecular markers | eDNA metabarcoding, nonlinear time series analysis, causal inference |
| Key advantages | Proven track record, predictable outcomes, established protocols | Holistic understanding, discovery of novel interactions, ecological context |
| Limitations | Oversimplifies ecological complexity, misses important biotic interactions | Computationally intensive, requires specialized expertise, emerging methodology |
| Validation approach | Multi-location trials, yield testing | Targeted manipulative experiments, gene expression analysis |
Discussion: Integrating Ecological Understanding into Breeding Paradigms
The research framework presented in the G. nunn validation study provides a proof-of-concept for how agricultural science might harness ecological complexity and utilize it to improve crop production [3] [9]. While the effects observed in the manipulative experiments were relatively small, the approach demonstrates future potential for developing more sustainable agricultural systems that work with, rather than against, ecological communities [3] [9].
Traditional breeding programs have increasingly adopted modern selection tools such as genomic selection (GS) and high-throughput phenotyping (HTP), with simulation results showing that integrating these tools can yield the highest response to selection (4.68% per year) due to synergistic effects [8]. However, even these advanced approaches would benefit from incorporating ecological community monitoring to account for the complex biotic environments in which crops grow.
The implications of this research extend beyond rice agriculture. The general framework of intensive monitoring combined with time series analysis could be applied to various agricultural systems to identify key organisms influencing crop growth [3] [9]. This approach aligns with growing recognition in agriculture that soil-borne microbial communities, including oomycetes like Globisporangium species, play crucial roles in plant health and productivity [12]. Future breeding strategies may increasingly need to consider these complex ecological interactions to develop varieties that not only possess superior genetics but also interact favorably with their ecological contexts.
Traditional breeding approaches have undeniably contributed to substantial improvements in rice productivity over the past century, with documented genetic gains across numerous global breeding programs. However, their limitation in accounting for complex ecological interactions represents a significant blind spot in crop improvement strategies. The emergence of eDNA metabarcoding and nonlinear time series analysis provides powerful tools to detect and validate influential organisms in agricultural systems, as demonstrated by the G. nunn validation research.
This ecological network approach enables researchers to move beyond the simplistic pest-pathogen paradigm toward a more holistic understanding of crop performance within complex ecological communities. By identifying previously overlooked influential organisms and quantifying their effects on crop growth and gene expression, this approach opens new possibilities for developing agricultural management strategies that harness ecological complexity rather than attempting to simplify it. As agricultural science faces the dual challenges of increasing productivity while reducing environmental impacts, integrating ecological understanding into breeding paradigms will be essential for developing truly sustainable cropping systems.
The concept of the keystone species has been fundamental to ecology since American zoology professor Robert T. Paine's pioneering research in the 1960s demonstrated that removing a single predator species, the Pisaster ochraceus sea star, could halve the biodiversity of a tidal plain ecosystem within a year [13]. A keystone species is an organism that helps define an entire ecosystem, and whose impact on its environment is disproportionately large relative to its abundance [13] [14]. Unlike other species categories, keystone species have low functional redundancy, meaning that if they disappear from the ecosystem, no other species can fill their ecological niche, potentially leading to dramatic ecosystem changes or collapse [13].
In agricultural contexts, this concept expands to include human components. Recent research proposes that farmers and landowners themselves function as keystone species in agroecosystems, as their management decisions directly influence ecosystem health and sustainability [15]. Their role in distributing organisms, managing abundance, and maintaining diversity creates a complex ecological network where agricultural practices and natural processes intersect.
Ecological network theory provides a quantitative framework for understanding these complex interspecific relationships. By representing species as nodes and their interactions as links, network analysis allows researchers to identify critical species whose position in the web of interactions gives them outsized influence on ecosystem stability and function [16] [14] [17]. This approach has become increasingly valuable for developing sustainable agricultural systems that work with, rather than against, natural ecological processes.
Methodological Approaches for Identifying Keystone Species
Ecological Network Analysis Using Environmental DNA
Advanced monitoring technologies have revolutionized our ability to study complex agricultural ecosystems. Environmental DNA (eDNA) metabarcoding enables comprehensive detection of species—from microbes to insects—by sequencing DNA extracted from environmental samples such as soil and water [3] [7]. When combined with nonlinear time series analysis, this approach can identify causal relationships between organisms and crop performance under field conditions [3] [4].
In rice paddy ecosystems, researchers have employed intensive daily monitoring of ecological communities while tracking rice growth rates [3] [1]. This methodology involves:
- Frequent sampling: Daily collection of water samples from experimental plots
- Quantitative analysis: Using internal spike-in DNAs to enable quantitative assessment of species abundance [7]
- Causality detection: Applying unified information-theoretic causality analysis to extensive time-series data to identify potentially influential organisms [4]
This integrated approach allows researchers to move beyond simple correlation to detect causal relationships in complex field environments where multiple confounding factors exist.
Topological Network Indices
Network analysis provides multiple metrics for quantifying species importance based on their positional significance in food webs:
- Degree Centrality: Measures the number of direct connections a species has to others, identifying "hub" species with many interactions [14]
- Betweenness Centrality: Quantifies how frequently a species lies on the shortest path between other species, indicating control over information exchange and energy flow [14]
- Closeness Centrality: Assesses how quickly a species can reach all others in the network, highlighting species that can rapidly spread impacts through the ecosystem [14]
- Keystone Index (K): Combines both bottom-up and top-down effects to measure a species' overall importance, considering both direct and indirect impacts on the food web [14]
- Motif Centrality: Based on how frequently a species participates in recurrent subgraphs (motifs) that are statistically overrepresented in the network [16]
These topological approaches allow researchers to quantitatively rank species by their potential ecological importance, moving beyond qualitative assessments.
Table 1: Comparison of Centrality Measures for Identifying Keystone Species
| Centrality Measure | Ecological Interpretation | Key Strength | Primary Limitation |
|---|---|---|---|
| Degree Centrality | Identifies species with many direct connections | Simple to calculate and interpret | Misses species with few but critical connections |
| Betweenness Centrality | Highlights species connecting different network modules | Captures control over energy flow | May underestimate importance of highly connected hubs |
| Closeness Centrality | Indicates ability to rapidly affect entire network | Identifies efficient spreaders of effects | Sensitive to network fragmentation |
| Motif Centrality | Based on participation in key subnetwork patterns | Reflects mesoscale network structure | Computationally intensive for large networks |
| Keystone Index | Combines top-down and bottom-up influences | Comprehensive measure of overall impact | Complex calculation requiring complete network data |
Experimental Validation Approaches
Identification of potential keystone species through network analysis requires experimental validation to confirm ecological impacts. Two primary approaches dominate this field:
Topological simulation examines secondary extinctions that occur when a species is removed from the food web, assuming secondary extinction occurs when a species loses all its prey resources [16]. This method computationally evaluates how network structure changes after species removal.
Population dynamic modeling uses biomass-based models to simulate energy flow through food webs, with secondary extinction occurring when a species' biomass falls below a critical threshold (e.g., 10â»Â³â° g C mâ»Â²) [16]. This approach more realistically captures ecological dynamics but requires extensive parameterization.
More recently, field manipulation experiments have provided direct evidence for keystone effects. These involve actively manipulating species abundance in experimental plots and measuring responses in target species, including growth rates, gene expression patterns, and yield parameters [3] [4]. This approach provides the most compelling evidence for keystone status but is resource-intensive.
Comparative Analysis of Keystone Species Identification Methods
Table 2: Methodological Comparison for Keystone Species Identification in Agricultural Research
| Methodological Approach | Data Requirements | Key Outputs | Validation Requirements | Applications in Agriculture |
|---|---|---|---|---|
| eDNA with Nonlinear Time Series | Daily ecological monitoring via eDNA metabarcoding; crop performance metrics | List of potentially influential organisms; causal network diagrams | Field manipulation experiments; gene expression analysis | Identifying microbial and invertebrate species influencing crop growth [3] [4] |
| Topological Network Analysis | Comprehensive food web data; predator-prey interaction matrices | Centrality indices; keystone rankings; robustness assessments | Secondary extinction simulations; comparison with empirical data | Prioritizing conservation targets; understanding ecosystem stability [16] [14] |
| Motif Centrality Analysis | Detailed food web structure with weighted interactions | Motif participation frequencies; mesoscale importance rankings | Dynamic simulations comparing motif-based vs random removals | Understanding stability mechanisms in complex agricultural food webs [16] |
| Field Manipulation Experiments | Target species for manipulation; controlled field plots | Direct measures of crop response; gene expression changes | Statistical analysis of treatment effects; replication across environments | Validating effects of specific organisms on crop performance [3] [4] |
Case Study: Detecting and Validating Influential Organisms in Rice Growth
Experimental Workflow and Research Design
A comprehensive research program demonstrates the integration of ecological network theory with agricultural application [3] [4] [1]. The study implemented a complete workflow from ecological monitoring to experimental validation:
Diagram 1: Experimental workflow for detecting and validating influential organisms in rice growth
Key Research Findings and Experimental Validation
The initial monitoring phase detected 1,197 species in the experimental rice plots through quantitative eDNA metabarcoding [3] [4]. Nonlinear time series analysis of this extensive dataset identified 52 potentially influential organisms with significant causal effects on rice growth rates [4]. From these, two species were selected for experimental validation: the oomycete Globisporangium nunn and the midge Chironomus kiiensis [3].
Controlled manipulation experiments demonstrated that adding G. nunn to rice plots resulted in statistically significant changes in both rice growth rates and gene expression patterns [3] [4]. While the effects were relatively small, they confirmed that this previously overlooked organism genuinely influences rice performance under field conditions [1]. The validation of ecological network predictions through manipulative experiments provides a powerful approach for identifying functionally important species in agricultural ecosystems.
The Scientist's Toolkit: Essential Research Reagents and Materials
Table 3: Essential Research Materials for Ecological Network Analysis in Agriculture
| Research Tool Category | Specific Examples | Primary Function | Application in Keystone Species Research |
|---|---|---|---|
| Field Monitoring Equipment | Sterivex filter cartridges (0.22-µm, 0.45-µm); environmental sensors; Wagner pots | Sample collection and controlled growth environments | Standardized sample collection for eDNA analysis; monitoring abiotic factors [1] |
| Molecular Biology Reagents | DNA extraction kits; PCR reagents; internal spike-in DNAs; sequencing libraries | Processing and analysis of environmental DNA | Quantitative assessment of species abundance and diversity in ecosystems [3] [7] |
| Bioinformatics Tools | Nonlinear time series algorithms; causality detection software; network analysis packages | Data analysis and network reconstruction | Identifying causal relationships; constructing ecological networks; calculating centrality indices [3] [4] |
| Experimental Manipulation Supplies | Target organism cultures; exclusion cages; plot dividers | Field-based validation experiments | Testing hypothesized ecological relationships through controlled manipulations [3] |
| Plant Phenotyping Equipment | SPAD meters; RNA sequencing kits; growth measurement tools | Assessing plant responses to ecological manipulations | Quantifying effects of keystone species on crop performance and physiology [3] [1] |
| DBCO-NHCO-PEG5-NHS ester | DBCO-NHCO-PEG5-NHS ester, MF:C36H43N3O11, MW:693.7 g/mol | Chemical Reagent | Bench Chemicals |
| 1-Palmitoyl-sn-glycerol 3-phosphate | 1-Palmitoyl-sn-glycerol 3-phosphate, MF:C19H39O7P, MW:410.5 g/mol | Chemical Reagent | Bench Chemicals |
Ecological Network Concepts and Analytical Framework
Ecological network theory provides multiple analytical levels for understanding species importance in agricultural ecosystems. The concept of motif centrality has emerged as a particularly valuable approach, focusing on species' participation in recurrent subgraphs (motifs) that appear more frequently than expected by chance [16]. These motifs represent fundamental building blocks of ecological networks and include:
- Exploitation Competition (EC): Indirect competition through shared limiting resources
- Tri-trophic Chain (TC): Linear feeding relationships across three trophic levels
- Apparent Competition (AC): Indirect interaction between species sharing a common predator
- Intraguild Predation (IGP): Killing and eating among potential competitors [16]
Research demonstrates that species with high motif centrality—those that participate frequently in these key subnetwork patterns—often have disproportionate importance for ecosystem stability [16]. Simulations show that removing species based on motif centrality causes significantly more secondary extinctions than random removal, confirming that motif participation effectively identifies keystone species [16].
Diagram 2: Hierarchical framework for analyzing species in ecological networks
The integration of ecological network theory with advanced molecular monitoring technologies represents a paradigm shift in agricultural research. By moving beyond simplistic pest-beneficial organism dichotomies to understand agricultural ecosystems as complex networks of interacting species, researchers can identify critical leverage points for sustainable management [15] [3].
The case study examining Globisporangium nunn's influence on rice growth demonstrates how this integrated approach can identify previously overlooked species that significantly impact crop performance [3] [4]. This methodology combines comprehensive biodiversity monitoring through eDNA metabarcoding, causal inference through nonlinear time series analysis, and rigorous validation through field manipulations [3] [1].
As agricultural science faces the dual challenges of increasing productivity while reducing environmental impacts, ecological network approaches offer promising pathways for working with ecological complexity rather than attempting to simplify it [15] [3]. Identifying and understanding keystone species in agricultural ecosystems will be crucial for developing management strategies that enhance both sustainability and resilience.
Globisporangium nunn (syn. Pythium nunn) is a soil-dwelling oomycete that has historically been overlooked in agricultural research. Recent ecological network studies have revealed its significant influence on rice growth, shifting its status from an obscure soil microbe to a potential biotic factor affecting crop performance [3] [4]. This oomycete belongs to the broader Globisporangium genus (formerly clades E–G, I, and J of Pythium sensu lato), which comprises diverse species known to inhabit both aquatic and terrestrial environments [18]. Species within this genus are recognized as ecologically important organisms within the phylum Oomycota (water molds), capable of existing as saprobes, parasites, or pathogens in various ecosystems [18]. While many Globisporangium species are known plant pathogens causing damping-off and root rot in numerous hosts [19], the specific ecological role and agricultural impact of G. nunn have only recently been investigated through advanced ecological monitoring techniques.
Taxonomic Classification and Phylogenetic Position
Globisporangium nunn falls within the kingdom Straminipila, which includes diatoms, brown algae, and slime molds [18]. The taxonomic reclassification of many Pythium species into Globisporangium was driven by molecular phylogenetic analyses revealing the paraphyletic nature of Pythium sensu lato [18] [19]. This reorganization established Globisporangium as a distinct genus comprising species from clades E–G, I, and J of the original Pythium classification [18].
Molecular identification of Globisporangium species typically relies on multi-locus phylogenetic analyses of the nuclear rDNA internal transcribed spacer region (ITS1–5.8S–ITS2) and partial cytochrome C oxidase subunits (cox1 and cox2) [18]. This approach provides reliable differentiation between G. nunn and related species such as G. ultimum, G. glomeratum, and the recently discovered G. parvizense and G. sarabense from Iranian freshwater habitats [18] [19] [20].
Ecological Network Analysis: Detecting Influence Through Advanced Monitoring
Research Framework and Methodology
The discovery of G. nunn's influence on rice resulted from an innovative ecological network approach that combined intensive field monitoring with nonlinear time series analysis [3] [4]. This methodology represented a significant advancement in understanding species interactions within complex agricultural ecosystems.
Table 1: Experimental Design for Ecological Network Analysis
| Component | Specifications | Application in Research |
|---|---|---|
| Experimental Plots | Five 216 L plastic containers with 16 Wagner pots each; commercial soil; well water [1] [9] | Created controlled but realistic field conditions for rice cultivation |
| Monitoring Period | 122 consecutive days (23 May - 22 September 2017) [3] [9] | Enabled daily tracking of rice growth and ecological community dynamics |
| Rice Growth Metrics | Daily growth rate (cm/day) via leaf height measurement [3] [9] | Provided quantitative data on rice performance as an integrated physiological indicator |
| Community Monitoring | Quantitative eDNA metabarcoding with four universal primer sets (16S rRNA, 18S rRNA, ITS, and COI) [3] [9] | Enabled detection of 1,197 species including prokaryotes, eukaryotes, fungi, and animals |
The analytical approach employed unified information-theoretic causality analysis to reconstruct interaction networks surrounding rice plants [4] [9]. This method identified 52 potentially influential organisms from the 1,197 species detected, with G. nunn emerging as a significant factor affecting rice growth dynamics [3] [4].
Experimental Workflow
The following diagram illustrates the comprehensive research workflow from initial monitoring to experimental validation:
Experimental Validation: Manipulating G. nunn Abundance and Measuring Rice Response
Field Manipulation Protocol
In 2019, researchers conducted field experiments to empirically validate the causal relationship between G. nunn and rice growth predicted by the ecological network analysis [3] [4]. The manipulation experiments followed a rigorous protocol:
- Experimental Setup: Artificial rice plots were established similar to the 2017 monitoring study [3]
- Treatment Application: G. nunn was added to designated rice plots at predetermined abundance levels [3] [4]
- Control Conditions: Parallel experiments included manipulations of Chironomus kiiensis (another influential organism identified) for comparison [3] [4]
- Response Monitoring: Rice growth rates and gene expression patterns were measured before and after manipulation [3] [4]
The experiments confirmed that G. nunn addition resulted in statistically significant changes in rice growth rate and gene expression patterns, validating the predictions from the 2017 time series analysis [3] [4]. Although the effects were characterized as "relatively small," they were statistically clear and biologically relevant [3] [4].
Quantitative Outcomes of G. nunn Manipulation
Table 2: Experimentally Measured Effects of G. nunn on Rice
| Parameter Measured | Experimental Treatment | Observed Effect | Statistical Significance |
|---|---|---|---|
| Rice Growth Rate | Addition of G. nunn to rice plots | Significant change in growth dynamics | Statistically clear effects [3] [4] |
| Gene Expression Patterns | Addition of G. nunn to rice plots | Altered transcriptome dynamics | Statistically clear effects [3] [4] |
| Comparative Impact | G. nunn vs. C. kiiensis manipulation | Stronger effect than midge manipulation | Particularly pronounced in G. nunn-added treatment [3] |
The Researcher's Toolkit: Essential Materials and Methods
Table 3: Key Research Reagents and Methodologies for Globisporangium Studies
| Reagent/Technique | Specification | Research Application |
|---|---|---|
| CMA Medium | Corn Meal Agar | Cultivation and purification of Globisporangium isolates [18] |
| PARP-V8 Selective Medium | V8 juice, pimaricin, ampicillin, rifampicin, PCNB | Selective isolation of oomycetes from environmental samples [19] |
| Quantitative eDNA Metabarcoding | 16S rRNA, 18S rRNA, ITS, and COI primer sets | Comprehensive species detection and abundance quantification [3] [9] |
| Causality Analysis | Unified information-theoretic causality | Network reconstruction from time series data [4] |
| Multi-Locus Phylogenetics | ITS, cox1, and cox2 genomic regions | Species identification and taxonomic classification [18] |
| Pathogenicity Assays | Cucumber seedling bioassay | Confirmation of pathogenic potential on host plants [18] |
| Tetramethrin-d6 | Tetramethrin-d6, MF:C19H25NO4, MW:337.4 g/mol | Chemical Reagent |
| RC-33 Hydrochloride | RC-33 Hydrochloride, MF:C21H28ClN, MW:329.9 g/mol | Chemical Reagent |
Comparative Analysis with Related Globisporangium Species
When contextualizing G. nunn within its genus, important distinctions emerge from comparing its ecological role with documented impacts of related species:
Table 4: Ecological and Pathogenic Profiles of Globisporangium Species
| Species | Ecological Role | Documentated Host/Environment | Key Impacts |
|---|---|---|---|
| G. nunn | Influential soil organism | Rice agroecosystems | Alters rice growth rate and gene expression [3] [4] |
| G. glomeratum | Plant pathogen | Quercus ilex (holm oak) | Causes root rot, wilting, and significant biomass reduction [19] |
| G. ultimum | Broad-host pathogen | >300 diverse plant species | Causes damping-off and root rot [20] |
| G. parvizense | Aquatic oomycete | Freshwater habitats (Iran) | Causes root and crown rot in cucumber [18] |
| G. sarabense | Aquatic oomycete | Freshwater habitats (Iran) | Causes root and crown rot in cucumber [18] |
Unlike the clearly pathogenic G. glomeratum and G. ultimum, which cause severe disease symptoms including root rot and damping-off [19] [20], G. nunn demonstrates a more subtle but statistically significant influence on rice growth physiology without documented pathogenicity in the studied context [3] [4]. This distinction highlights the diverse ecological functions within the Globisporangium genus, ranging from overt pathogens to influential members of agricultural ecosystems with more nuanced effects on plant hosts.
Implications for Sustainable Agriculture and Future Research
The discovery of G. nunn's influence on rice growth represents a significant advancement in understanding complex plant-microbe interactions in agricultural systems. This research demonstrates that intensive ecosystem monitoring combined with nonlinear time series analysis can identify previously overlooked biotic factors affecting crop performance [3] [4]. The ecological network approach employed in these studies provides a powerful framework for detecting influential organisms in complex agricultural ecosystems, offering new possibilities for harnessing ecological interactions to enhance sustainable food production [3] [9].
Future research directions emerging from these findings include:
- Mechanistic Studies: Investigating the molecular mechanisms through which G. nunn influences rice growth and gene expression
- Agricultural Applications: Exploring potential applications of G. nunn manipulation for optimizing rice production
- Broader Ecological Patterns: Applying similar network approaches to identify influential organisms in other agricultural systems
- Interaction Dynamics: Studying how G. nunn interacts with other soil microbes to collectively influence plant health and productivity
This proof-of-concept study establishes an important foundation for the further development of field-based system management approaches that leverage ecological complexity for agricultural benefit [3] [4]. As agricultural science seeks sustainable solutions for enhancing food production while reducing environmental impacts, understanding and utilizing influential organisms like G. nunn may provide valuable pathways toward more ecologically integrated farming systems.
Agricultural science faces a fundamental challenge in bridging the gap between observable crop performance and the complex ecological dynamics that influence it. While traditional agronomy has excelled at measuring plant growth metrics, the intricate web of species interactions surrounding crops has remained largely unexplored territory due to methodological limitations. This knowledge gap is particularly significant for staple crops like rice (Oryza sativa), which feeds over 3.5 billion people worldwide and is typically grown in field conditions where it is influenced by numerous ecological community members [3] [9].
The emergence of advanced monitoring technologies and novel analytical frameworks now enables researchers to dissect these complex relationships with unprecedented precision. This comparison guide examines pioneering methodologies that integrate ecological network analysis with crop performance validation, with specific focus on research investigating the effects of Globisporangium nunn manipulation on rice growth. We objectively compare the experimental approaches, data outputs, and practical applications of these frameworks to guide researchers in selecting appropriate protocols for similar investigations.
Methodological Frameworks: A Comparative Analysis
Ecological Network Approach with eDNA Monitoring
Experimental Protocol: The ecological network approach for detecting organism-crop interactions employs intensive field monitoring combined with causal inference modeling [3] [9]. The methodology involves:
- Experimental Plot Establishment: Researchers created small artificial rice plots using plastic containers (90 × 90 × 34.5 cm) filled with commercial soil, with sixteen Wagner pots per plot and three rice seedlings per pot [1].
- Daily Growth Monitoring: Rice growth rates (cm/day in height) were measured daily by measuring the largest leaf heights of target individuals using a ruler [3] [9].
- Ecological Community Sampling: Water samples (approximately 200 ml) were collected daily from each rice plot and filtered using two types of Sterivex filter cartridges (φ 0.22-µm and φ 0.45-µm) [1].
- Quantitative eDNA Metabarcoding: Environmental DNA was extracted and analyzed using four universal primer sets targeting 16S rRNA (prokaryotes), 18S rRNA (eukaryotes), ITS (fungi), and COI (animals) regions [9].
- Causal Inference Analysis: Nonlinear time series analysis (specifically, unified information-theoretic causality) was applied to the resulting datasets containing 1,197 species and rice growth rates to identify potentially influential organisms [4] [9].
Validation Framework: In 2019, researchers conducted manipulative experiments to validate findings from the 2017 monitoring [3] [9]:
- Globisporangium nunn was added to artificial rice plots
- Chironomus kiiensis was removed from separate plots
- Rice responses (growth rate and gene expression patterns) were measured before and after manipulation
Socio-Ecological Systems Analysis
Experimental Protocol: An alternative approach for linking agricultural outcomes to complex variables employs Projections to Latent Structures (PLS) analysis to integrate socio-ecological and biophysical factors [21]:
- Farm Selection: Thirty-four farms were selected in two agro-ecological zones in Sweden, including both conventional and organic operations with varying transition histories [21].
- Data Collection: Researchers conducted questionnaire surveys with farmers to obtain management practice data and collected soil quality metrics, landscape structure variables, and crop performance indicators for spring barley [21].
- Multivariate Analysis: PLS analysis was used to examine relationships between multiple independent variables (ecological, management, landscape) and crop performance outcomes [21].
Table 1: Comparative Analysis of Methodological Frameworks
| Aspect | Ecological Network Approach | Socio-Ecological Analysis |
|---|---|---|
| Primary Focus | Species-interaction networks influencing crop growth | Socio-ecological and biophysical factors affecting crop performance |
| Monitoring Frequency | Daily sampling over 122 days | Single growing season assessment |
| Key Technology | Quantitative eDNA metabarcoding | Projections to Latent Structures (PLS) analysis |
| Taxonomic Resolution | 1,197 species identified | Broader factor categories |
| Causal Inference Method | Nonlinear time series analysis | Multivariate regression modeling |
| Validation Approach | Field manipulation experiments | Model fit parameters (R²Y and Q²Y) |
| Scale of Analysis | Experimental plots | Working farms across regions |
Key Research Findings: Quantitative Comparisons
Ecological Network Insights
The ecological network approach applied to rice systems yielded several significant findings [3] [9]:
- Network Complexity: From daily monitoring of 1,197 species, researchers identified 52 potentially influential organisms with causal relationships to rice growth performance [4] [9].
- Globisporangium nunn Effects: Manipulation experiments confirmed that adding this oomycete species changed rice growth rates and gene expression patterns, though effects were relatively small [3] [9].
- Temporal Dynamics: Rice growth rates peaked during late June to early July, while eDNA diversity reached maximum levels in August before declining in September [9].
- Prokaryote Dominance: Prokaryotes largely accounted for temporal patterns in total eDNA copy numbers, which increased later in the sampling period [9].
Socio-Ecological Factor Analysis
The PLS analysis of spring barley systems revealed contrasting drivers of crop performance [21]:
- Organic vs. Conventional Systems: Barley performance on organic farms was affected by previous management, landscape structure, and soil quality, while conventional farm yields were primarily influenced by external inputs [21].
- Management Complexity: Organic systems required more complex management strategies integrating multiple factors compared to conventional systems [21].
- Temporal Effects: The time since transition to organic farming significantly influenced variation in crop performance among farms [21].
Table 2: Quantitative Outcomes from Globisporangium nunn Manipulation Experiments
| Parameter | G. nunn-Added Treatment | C. kiiensis-Removed Treatment | Control Conditions |
|---|---|---|---|
| Rice Growth Rate | Changed | Not significantly changed | Baseline growth |
| Gene Expression Patterns | Altered | Minimal changes | Baseline expression |
| Effect Size | Relatively small but statistically clear | Less pronounced | Reference level |
| Biological Significance | Confirmed influence on rice performance | Limited demonstrated impact | Neutral |
The Scientist's Toolkit: Essential Research Reagents and Materials
Table 3: Essential Research Reagents and Materials for Ecological-Crop Interaction Studies
| Item | Specification/Type | Research Function |
|---|---|---|
| Sterivex Filter Cartridges | φ 0.22-µm and φ 0.45-µm | eDNA capture from water samples |
| Universal Primer Sets | 16S rRNA, 18S rRNA, ITS, COI | Taxonomic barcoding of prokaryotes, eukaryotes, fungi, and animals |
| Internal Spike-in DNAs | Quantitative standards | Enable quantitative eDNA metabarcoding |
| Artificial Rice Plots | 90 × 90 × 34.5 cm plastic containers | Controlled field microcosms |
| CMA Medium | Corn meal agar | Oomycete isolation and cultivation |
| PARP-V8 Selective Medium | V8 juice base with antibiotics | Selective isolation of oomycetes |
| NARF Medium | Specialized agar | Initial oomycete isolation from environmental samples |
| Vopimetostat | Vopimetostat, CAS:2760483-96-1, MF:C28H36N6O2S, MW:520.7 g/mol | Chemical Reagent |
| P2X4 antagonist-4 | P2X4 antagonist-4, MF:C27H22FN3O4S, MW:503.5 g/mol | Chemical Reagent |
Visualization of Research Workflows
Ecological Network Analysis Pipeline
Diagram 1: Ecological network analysis workflow for detecting influential organisms.
Cross-Methodological Comparison Framework
Diagram 2: Methodological pathways for linking ecology to crop growth.
Discussion: Bridging the Knowledge Gap
The integration of ecological network analysis with crop performance metrics represents a paradigm shift in agricultural research methodology. Where traditional factorial experiments could only account for two or three factors simultaneously [21], the frameworks examined here can handle thousands of interacting variables. This is particularly valuable for understanding complex agricultural systems where nonlinear effects, feedbacks, and interactions are common [21].
The demonstrated effect of Globisporangium nunn on rice growth, while modest, validates the potential of this approach to identify previously overlooked influential organisms [3] [9]. This oomycete genus, which includes various plant pathogenic species causing root and crown rot [18] [22], represents precisely the type of ecologically significant organism that traditional methods might miss.
Furthermore, the contrast between organic and conventional farming systems highlighted by the PLS analysis [21] reinforces the importance of context-dependent methodological selection. Ecological network approaches appear particularly suited to intensive experimental systems where high-frequency monitoring is feasible, while socio-ecological analyses offer valuable insights at the farm-to-landscape scale.
The knowledge gap between complex ecological dynamics and crop growth metrics is being bridged by innovative methodological frameworks that integrate high-resolution monitoring, advanced DNA technologies, and sophisticated causal inference algorithms. The research on Globisporangium nunn manipulation in rice systems demonstrates that previously overlooked organisms can significantly influence crop performance, though effect sizes may be context-dependent.
For researchers and drug development professionals investigating similar complex biological systems, the ecological network approach offers a powerful tool for hypothesis generation and validation, particularly when complemented by targeted manipulation experiments. The essential protocols, reagents, and analytical frameworks outlined in this comparison guide provide a foundation for designing studies that can effectively link ecological complexity to measurable crop outcomes, ultimately contributing to more sustainable and productive agricultural systems.
Harnessing eDNA and Nonlinear Time Series to Map Species Interactions
Achieving sustainable food production while reducing environmental impacts is a major challenge in agricultural science. While advanced breeding techniques offer promise, rice is grown in complex field environments and is influenced by a multitude of surrounding ecological community members. The understanding of how these ecological communities influence rice performance under field conditions has been underexplored, despite its potential for establishing environmentally friendly agricultural systems [4] [9]. Traditional observation- and manipulation-based approaches in ecology face critical limitations in identifying multitaxa species, quantifying their abundance under field conditions, and measuring their interactions [3]. This research presents a novel ecological-network-based approach that overcomes these limitations through intensive daily monitoring of experimental rice plots, leveraging recent advances in environmental DNA (eDNA) metabarcoding and nonlinear time series analysis [3] [9]. The study framework was validated through field manipulation experiments focusing on Globisporangium nunn (syn. Pythium nunn), an Oomycetes species, and Chironomus kiiensis, a midge species, demonstrating how targeted manipulation of influential organisms can affect rice growth rate and gene expression patterns [4].
Comparative Analysis of Agricultural Monitoring Approaches
Table 1: Comparison of different approaches for monitoring rice growth and field conditions.
| Monitoring Approach | Key Measured Parameters | Temporal Resolution | Spatial Scale | Key Advantages | Principal Limitations |
|---|---|---|---|---|---|
| Intensive eDNA & Growth Monitoring [3] [9] | Daily rice growth rate, ecological community dynamics via eDNA, gene expression | Daily | Small experimental plots (216L containers) | Comprehensive species detection (>1000), reveals causal relationships | Labor-intensive, requires specialized DNA analysis expertise |
| UAV & Satellite Fusion [23] | Leaf Area Index (LAI), Soil–Plant Analysis Development (SPAD) via vegetation indices | During key growth stages | Field level | Wide-area coverage, high-resolution, non-destructive | Limited by cloud cover, does not directly identify microbial species |
| Hybrid GPR Model with Sentinel-2 [24] | Leaf Area Index (LAI) | Remote sensing during phenological phases | Irrigated rice fields | Accurate estimation during reproductive and ripening phases | Underestimates LAI during key growth phases, no biotic community data |
| Multi-Source Remote Sensing with ML [25] | LAI, biomass, plant moisture content, backscatter coefficients | 45, 60, 90 days after transplanting | District level | Combines optical and SAR data, cloud-penetrating capability | Does not monitor microbial communities, dependent on satellite passes |
Methodological Framework: Experimental Design and Monitoring Protocols
Field Experimental Setting and Rice Growth Monitoring
The research established five artificial rice plots using small plastic containers (90 × 90 × 34.5 cm; 216 L total volume) in an experimental field at the Center for Ecological Research, Kyoto University, in Otsu, Japan (34° 58′ 18′′ N, 135° 57′ 33′′ E) [1]. Each plot contained sixteen Wagner pots filled with commercial soil, with three rice seedlings (var. Hinohikari) planted in each pot on 23 May 2017 and harvested on 22 September 2017 (122 days) [1]. The containers were filled with well water, and daily rice growth was monitored by measuring the leaf height of target individuals using a ruler, with the largest leaf heights measured [1]. This intensive monitoring protocol enabled the tracking of rice performance through growth rates (cm/day), selected because it allows for frequent, inexpensive monitoring and integrates various physiological states [9]. Climate variables including temperature, light intensity, and humidity were also monitored at each rice plot to account for abiotic factors [1].
Ecological Community Dynamics via eDNA Metabarcoding
The ecological community was monitored daily through water samples collected from the five rice plots, with approximately 200 ml of water collected from each plot and processed within 30 minutes [1]. The water was filtered using two types of Sterivex filter cartridges (φ 0.22-µm and φ 0.45-µm), resulting in 1220 water samples (122 days × 2 filter types × 5 plots) plus negative control samples collected during the census term [1]. The eDNA was extracted, purified, and analyzed through quantitative eDNA metabarcoding using four universal primer sets targeting different genetic regions: 16S rRNA (prokaryotes), 18S rRNA (eukaryotes), ITS (fungi), and COI (animals) [9]. This comprehensive approach enabled the detection of more than 1000 species (including microbes and macrobes) [4], with the quantitative nature of the time series being particularly crucial for the subsequent nonlinear time series analysis [9].
Time Series Causal Analysis
The extensive time series data containing 1197 species and rice growth rates were analyzed using nonlinear time series analysis to detect potential causal relationships [3] [9]. This method enabled the reconstruction of interaction networks surrounding rice and identified 52 potentially influential organisms with lower-level taxonomic information [3]. The time-series-based causality analysis required quantitative time series, making the quantitative eDNA data particularly suitable for this purpose [9]. This analytical approach can detect and quantify biological interactions in complex systems by examining how the abundance of different species predicts changes in rice growth rates over time.
Diagram 1: Experimental workflow showing the integrated approach of ecological monitoring and validation.
Validation Through Manipulation Experiments: Globisporangium nunn Case Study
Field Manipulation Design
Based on the time series analysis results from the 2017 monitoring, field manipulation experiments were conducted in 2019 to empirically validate the effects of two species identified as potentially influential: Globisporangium nunn (an Oomycetes species) and Chironomus kiiensis (a midge species) [4] [3]. During the 2019 growing season, G. nunn was added to artificial rice plots, while C. kiiensis was removed [3]. The research organism was rice (Oryza sativa), and the responses measured included both growth rate and gene expression patterns before and after manipulation [9]. This validation step was critical for transforming correlative observations from the time series analysis into demonstrated causal relationships under field conditions.
Key Findings and Quantitative Results
The manipulation experiments confirmed that both species, but especially G. nunn, had statistically clear effects on rice performance [3]. Specifically, the G. nunn-added treatment resulted in changes to rice growth rate and gene expression patterns [4] [3]. Although the effects of the manipulations were relatively small, they provided solid evidence that the integration of eDNA-based monitoring and time series analysis can effectively detect previously overlooked influential organisms in agricultural systems [3]. The successful validation of these predictions demonstrates the potential of this approach for identifying key species that can be targeted for agricultural management strategies.
Table 2: Quantitative results from intensive monitoring and manipulation experiments.
| Parameter Measured | Experimental Phase | Results | Significance |
|---|---|---|---|
| Monitoring Duration [1] | 2017 Monitoring | 122 consecutive days | Enabled high-resolution time series analysis |
| Species Detected [4] | eDNA Metabarcoding | >1000 species | Comprehensive community assessment |
| Influential Organisms Identified [3] | Nonlinear Time Series Analysis | 52 potentially influential organisms | Targeted candidates for manipulation |
| G. nunn Manipulation Effect [4] | 2019 Field Validation | Changed rice growth rate and gene expression | Confirmed causal relationship |
| Rice Growth Measurement [1] | Daily Monitoring | Growth rate (cm/day) | Integrated physiological state indicator |
Essential Research Reagents and Materials
Table 3: Key research reagent solutions for implementing intensive monitoring of experimental rice plots.
| Reagent/Material | Specification | Application in Protocol | Critical Function |
|---|---|---|---|
| Sterivex Filter Cartridges [1] | φ 0.22-µm and φ 0.45-µm | eDNA sample filtration | Capture microbial and macrobial DNA from water samples |
| Universal Primer Sets [9] | 16S rRNA, 18S rRNA, ITS, COI | eDNA metabarcoding | Amplify target genes from prokaryotes, eukaryotes, fungi, and animals |
| Internal Spike-in DNAs [9] | Quantitative standards | Quantitative eDNA analysis | Enable quantification of eDNA copy numbers |
| NARF Medium [26] | Nystatin + Ampicillin + Rifampicin + Fluazinam | Oomycetes isolation | Semi-selective medium for isolating oomycetes like Globisporangium |
| Artificial Rice Plots [1] | 90 × 90 × 34.5 cm plastic containers | Field experimental setup | Standardized growing conditions for replicated measurements |
Technical Pathways for Ecological Interaction Analysis
Diagram 2: Analytical pathway from ecological monitoring to validated biological effects.
Discussion: Implications for Agricultural Science and Practice
This proof-of-concept study demonstrates that intensive monitoring of agricultural systems combined with nonlinear time series analysis can successfully identify influential organisms under field conditions [3]. The research framework presents a sophisticated methodology to harness ecological complexity and utilize it for agricultural purposes, potentially reducing reliance on chemical inputs by identifying key species that influence crop performance [4]. While the effects observed in the manipulation experiments were relatively small, the approach provides an important basis for the further development of field-based system management [3]. The ability to detect more than 1000 species, including microbes and macrobes, and to identify specific influential organisms like Globisporangium nunn from this complexity represents a significant advancement in agricultural ecology [4]. This methodology bridges the gap between traditional agricultural science and modern molecular ecology, offering a powerful toolkit for understanding and manipulating the ecological networks that underpin crop productivity in real-world field conditions.
Environmental DNA (eDNA) metabarcoding has revolutionized ecological monitoring by detecting organisms through their genetic material in environmental samples. Quantitative eDNA metabarcoding represents a significant advancement beyond mere species detection, enabling researchers to estimate relative abundance and biomass across diverse biological communities. This capability transforms eDNA from a qualitative inventory tool into a powerful method for tracking community dynamics, quantifying ecological impacts, and monitoring ecosystem health. The development of rigorously quantitative approaches allows scientists to move beyond simple species lists to characterize complex interactions within ecological networks comprising hundreds or even thousands of species simultaneously.
The importance of this quantitative capability is particularly evident in agricultural research, where understanding complex species interactions is essential for developing sustainable practices. Traditional monitoring methods struggle to capture the full complexity of ecological communities, especially for cryptic, microscopic, or rare species. Quantitative metabarcoding addresses this limitation by providing comprehensive community snapshots that reveal how manipulations of specific organisms ripple through entire ecosystems. This article compares the performance of different eDNA approaches and examines how they enable groundbreaking research, such as validating the effects of Globisporangium nunn manipulation on rice growth within thousand-species communities.
Performance Comparison: Quantitative versus Traditional eDNA Approaches
Environmental DNA analysis encompasses several methodological approaches with varying capabilities for species detection and quantification. The table below compares four key techniques used in contemporary ecological research.
Table 1: Comparison of eDNA-Based Methodologies for Species Detection and Quantification
| Method | Target Scope | Quantitative Capability | Primary Applications | Key Limitations |
|---|---|---|---|---|
| Species-Specific qPCR | Single species | High (Precise DNA quantification) | Targeted detection of rare, endangered, or invasive species [27] | Requires prior knowledge of target species; Multiplexing limited to few species [27] |
| Traditional Metabarcoding | Multiple taxa across broad taxonomic groups | Low (Relative sequence reads influenced by technical biases) [28] | Biodiversity inventories; Community composition analysis [27] | Sequence reads not directly proportional to abundance due to PCR bias [29] |
| qMiSeq (Quantitative Metabarcoding) | Multiple taxa across broad taxonomic groups | Medium-High (Converts reads to estimated DNA copies using spike-ins) [29] | Quantitative community monitoring; Relative abundance estimates [29] | Requires internal standards; Computational complexity |
| Quantitative Metabarcoding with Spike-Ins | Multiple taxa across broad taxonomic groups | Medium-High (Sample-specific standard curves for copy number estimation) [3] [9] | Time-series analysis; Interaction network reconstruction [9] | Higher cost; Additional laboratory steps |
Recent studies have demonstrated that quantitative eDNA metabarcoding significantly outperforms traditional approaches for comprehensive community assessment. In a pioneering rice paddy study, researchers employed quantitative eDNA metabarcoding with internal spike-in DNA to monitor 1,197 species simultaneously, revealing 52 potentially influential organisms for rice growth [9]. This approach provided the necessary data density to reconstruct ecological interaction networks and identify specific species whose manipulation could affect crop performance.
The qMiSeq approach has shown particular promise for quantitative applications, demonstrating significant positive relationships between eDNA concentrations and both abundance and biomass of fish species in river systems [29]. This method converts sequence read numbers to estimated DNA copy numbers using internal standard curves, correcting for sample-specific PCR inhibition and library preparation biases that plague traditional metabarcoding [29].
Experimental Validation: Case Study in Agricultural Ecosystems
Research Context and Objectives
The application of quantitative eDNA metabarcoding to assess the effects of Globisporangium nunn manipulation on rice growth exemplifies its transformative potential in agricultural research. This oomycete species was initially identified as potentially influential through time-series analysis of intensive eDNA monitoring data [9]. The primary research objective was to validate whether targeted manipulation of this species would produce measurable effects on rice growth within complex field conditions where thousands of other organisms interact simultaneously.
This research framework addressed a fundamental challenge in agricultural ecology: understanding how specific organisms influence crop performance within intricately connected ecological communities. Previous approaches struggled to identify key influencers among the thousands of species present in agricultural ecosystems, but quantitative eDNA monitoring enabled researchers to detect subtle causal relationships within these complex networks [9].
Methodological Protocols
Sample Collection and Processing
The experimental protocol for detecting influential organisms in rice ecosystems involved:
- Daily monitoring of rice growth rates and ecological communities over 122 consecutive days during the growing season [9]
- Water sample collection from experimental rice plots with four universal primer sets (16S rRNA, 18S rRNA, ITS, and COI regions) targeting prokaryotes, eukaryotes, fungi, and animals respectively [9]
- Quantitative eDNA metabarcoding using internal spike-in DNAs to convert sequence reads to estimated DNA copy numbers, accounting for technical variations [3] [9]
- Nonlinear time series analysis using unified information-theoretic causality to detect potential causal relationships between rice growth and ecological community dynamics [9]
Validation Experiments
Following the initial monitoring phase, researchers implemented rigorous field validation:
- Manipulative experiments conducted two years after initial detection to verify causal relationships [9]
- Globisporangium nunn addition and Chironomus kiiensis removal treatments applied to artificial rice plots [9]
- Measurement of rice responses including growth rates and gene expression patterns before and after manipulation [9]
- Statistical confirmation of effects, particularly for G. nunn, demonstrating the validity of the time-series-based causality detection [9]
Table 2: Key Experimental Findings from Rice Paddy Ecological Monitoring
| Experimental Component | Key Results | Implications for Quantitative eDNA |
|---|---|---|
| Species Detection | 1,197 species detected from five rice plots over 122 days [9] | Demonstrates capacity for comprehensive community sampling |
| Causal Relationship Identification | 52 potentially influential organisms identified using nonlinear time series analysis [9] | Enables detection of ecological drivers within complex communities |
| Experimental Validation | G. nunn addition significantly changed rice growth rate and gene expression patterns [9] | Confirms predictive power of quantitative eDNA monitoring |
| Quantitative Assessment | Sequence counts showed significant consistency among replicates, supporting semi-quantitative applications [30] | Validates use of sequence data for relative abundance comparisons |
Workflow Visualization
The following diagram illustrates the integrated experimental workflow for detecting and validating influential organisms using quantitative eDNA metabarcoding:
Technical Considerations for Quantitative eDNA Metabarcoding
Essential Research Reagents and Materials
Successful implementation of quantitative eDNA metabarcoding requires specific reagents and materials to ensure accurate, reproducible results:
Table 3: Essential Research Reagents for Quantitative eDNA Metabarcoding
| Reagent/Material | Function | Application Notes |
|---|---|---|
| Spike-in DNA Standards | Enables conversion of sequence reads to estimated DNA copy numbers; corrects for PCR and sequencing biases [29] | Should be added to each sample prior to DNA extraction; Multiple concentrations recommended for standard curves |
| Universal Primer Sets | Amplifies barcode regions across broad taxonomic groups; Different loci (16S, 18S, ITS, COI) target different organism groups [27] | Primer selection depends on target taxa; Multiple primer sets often needed for comprehensive community analysis [9] |
| High-Fidelity Polymerase | Reduces PCR amplification errors during library preparation; Critical for accurate sequence variant detection | Particularly important for distinguishing closely related species |
| Negative Controls | Identifies contamination sources during field collection, DNA extraction, and amplification [27] | Essential for distinguishing true signal from background contamination |
| Reference Database | Taxonomic assignment of sequence variants; Critical for accurate species identification [27] | Database gaps limit species-level identification; Region-specific databases improve accuracy |
Critical Methodological Factors
Several methodological considerations significantly impact the quantitative performance of eDNA metabarcoding:
Primer Selection and Bias: Different primer sets capture different portions of the biological community, and primer biases can significantly affect quantitative estimates [27] [28]. The use of multiple primer sets targeting different genomic regions provides more comprehensive community coverage [9].
Reference Database Completeness: Taxonomic assignment depends on comprehensive reference databases. Incomplete databases can prevent species-level identification, with one study reporting only 36.2% of operational taxonomic units (OTUs) identified to species level [31].
Statistical Decontamination: Application of site occupancy modeling and decontamination pipelines is essential to distinguish true biological signals from contamination and sequencing errors [27].
Temporal Replication: Frequent sampling over time enables the application of causal inference methods that can distinguish correlation from causation in complex ecological datasets [9].
Quantitative eDNA metabarcoding represents a transformative approach for capturing comprehensive community snapshots across diverse ecosystems. The ability to simultaneously monitor thousands of species and quantify their dynamics has enabled groundbreaking research, including the validation of Globisporangium nunn effects on rice growth within complex ecological communities. While methodological challenges remain, particularly regarding primer biases and reference database completeness, the continuous refinement of quantitative approaches promises to further enhance our understanding of complex biological systems.
The integration of quantitative eDNA metabarcoding with manipulative experiments creates a powerful framework for identifying key species interactions and validating their ecological impacts. As these methods become more accessible and standardized, they will increasingly support evidence-based management in agriculture, conservation, and ecosystem monitoring, providing unprecedented insights into the complex workings of biological communities.
In agricultural research, accurately measuring rice performance is fundamental to improving crop productivity and resilience. While final yield is the ultimate agronomic outcome, physiological indicators such as growth rate provide crucial insights into plant health, stress responses, and underlying biological processes long before harvest. Growth rate serves as a sensitive, integrative measure that reflects the cumulative effect of genetics, environmental conditions, and biotic interactions. This review examines the role of growth rate as a key metric for evaluating rice performance, with particular focus on its application in validating the influence of ecological organisms such as Globisporangium nunn.
Growth Rate in the Context of Other Physiological Indicators
Rice performance is evaluated through a suite of physiological and agronomic traits that provide complementary information. The table below compares growth rate with other common indicators used in rice research.
Table 1: Comparative analysis of key physiological indicators for measuring rice performance
| Indicator | Measurement Methodology | Key Strengths | Key Limitations | Representative Findings |
|---|---|---|---|---|
| Growth Rate | Daily measurement of plant height (cm/day) using a ruler [3]. | Simple, cost-effective, integrates various physiological states, enables frequent monitoring [3]. | Does not specify the exact physiological mechanism behind observed changes [3]. | G. nunn addition changed rice growth rate and gene expression [3]. |
| Stomatal Conductance (gsw) | Measured using a porometer (rate of water vapor loss from leaves) [32]. | Reliable early indicator of water stress before visible symptoms appear [32]. | Requires specialized equipment, influenced by transient environmental factors [32]. | Used as a threshold for irrigation in modified Alternate Wetting and Drying (AWD) [32]. |
| Antioxidant Enzyme Activity | Spectrophotometric measurement of enzymes like catalase (CAT) and peroxidase (POD) [33]. | Directly quantifies oxidative stress response, strong correlation with abiotic stress tolerance [33]. | Destructive sampling, complex biochemical procedures [33]. | Significantly increased under water-deficit conditions; associated with drought-tolerant genotypes [33]. |
| Chlorophyll Content | Measured via SPAD meter or solvent extraction [33]. | Non-destructive (SPAD), indicates photosynthetic capacity and nitrogen status [33]. | Can be confounded by other factors like leaf thickness and nutrient deficiencies [33]. | Substantially decreased under water-deficit conditions [33]. |
| Gene Expression Patterns | RNA sequencing or RT-qPCR of stress-responsive genes [3]. | Reveals molecular mechanisms and specific pathways activated in response to stimuli [3]. | Expensive, requires specialized expertise and equipment, destructive sampling [3]. | Patterns were altered in rice following manipulation of G. nunn and C. kiiensis [3]. |
Experimental Approaches for Measuring Growth and Physiological Responses
Validating Organismal Influences via Ecological Networks
A groundbreaking study utilized growth rate as a primary metric to validate the influence of specific organisms on rice performance in a complex field environment [3].
- Experimental Protocol: The research involved intensive daily monitoring of rice growth rates (cm/day in height) and ecological community dynamics over 122 consecutive days in experimental plots [3]. Ecological communities, including over 1000 species of microbes and macrobes, were comprehensively monitored using quantitative environmental DNA (eDNA) metabarcoding [3]. Subsequently, nonlinear time series analysis (a causality detection method) was applied to the data to reconstruct interaction networks and identify 52 organisms potentially influencing rice growth [3].
- Manipulation Experiments: To validate predictions, the abundance of two species identified by the model—the oomycete Globisporangium nunn and the midge Chironomus kiiensis—was manipulated in field plots in 2019 [3]. G. nunn was added, while C. kiiensis was removed, and the responses of rice, including growth rate and gene expression patterns, were measured [3].
- Key Findings: The manipulation of G. nunn resulted in statistically clear changes in rice growth rate and gene expression, confirming the predictive power of the ecological network approach and the role of this previously overlooked organism [3]. This study showcases a robust protocol for harnessing ecological complexity, with growth rate serving as a key validating indicator.
Assessing Abiotic Stress Responses
Growth rate is also widely used to evaluate rice responses to abiotic stresses like drought and low temperature, and the efficacy of mitigation strategies.
- Nitrogen Application after Low Temperature Stress: A bucket experiment investigated how nitrogen application promotes recovery of rice seedlings after low temperature stress (12°C for 4 days) [34]. Seedling height, fresh weight, and dry weight were measured over 12 days. Results showed that nitrogen application significantly increased these growth indicators, with a more pronounced effect in the stressed plants compared to those under normal temperatures [34]. The study linked this accelerated growth recovery to physiological mechanisms including increased antioxidant enzyme activity, enhanced nitrogen metabolizing enzyme activity, and regulation of gibberellin (GA3) and abscisic acid (ABA) levels [34].
- Water-Deficit Conditions: Field trials evaluating 15 advanced rice breeding lines under well-watered and water-deficit conditions used plant height as one key metric [33]. The studies found that water-deficit stress caused a substantial decrease in plant height and grain yield, and identified genotypes with superior performance under stress [33].
The Scientist's Toolkit: Key Research Reagent Solutions
The following table outlines essential reagents and materials used in the featured experiments for measuring rice physiological performance.
Table 2: Essential research reagents and materials for rice physiology experiments
| Reagent/Material | Function/Application | Specific Example from Research |
|---|---|---|
| Universal PCR Primers | Amplifying target genes for eDNA metabarcoding to identify ecological community members [3]. | Primers for 16S rRNA (prokaryotes), 18S rRNA (eukaryotes), ITS (fungi), and COI (animals) regions [3]. |
| Internal Spike-in DNAs | Enabling quantitative eDNA analysis by accounting for technical variations during sequencing and sample processing [3]. | Used to generate quantitative time-series data essential for nonlinear causality analysis [3]. |
| Antioxidant Assay Kits | Quantifying enzyme activity (e.g., Catalase, Peroxidase) to measure oxidative stress levels in plants [33]. | Used to show increased activity in rice under water-deficit conditions [33]. |
| RNA Sequencing Reagents | Profiling global gene expression patterns (transcriptome) to understand molecular responses to treatments or stresses [3]. | Used to analyze changes in rice gene expression after G. nunn and C. kiiensis manipulation [3]. |
| Soil Moisture Sensors | Precisely monitoring and maintaining defined water stress conditions in pot or field experiments [32]. | Tensiometers used to set specific soil moisture thresholds (e.g., -40 kPa, -80 kPa) for drought treatments [32]. |
| Spartioidine N-oxide | Spartioidine N-oxide, MF:C18H23NO6, MW:349.4 g/mol | Chemical Reagent |
| 3-Acetylyunaconitine | 3-Acetylyunaconitine, MF:C37H51NO12, MW:701.8 g/mol | Chemical Reagent |
Signaling Pathways in Rice Growth Responses
The physiological indicators discussed often reflect the activity of underlying signaling pathways. The diagram below integrates key pathways involved in rice growth responses to environmental stimuli and biotic interactions, as revealed by the cited research.
Diagram 1: Key signaling pathways in rice growth responses. Pathways are triggered by abiotic stresses or biotic interactions, leading to molecular and physiological changes that integrate to determine growth rate and yield.
Growth rate stands as a versatile, sensitive, and integrative physiological indicator for assessing rice performance. Its utility spans from validating complex ecological interactions, as demonstrated in the Globisporangium nunn research, to quantifying responses to abiotic stresses like drought and low temperature. While advanced molecular and biochemical metrics provide deeper mechanistic insights, growth rate offers a practical, cost-effective, and biologically relevant measure that bridges the gap between molecular events and agronomic outcomes. The future of rice performance research lies in multi-faceted approaches that correlate simple metrics like growth rate with deeper physiological and molecular analyses to build a comprehensive understanding of plant function in dynamic environments.
Nonlinear Time Series Analysis (Empirical Dynamic Modeling) for Causal Inference
Empirical Dynamic Modeling (EDM) is a framework for analyzing and predicting nonlinear dynamical systems without requiring explicit equation-based models. It operates on the principle that time series data observed from a dynamical system can be used to reconstruct the system's underlying state-space structure. Unlike traditional linear approaches, EDM naturally accommodates state-dependent behavior and nonlinear dynamics common in biological and ecological systems. The methodology has found applications across diverse fields including ecology, neuroscience, and climate studies, proving particularly valuable for identifying causal relationships in complex systems where controlled experiments are difficult or impossible [35].
A cornerstone of EDM is Takens' Theorem, which establishes that the complete state-space of a dynamical system can be reconstructed from time-lagged observations of a single variable. This reconstruction enables researchers to analyze system dynamics and infer interactions between variables. EDM is especially powerful for causal inference in systems where variables exhibit non-linear, non-additive interactions that cannot be adequately captured by traditional correlation-based methods [36] [35].
Core EDM Algorithms and Comparative Performance
Fundamental Algorithms in Practice
EDM encompasses several key algorithms, each with distinct strengths for causal analysis:
- Simplex Projection: A nearest-neighbor algorithm used for forecasting and determining the optimal embedding dimension (E). It works by locating the k nearest neighbors in the state-space and making forecasts based on a weighted average of their future values [35].
- S-Map (Sequential Locally Weighted Global Linear Maps): Extends Simplex by fitting local linear models to state-space neighbors, with a tuning parameter (θ) controlling the degree of locality. The S-Map coefficients can be interpreted as interaction strengths between variables [35].
- Convergent Cross Mapping (CCM): A causality detection method based on the concept that if variable X causally influences variable Y, then the state-space reconstruction from Y's time series can predict X's states. CCM tests for causality by assessing whether cross-mapping skill converges as more data points are used [35].
Comparative Performance in Ecological Research
Table 1: Performance Comparison of EDM Algorithms in Ecological Applications
| Algorithm | Primary Function | Key Parameters | Strengths | Limitations |
|---|---|---|---|---|
| Simplex | Forecasting & dimensionality analysis | E (embedding dimension) | Robust for short, noisy time series; determines optimal E | Limited to forecasting only |
| S-Map | Forecasting & interaction strength quantification | E, θ (localization) | Quantifies time-varying interactions; reveals state-dependent dynamics | More computationally intensive; requires parameter tuning |
| Convergent Cross Mapping (CCM) | Causal inference | E, library size | Detects causality in weakly coupled systems; avoids spurious correlations | Requires sufficiently long time series for convergence |
| Multiview Embedding | Forecasting with multiple embeddings | - | Improved forecast skill by combining multiple perspectives | Complex implementation; computationally demanding |
In applications to mosquito population dynamics, EDM methods successfully predicted yearly maximum abundances and identified key environmental drivers. The S-Map algorithm demonstrated particular utility for capturing nonlinear behavior, with optimal performance at θ ≈ 2.5-4, significantly outperforming autoregressive models in forecasting chaotic population dynamics [36].
EDM Application: Detecting Organisms Influencing Rice Growth
Experimental Framework and Workflow
A groundbreaking application of EDM for causal inference in agriculture involved identifying previously overlooked organisms that influence rice growth performance. The research employed an integrated approach combining environmental DNA (eDNA) metabarcoding with nonlinear time series analysis [37] [4] [9].
Diagram 1: Experimental workflow for detecting and validating influential organisms in rice fields using EDM and manipulative experiments. The three-phase approach integrated intensive monitoring, causal inference, and field validation.
Causal Inference and Validation Results
The study generated extensive time series data comprising 1197 species and rice growth rates over 122 consecutive days. Application of EDM-based causality analysis identified 52 potentially influential organisms with lower-level taxonomic information [37] [9]. For experimental validation, two species were selected:
- Globisporangium nunn (an Oomycetes species) - identified as potentially influential
- Chironomus kiiensis (a midge species) - identified as potentially influential
The validation experiments employed manipulative field studies where G. nunn was added to and C. kiiensis was removed from artificial rice plots, with measurements of rice growth rate and gene expression patterns before and after manipulation [4] [9].
Table 2: Experimental Results of Species Manipulation on Rice Performance
| Experimental Condition | Effect on Rice Growth Rate | Effect on Gene Expression | Statistical Significance |
|---|---|---|---|
| G. nunn addition | Significant change | Altered expression patterns | Statistically clear effects |
| C. kiiensis removal | Less pronounced effect | Not explicitly reported | Effects relatively small |
| Control conditions | Baseline growth | Baseline expression | Reference for comparison |
The results provided empirical validation for the EDM-based causal inferences, with particularly clear effects observed for G. nunn manipulation. This demonstrated that integration of eDNA-based monitoring with nonlinear time series analysis could effectively detect previously overlooked influential organisms in agricultural systems [37].
EDM-Based Causal Inference Methodology
Theoretical Foundation for Causal Analysis
The causal inference approach in EDM is fundamentally different from traditional correlation-based methods. While correlations can indicate potential relationships, they frequently lead to spurious conclusions in nonlinear systems with feedback loops. EDM addresses this through state-space reconstruction and cross-mapping techniques that test the necessary conditions for causal relationships [35].
Diagram 2: Logical framework for causal inference in EDM using Convergent Cross Mapping. Causality is determined by testing whether the state-space reconstruction of one variable can predict another, with convergence as more data is included.
Enhanced Causal Detection with Modern EDM
Recent advances in EDM have improved causal detection capabilities:
- Multiview Distance Regularized S-Map: Enhances interaction strength quantification by incorporating multiple state-space perspectives with regularization to improve robustness [7]
- Vector Correlation Metrics: Provide more robust measurements of cross-mapping skill compared to traditional correlation coefficients, particularly for short time series [36]
- Unified Information-Theoretic Causality: Combines information theory with state-space reconstruction to detect both linear and nonlinear causal relationships [4]
In the rice paddy study, these advanced EDM techniques successfully identified specific causal relationships between microbial species and rice growth performance, subsequently validated through manipulative experiments [37] [9].
Research Toolkit for EDM in Ecological Studies
Essential Research Reagents and Materials
Table 3: Key Research Reagent Solutions for EDM-Based Ecological Studies
| Reagent/Material | Specification | Application in Research | Critical Functions |
|---|---|---|---|
| Universal PCR Primers | 16S rRNA, 18S rRNA, ITS, COI regions | eDNA metabarcoding | Amplification of taxonomic marker genes for prokaryotes, eukaryotes, fungi, and animals |
| Sterivex Filter Cartridges | φ 0.22-µm and φ 0.45-µm pore sizes | eDNA sampling from water | Capture of DNA from diverse microbial and macrobial organisms |
| Internal Spike-in DNAs | Known concentration of artificial DNA sequences | Quantitative eDNA analysis | Enable absolute quantification of eDNA concentrations; essential for time series analysis |
| RNA Extraction Kits | Plant tissue RNA isolation | Gene expression analysis | Isolate RNA for transcriptome analysis of plant responses to manipulations |
| Soil Growth Medium | Commercial soil standardized composition | Rice plot establishment | Provide consistent growth substrate across experimental replicates |
| Filiformine | Filiformine, MF:C19H13NO6, MW:351.3 g/mol | Chemical Reagent | Bench Chemicals |
| Sarcandrone A | Sarcandrone A, MF:C33H30O8, MW:554.6 g/mol | Chemical Reagent | Bench Chemicals |
Experimental Protocol Specifications
The rice paddy study implemented a rigorous protocol for data collection and analysis:
- Temporal Sampling Framework: Daily monitoring over 122 consecutive days during the growing season (May-September) to capture system dynamics at appropriate temporal resolution [37]
- Spatial Replication: Five independent rice plots (90 × 90 × 34.5 cm containers) with standardized soil, water, and planting conditions (16 Wagner pots per plot, three rice seedlings per pot) [9]
- eDNA Processing: Daily collection of 200ml water samples from each plot, filtration within 30 minutes of collection, DNA extraction, and quantitative metabarcoding using four universal primer sets [37] [9]
- Growth Measurements: Daily rice leaf height measurements of target individuals using standardized rulers, with growth rate calculated as cm/day [37]
Comparative Performance Against Alternative Methods
Advantages Over Traditional Statistical Approaches
EDM demonstrates several critical advantages for causal inference in complex ecological systems:
- State-Dependent Interactions: Unlike correlation coefficients or linear models that assume constant relationships, EDM through the S-Map algorithm can quantify how interaction strengths vary depending on system states [35]
- Robustness to Confounding: CCM tests for causality based on dynamical properties rather than correlation, reducing spurious findings from common drivers [35]
- Handling of Nonlinearity: EDM naturally accommodates threshold effects, regime shifts, and other nonlinear behaviors common in ecological systems [36]
In the mosquito abundance study, EDM methods successfully identified environmental drivers (temperature, rainfall, wind) and demonstrated superior forecasting performance compared to autoregressive models, particularly for nonlinear systems [36].
Integration with Modern Forecasting Approaches
Recent methodological developments show potential for combining EDM with other advanced forecasting techniques:
- Future-Guided Learning (FGL): An approach that uses a future-oriented "teacher" model to guide a past-oriented "student" model, demonstrating 23.4% MSE reduction in forecasting nonlinear dynamical systems [38]
- Hybrid Mechanistic-EDM Frameworks: Combining process-based models with EDM for improved forecasting and causal analysis, particularly valuable when partial mechanistic understanding exists [36]
While these integrated approaches show promise, EDM remains uniquely powerful for pure causal discovery in complex systems where mechanistic understanding is limited.
Empirical Dynamic Modeling provides a powerful framework for causal inference in nonlinear systems, with demonstrated applications from agricultural science to disease vector management. The integration of high-resolution eDNA monitoring with state-space reconstruction methods enables researchers to identify causal relationships in complex ecological systems that would remain hidden to traditional statistical approaches. The validation of EDM-derived causal hypotheses through manipulative experiments, as demonstrated in the rice paddy study, establishes a rigorous paradigm for moving from correlation to causation in observational studies. As methodological developments continue to enhance EDM's capabilities, particularly for handling short time series and quantifying interaction strengths, its utility across biological and agricultural research domains continues to expand.
In the quest for sustainable food production, agricultural science is increasingly looking beyond traditional plant breeding to harness the complex ecological communities that surround crops. Rice (Oryza sativa), a staple food for over 3.5 billion people, is typically grown under field conditions where it is influenced by numerous biological interactions that remain largely unexplored [4] [3]. While advanced breeding techniques offer promise for improving crop performance, the potential of ecological communities to establish environment-friendly agricultural systems has been underexplored due to methodological challenges in quantifying complex field interactions [9]. Traditional observation- and manipulation-based approaches have critical limitations in identifying multitaxa species and quantifying their interactions under field conditions [1].
This research presents a novel ecological-network-based approach that combines intensive field monitoring with advanced computational analysis to detect previously overlooked organisms influencing rice growth. The study framework addresses a significant gap in agricultural science by demonstrating how ecological complexity can be systematically measured and utilized for sustainable crop production [4]. By moving beyond simple correlation analyses to causal inference, this methodology provides researchers with a powerful toolkit for identifying keystone species within agricultural ecosystems, ultimately contributing to more sustainable and productive farming systems.
Research Framework and Experimental Design
Core Conceptual Workflow
The research methodology follows an integrated workflow from data collection to experimental validation, combining ecological monitoring, computational analysis, and field manipulation. The schematic below illustrates this comprehensive approach:
Experimental Setup and Monitoring Protocols
The research employed a rigorous dual-phase experimental design, with initial detection studies conducted in 2017 followed by validation experiments in 2019. The comprehensive monitoring protocol enabled unprecedented resolution of ecological dynamics in rice agricultural systems.
Table: Experimental Design and Monitoring Parameters
| Parameter | 2017 Detection Phase | 2019 Validation Phase |
|---|---|---|
| Location | Center for Ecological Research, Kyoto University, Japan | Same location as 2017 study |
| Monitoring Period | 122 consecutive days (23 May - 22 September) | Growing season (specific dates not provided) |
| Rice Plots | 5 artificial plots (90 × 90 × 34.5 cm containers) | Artificial rice plots |
| Rice Variety | Hinohikari | Likely Hinohikari (implied) |
| Growth Metrics | Daily growth rate (cm/day) via leaf height measurements | Growth rate and gene expression patterns |
| Community Monitoring | Daily water sampling for eDNA analysis | Targeted manipulation of specific organisms |
| Species Identified | 1,197 species across multiple taxonomic groups | Focus on two target species |
In the 2017 detection phase, researchers established five experimental rice plots using small plastic containers filled with commercial soil and sixteen Wagner pots [1]. Each pot contained three rice seedlings of the Hinohikari variety, monitored daily for growth rates through leaf height measurements. The extensive ecological monitoring employed quantitative environmental DNA (eDNA) metabarcoding, with daily water samples collected from all five plots [9]. This approach utilized four universal primer sets targeting 16S rRNA (prokaryotes), 18S rRNA (eukaryotes), ITS (fungi), and COI (animals) regions, enabling comprehensive species detection across taxonomic kingdoms [9].
The 2019 validation phase focused on experimental manipulation of two species identified as potentially influential in the initial study: the oomycete Globisporangium nunn and the midge Chironomus kiiensis [4]. These organisms were selected from the 52 potentially influential species identified through nonlinear time series analysis of the 2017 data. The validation experiments involved adding G. nunn and removing C. kiiensis from artificial rice plots, then measuring rice responses through both growth metrics and gene expression patterns [3]. This dual-phase approach allowed researchers to move beyond correlation to establish causal relationships between specific organisms and rice performance.
Analytical Approach: From Time Series to Ecological Networks
Network Inference Methodology
The research employed sophisticated nonlinear time series analysis to reconstruct ecological interaction networks from the extensive monitoring data. Unlike traditional correlation-based approaches, this method detects causal relationships within complex ecological systems, identifying direct and indirect influences on rice growth.
Table: Comparison of Network Analysis Methods in Microbial Ecology
| Method Type | Key Principle | Advantages | Limitations |
|---|---|---|---|
| Similarity-based Networks | Identifies species that co-occur or are mutually exclusive using correlation metrics | Simple implementation; detects pairwise relationships | Misses complex multi-species interactions; correlation ≠causation |
| Regression-based Networks | Models abundance of one species using combinations of other species | Captures complex, multi-species dependencies | Computationally intensive; still primarily correlational |
| Dynamic Networks (Used in Study) | Uses mathematical equations describing changes over time (e.g., generalized Lotka-Volterra) | Captures temporal dynamics and causal relationships; models nonlinear interactions | Requires frequent, quantitative time series data; complex implementation |
| IVI Algorithm | Integrates multiple centrality measures to identify key nodes | Addresses multi-dimensionality of networks; reduces positional bias | Recently developed; less widely adopted in ecological studies |
The nonlinear time series analysis employed in this research represents a significant advancement over traditional network inference methods [39]. By analyzing daily changes in species abundances and rice growth rates, the method can detect causal interactions in complex systems where multiple species influence each other through both direct and indirect pathways [4]. This approach is particularly valuable in agricultural systems where nonlinear dynamics predominate and simple correlation analyses often fail to identify biologically meaningful relationships [9].
The IVI Algorithm: A Novel Approach for Identifying Influential Nodes
The research utilized an advanced network analysis approach through the Integrated Value of Influence (IVI) algorithm, which synergistically combines multiple network centrality measures to accurately identify the most influential nodes within ecological networks [40]. The IVI algorithm integrates six crucial centrality measures, each capturing different aspects of network influence:
- Degree Centrality: Measures direct connections to other nodes
- ClusterRank: Accounts for local clustering while considering neighbor influence
- Local H Index: Assesses neighborhood connectivity without resolution limits
- Neighborhood Connectivity: Evaluates connectivity of a node's neighbors
- Betweenness Centrality: Quantifies control over information flow
- Collective Influence: Measures global impact through network percolation
Unlike methods that rely on single centrality measures, IVI overcomes inherent positional biases in network analysis [40]. For instance, nodes may exhibit high local centrality but low global centrality, or vice versa, depending on their network position. By integrating these diverse measures, IVI provides a more robust identification of truly influential species within rice agroecosystems, enabling researchers to prioritize organisms for experimental validation.
Key Findings: Validation of Influential Organisms
Experimental Validation of Network Predictions
The critical validation phase in 2019 confirmed the predictive power of the ecological network approach, demonstrating that species identified through computational analysis indeed influenced rice growth and physiology. The manipulation experiments focused on two species representing different taxonomic groups and potential ecological functions.
Table: Validation Results for Target Organisms
| Target Organism | Taxonomic Group | Manipulation | Effect on Rice Growth Rate | Effect on Gene Expression | Statistical Significance |
|---|---|---|---|---|---|
| Globisporangium nunn | Oomycete (syn. Pythium nunn) | Addition to plots | Changed | Changed | Statistically clear effects |
| Chironomus kiiensis | Insect (Midge) | Removal from plots | Limited effect | Not specified | Less pronounced than G. nunn |
The experimental results demonstrated that Globisporangium nunn, in particular, had statistically clear effects on rice performance, affecting both growth rates and gene expression patterns [3]. While the effects of the manipulations were relatively small, they provided crucial validation of the network-based predictions and demonstrated the potential for harnessing ecological interactions in agricultural management [4]. The stronger effect observed with G. nunn addition compared to C. kiiensis removal suggests that oomycetes may play particularly influential roles in rice agroecosystems, possibly through pathogenic or growth-promoting interactions that directly affect plant physiology.
Biological Significance of Validated Organisms
The two species selected for validation represent distinct ecological functional groups with potentially important roles in rice agroecosystems. Globisporangium nunn belongs to the Oomycota phylum, a group known to include significant plant pathogens [41]. Previous research has documented various Globisporangium species causing root rot and damping-off in multiple crop species, including rice [42] [41]. These oomycetes typically produce sporangia and zoospores that facilitate dispersal in aquatic environments, making them particularly suited to flooded rice paddies [43]. The confirmed influence of G. nunn on rice growth and gene expression underscores the importance of water molds in agricultural productivity, whether through pathogenic relationships or more complex ecological interactions.
Chironomus kiiensis, a midge species, represents a different type of ecological influence. As aquatic insects, chironomid larvae participate in nutrient cycling and potentially affect root zone oxygenation through their burrowing activities [4]. While the manipulation of C. kiiensis produced less pronounced effects than G. nunn in the validation experiments, its identification as a potentially influential organism suggests possible roles in modifying the rhizosphere environment or interacting with microbial communities adjacent to rice roots. The differential effects observed between these two species highlight the variety of mechanisms through which ecological community members can influence crop performance, from direct physiological interactions to more indirect ecosystem engineering.
Research Toolkit: Essential Methods and Reagents
Critical Research Reagents and Materials
The successful implementation of this ecological network approach relies on specialized reagents and materials that enable comprehensive community monitoring and analysis. The following table details essential research solutions utilized in the study:
Table: Essential Research Reagents and Materials
| Reagent/Material | Specification | Application | Function |
|---|---|---|---|
| Sterivex Filter Cartridges | Two pore sizes (0.22-µm and 0.45-µm) | eDNA collection from water samples | Capture DNA from microorganisms of different sizes |
| Universal Primer Sets | 16S rRNA, 18S rRNA, ITS, COI regions | eDNA metabarcoding | Amplify taxonomic-specific gene regions for community profiling |
| Internal Spike-in DNAs | Known concentration and sequence | Quantitative eDNA analysis | Enable absolute quantification of eDNA copies |
| NARF Medium | Selective isolation medium | Oomycete cultivation | Selective growth of oomycetes like Globisporangium |
| CMA Medium | Corn meal agar | Fungal and oomycete culture | Maintenance and morphological study of isolates |
| PCA Medium | Potato carrot agar | Temperature growth experiments | Determine optimal growth conditions for isolates |
| Conduritol A | Conduritol A, MF:C20H32O6, MW:368.5 g/mol | Chemical Reagent | Bench Chemicals |
| Rossicaside B | Rossicaside B, MF:C36H46O19, MW:782.7 g/mol | Chemical Reagent | Bench Chemicals |
The combination of these specialized reagents and standardized protocols enables researchers to bridge field ecology with molecular analysis, creating a robust pipeline for identifying ecologically significant organisms in agricultural systems [43] [1]. The use of internal spike-in DNAs for quantitative eDNA analysis is particularly crucial, as it transforms relative abundance data into absolute quantifications, enabling more accurate time series analysis and causal inference [9].
Experimental Workflow for Organism Validation
The validation of computationally identified organisms requires carefully controlled experimentation to establish causal effects on rice performance. The following diagram illustrates the key steps in this validation process:
The validation workflow employs a rigorous before-after-control-impact design that enables researchers to distinguish causal effects from correlational patterns [4]. This approach is essential for translating computational predictions into biologically verified interactions, moving beyond network inference to establish functional relationships between specific organisms and rice performance. The multi-level assessment of rice responses—from whole-plant growth metrics to molecular gene expression patterns—provides complementary evidence for ecological effects operating at different biological scales [3] [1].
This research presents a robust framework for detecting and validating ecologically influential organisms in agricultural systems, demonstrating that integration of intensive monitoring, nonlinear time series analysis, and experimental manipulation can identify previously overlooked species affecting crop performance. The study provides solid evidence that ecological network approaches have practical potential for sustainable agriculture, although the relatively small effect sizes observed in manipulation experiments indicate the need for further refinement [4] [3].
The successful identification and validation of 52 potentially influential organisms, including the confirmed effects of Globisporangium nunn on rice growth and gene expression, represents a significant advancement in agricultural ecology [9]. This approach enables researchers to move beyond traditional focus on pest species or known mutualists to consider the broader ecological community influencing crop productivity. Future research directions should include scaling this approach to larger agricultural landscapes, investigating interactive effects between multiple influential species, and exploring the molecular mechanisms through which identified organisms influence rice physiology.
For researchers in agricultural science and ecology, this methodology offers a powerful toolkit for uncovering complex biological interactions in crop systems. By combining ecological network theory with molecular analysis and experimental validation, this approach bridges the gap between community ecology and agricultural management, potentially leading to new strategies for harnessing ecological complexity to enhance sustainable food production.
Refining the Detection Pipeline: Overcoming Technical and Analytical Hurdles
Environmental DNA (eDNA) analysis has revolutionized ecological monitoring by enabling the detection of species from genetic material shed into the environment. The application of quantitative eDNA metabarcoding has brought a new dimension to this field, allowing researchers to not only document biodiversity but also to infer species abundances and ecological interactions. This approach was pivotal in a groundbreaking study that identified specific organisms, such as Globisporangium nunn and Chironomus kiiensis, influencing rice growth in paddy fields [4] [3] [9]. However, translating eDNA data into reliable, quantitative insights is fraught with challenges that span the entire workflow, from sample collection to DNA sequencing and data interpretation. This guide objectively compares the performance of various methodological approaches against these challenges, supported by experimental data from agricultural and other ecological research.
Technical Hurdles in Quantitative eDNA Workflows
The path to obtaining quantitative data from eDNA is a multi-stage process, with each step introducing potential biases and errors that can compromise the accuracy and reliability of the final results. The table below summarizes the major challenges encountered at each stage of the workflow.
Table 1: Key Challenges in Quantitative eDNA Analysis Across the Experimental Workflow
| Workflow Stage | Specific Challenge | Impact on Quantitative Analysis | Evidence from Experimental Data |
|---|---|---|---|
| Sampling | Representative capture of eDNA in heterogeneous environments [44]. | Inconsistent DNA yield leads to inaccurate community composition and abundance estimates. | In pond studies, eDNA distribution is patchy; single samples missed target species, requiring replicated sampling for reliable detection [44]. |
| Filtration & Capture | PCR inhibition from co-concentrated organic and inorganic compounds [44]. | Suppresses amplification, causing false negatives and skewing abundance ratios in community data. | Pond water with high humic acid content required dilution or inclusion of inhibition-resistant PCR additives to restore detection sensitivity [44]. |
| DNA Extraction | Variable lysis efficiency across taxa and differential recovery of extracellular DNA [45]. | Biases the apparent abundance of certain organisms (e.g., microbes vs. macrobes). | Studies show shedding rates vary by species, age, and stress levels, decoupling eDNA concentration from direct biomass [45]. |
| Library Prep & Sequencing | Amplification biases from primer mismatches and variable gene copy numbers [46]. | Distorts the relative proportion of taxa within a sample. | National airborne eDNA survey found different primer sets (12S vs. 16S) recovered distinct vertebrate species lists, necessitating multiple markers for comprehensive coverage [46]. |
| Data Normalization & Analysis | Lack of standardized internal standards and incomplete reference databases [47]. | Hampers cross-study comparisons and absolute quantification; limits species-level identification. | The slow adoption of eDNA by managers is partly due to a lack of trust in quantification and incomplete databases preventing precise species assignment [47]. |
Experimental Protocols for Validating eDNA Quantification
To address these challenges, rigorous experimental protocols are essential. The following methodology, derived from the rice paddy study that investigated the effects of Globisporangium nunn, provides a framework for generating and validating quantitative eDNA data.
Field Sampling and Quantitative eDNA Metabarcoding
Objective: To intensively monitor ecological community dynamics in rice paddy fields [4] [9].
- Site Establishment: Establish multiple replicate rice plots (e.g., 1m x 1m) under controlled or contrasting farming practices [9] [7].
- eDNA Collection: Collect water samples from each plot daily or at high frequency throughout the growing season. In the rice growth study, sampling was conducted daily for 122 consecutive days [3] [9].
- Quantitative Metabarcoding:
- Filtration: Filter water samples to capture eDNA.
- Spike-in Standards: Add known quantities of synthetic internal spike-in DNAs (e.g., from species not present in the environment) to each sample prior to DNA extraction. This step is critical for normalizing samples and moving from relative to absolute abundance estimates [9].
- DNA Extraction & Amplification: Extract total eDNA and amplify using multiple universal primer sets targeting key gene regions (e.g., 16S rRNA for prokaryotes, 18S rRNA for eukaryotes, ITS for fungi, and COI for animals) [4] [9].
- Sequencing: Perform high-throughput sequencing on the amplified libraries.
Causal Analysis Using Time-Series Data
Objective: To distinguish causal influencers from correlated species in the complex community [9].
- Data Processing: Convert sequencing reads into quantitative time-series data for each detected species (or Operational Taxonomic Unit, OTU) and for host physiological metrics (e.g., rice growth rate in cm/day) [4] [9].
- Nonlinear Time Series Analysis: Apply causal inference methods, such as convergent cross-mapping (CCM) or multiview distance regularized S-map, to the extensive time-series dataset. These methods can detect causal links even in nonlinear, complex systems [9] [7].
- Output: Generate a list of "potentially influential organisms" whose population dynamics show a statistically significant causal effect on the host's performance metrics [4]. In the rice study, this analysis identified 52 such organisms [3].
Field Validation through Manipulation Experiments
Objective: To empirically test the effects of candidate organisms identified by the time-series analysis [4] [9].
- Candidate Selection: Select one or more target species from the causal analysis list (e.g., Globisporangium nunn and Chironomus kiiensis).
- Plot Manipulation: Establish new experimental plots and manipulate the abundance of the target species:
- Response Measurement: Measure the response of the host (rice) in the manipulated plots versus control plots. Responses should include:
- Validation: Confirm a statistically significant change in the host's response following manipulation, thereby validating the causal relationship predicted by the eDNA time-series analysis [9].
Figure 1: Integrated workflow for identifying and validating ecologically influential organisms using quantitative eDNA analysis.
The Scientist's Toolkit: Essential Reagents and Materials
Successful implementation of a quantitative eDNA study requires careful selection of reagents and materials. The following table details key solutions used in the featured research and the broader field.
Table 2: Essential Research Reagent Solutions for Quantitative eDNA Analysis
| Reagent/Material | Function in Workflow | Key Considerations for Quantification |
|---|---|---|
| Internal Spike-in DNAs | Synthetic DNA sequences added to samples pre-extraction to normalize for technical variation across extraction, amplification, and sequencing [9]. | Essential for converting read counts into absolute concentrations; must be phylogenetically similar to target DNA but absent from the study environment. |
| Universal Primer Sets | PCR primers that bind to conserved regions of key gene markers (16S, 18S, ITS, COI) to amplify a broad range of taxa [4] [9]. | Choice of primer set introduces bias; multi-marker approaches, as used in the rice study, provide more comprehensive community coverage [46]. |
| Inhibition-Resistant PCR Mixes | Specialized polymerase and buffer systems designed to tolerate common environmental inhibitors (e.g., humics, tannins) [44]. | Critical for ensuring uniform amplification efficiency across all samples, especially from complex matrices like soil or pond water. |
| High-Sensitivity DNA Assay Kits | Fluorometric or colorimetric assays (e.g., Qubit, Picogreen) for precise quantification of DNA concentration before library prep [44]. | More accurate than spectrophotometric methods (NanoDrop) which are sensitive to contaminants; ensures standardized input DNA. |
| Negative Controls | Nuclease-free water processed alongside field samples through the entire workflow [44]. | Allows for detection and filtering of laboratory or reagent contamination, which is a major source of false positives. |
| Herqueilenone A | Herqueilenone A, MF:C30H31NO11, MW:581.6 g/mol | Chemical Reagent |
| Thr101 | Thr101, MF:C14H10FNOS, MW:259.30 g/mol | Chemical Reagent |
Quantitative eDNA analysis represents a powerful frontier in molecular ecology, as demonstrated by its successful application in identifying key organisms like Globisporangium nunn that influence rice growth. However, this power is tempered by significant technical challenges from sampling through sequencing. Biases introduced at any step can compromise the accuracy of abundance estimates and subsequent ecological inferences. The integration of rigorous protocols—such as using internal standards, applying causal inference to time-series data, and validating predictions with manipulative experiments—provides a robust framework to overcome these hurdles. As reagent solutions and analytical methods continue to mature, the capacity of quantitative eDNA to unravel complex species interactions and drive data-driven ecosystem management will become increasingly precise and reliable.
Ensuring Causality Over Correlation in Complex, Noisy Field Data
Establishing causality rather than mere correlation represents one of the most significant challenges in biological field research. While controlled laboratory experiments can isolate variables effectively, field conditions introduce immense complexity with numerous interacting factors, creating noisy datasets where causal relationships are obscured. This challenge is particularly acute in agricultural and environmental sciences, where researchers must contend with dynamic ecological communities, fluctuating environmental conditions, and intricate biological networks. The problem extends beyond academic interest—misattributing correlation as causation can lead to ineffective interventions, wasted resources, and flawed policy decisions.
In this comparative guide, we examine methodological approaches for causal inference, focusing specifically on research investigating the effects of Globisporangium nunn manipulation on rice growth. Through this case study, we evaluate how different strategies address the fundamental challenge of distinguishing true causal relationships from spurious correlations in complex field environments, providing researchers with practical frameworks for strengthening causal claims in their own investigations.
Methodological Comparison: Approaches to Causal Inference
Convergent Cross Mapping (CCM) in Ecological Networks
The application of Convergent Cross Mapping (CCM) represents a significant advancement in detecting causal relationships in complex ecological systems. This method, based on state-space reconstruction principles, leverages naturally occurring time-series data to identify causal links without requiring experimental manipulations. In the rice paddy ecosystem studies, researchers employed CCM to analyze relationships between rice growth and hundreds of species detected through environmental DNA (eDNA) monitoring [7] [1].
The CCM approach operates on the principle that if variable X causally influences variable Y, then information about X is encoded in the dynamics of Y. By examining how well historical values of Y can predict current values of X, researchers can infer causal directionality. This method is particularly valuable in field settings where controlled manipulations are impractical or ethically problematic. In the G. nunn research, CCM analysis of daily time-series data identified 52 potentially influential organisms from over 1,000 species detected, with the oomycete G. nunn emerging as a statistically significant causal factor in rice growth dynamics [1] [3].
A key strength of CCM is its ability to handle nonlinear dynamics and feedback loops common in biological systems. Traditional correlation-based methods often fail in these scenarios, potentially identifying spurious relationships or missing genuine causal connections. CCM also functions with relatively short time series, making it practical for field studies where long-term data collection may be constrained by logistical or funding limitations [7].
Interventional Frameworks and INSPRE Algorithm
In contrast to observational methods like CCM, interventional approaches actively perturb systems to establish causality. The recently developed INSPRE (inverse sparse regression) algorithm represents a cutting-edge example of this paradigm, specifically designed to leverage large-scale intervention data for causal network reconstruction [48].
INSPRE treats intervention instruments (such as guide RNAs in CRISPR experiments) as instrumental variables to estimate marginal average causal effects. The algorithm then solves a constrained optimization problem to infer the underlying causal graph structure. This method demonstrates particular strength in scenarios with unobserved confounding and cyclic relationships, which are common challenges in field biology [48].
Comparative simulations have revealed INSPRE's superior performance in both cyclic and acyclic graphs with confounding, outperforming other causal discovery methods including GIES, igsp, and dotears. The algorithm maintains high precision and computational efficiency even with hundreds of nodes, completing analyses in seconds where comparable methods require hours [48]. This speed advantage makes it particularly valuable for field researchers working with large multivariate datasets.
Traditional Manipulative Experiments
Despite advances in computational methods, traditional manipulative experiments remain the gold standard for establishing causality in biological research. The G. nunn case study exemplifies this approach, where researchers conducted field manipulations in 2019 to validate predictions generated from earlier observational data [1] [3].
In these experiments, researchers established artificial rice plots and directly manipulated the abundance of G. nunn (adding the oomycete) and Chironomus kiiensis (removing the midge larvae). They then measured rice growth rates and gene expression patterns before and after manipulation, creating a clear temporal sequence that supports causal interpretation [3]. This direct intervention approach provides the strongest evidence for causality, as it actively tests hypotheses generated through observational methods.
However, manipulative experiments face significant challenges in field settings, including uncontrolled environmental variables, implementation difficulties, and ethical concerns. In the G. nunn validation experiment, reviewers noted that researchers did not fully track the fate of introduced species, creating uncertainty about the mechanisms underlying observed effects [49]. This limitation highlights the practical constraints that often compromise even well-designed field manipulations.
Table 1: Comparison of Causal Inference Methods in Biological Field Research
| Method | Key Principles | Strength | Limitations | Ideal Use Cases |
|---|---|---|---|---|
| Convergent Cross Mapping | State-space reconstruction; nonlinear dynamics | Works with observational data; handles feedback loops | Requires quality time-series data; complex implementation | Exploratory analysis of ecological monitoring data |
| INSPRE Algorithm | Instrumental variables; sparse regression | Robust to confounding; handles cycles; computationally efficient | Requires intervention data; performance depends on effect sizes | Genetic networks; systems with natural or designed interventions |
| Manipulative Experiments | Direct intervention; controlled comparison | Strongest causal evidence; conceptually straightforward | Implementation challenges; ethical concerns; cost | Hypothesis testing; validation of observational findings |
Experimental Protocols: Methodologies for Establishing Causality
Intensive Field Monitoring Protocol
The foundation for robust causal inference in field research begins with comprehensive data collection. In the rice paddy studies, researchers implemented an intensive monitoring protocol spanning 122 consecutive days during the growing season [1] [3]. This protocol included:
Daily environmental DNA sampling: Researchers collected approximately 200ml of water daily from five rice plots, immediately filtering it through 0.22-µm and 0.45-µm Sterivex filter cartridges. This process yielded 1,220 water samples plus negative controls, which were subsequently analyzed using quantitative eDNA metabarcoding [1].
Rice growth measurements: Researchers measured rice leaf height daily using standardized rulers, focusing on target individuals across the experimental plots. This generated high-resolution growth rate data (cm/day) that captured subtle temporal variations [3].
Environmental monitoring: Continuous measurement of temperature, light intensity, and humidity at each rice plot provided crucial contextual data for interpreting biological patterns [1].
Gene expression analysis: RNA sequencing from rice plants at multiple time points enabled researchers to connect ecological dynamics with molecular responses [3].
This intensive monitoring protocol generated multivariate time-series data encompassing 1,197 species, creating a rich dataset for subsequent causal analysis. The daily sampling frequency was critical for capturing the rapid dynamics of ecological communities, while quantitative eDNA methods provided more comprehensive biodiversity assessment than traditional visual surveys [7].
Causal Validation Experiment Design
To validate causal relationships identified through time-series analysis, researchers implemented a manipulative experiment with the following protocol [1] [3]:
Experimental setup: Establishment of artificial rice plots using standardized containers (90 × 90 × 34.5 cm) with commercial soil. Sixteen Wagner pots per plot were planted with three rice seedlings (variety Hinohikari) each, creating controlled but field-realistic conditions.
Species manipulation:
- G. nunn addition: Introduction of cultured G. nunn at concentrations based on natural abundance observed in prior monitoring.
- C. kiiensis removal: Manual extraction of midge larvae using hand nets throughout the experiment.
Response measurement:
- Rice growth rate: Continued daily height measurements following the same protocol as observational monitoring.
- Gene expression: RNA sequencing of rice plants before and after manipulation to identify transcriptomic changes.
- eDNA monitoring: Continued daily water sampling to track community-wide responses to manipulations.
This validation protocol exemplifies how hypothesis-driven interventions can test causal predictions generated from observational data. However, peer reviewers noted methodological limitations, including incomplete tracking of introduced G. nunn populations and potentially inefficient C. kiiensis removal [49]. These limitations highlight the practical challenges of implementing clean manipulations in complex field settings.
Signaling Pathways and Biological Mechanisms
The causal relationship between G. nunn and rice growth involves complex molecular interactions that translate ecological encounters into plant physiological responses. While the exact mechanisms remain partially characterized, transcriptomic analyses revealed that G. nunn manipulation significantly altered rice gene expression patterns [3].
Graphviz Diagram: Proposed Signaling Pathway in G. nunn-Rice Interaction
Diagram 1: Proposed signaling pathway for G. nunn-rice interaction. The oomycete likely releases MAMPs that are detected by plant PRRs, initiating signaling cascades that ultimately modify growth patterns.
The molecular dialogue between rice plants and G. nunn appears to involve recognition of microbe-associated molecular patterns (MAMPs) by plant pattern recognition receptors (PRRs), triggering downstream signaling events. These include calcium signaling, reactive oxygen species (ROS) production, and MAPK cascade activation, ultimately leading to phytohormone signaling adjustments [3]. The observed transcriptomic changes suggest involvement of jasmonic acid (JA), salicylic acid (SA), and ethylene (ET) signaling pathways, which collectively recalibrate the balance between growth and defense investments.
This physiological reprogramming represents a classic growth-defense tradeoff, where plants reassign resources based on perceived environmental threats and opportunities. The net effect on growth rate depends on the specific signaling parameters and resource allocation patterns, which can vary based on microbial identity, concentration, and environmental context. The G. nunn case illustrates how seemingly minor components of ecological communities can influence crop performance through sophisticated molecular mechanisms.
Research Reagent Solutions Toolkit
Table 2: Essential Research Reagents and Platforms for Causal Inference in Field Biology
| Reagent/Platform | Function | Application in G. nunn Study |
|---|---|---|
| Quantitative eDNA Metabarcoding | Comprehensive species detection from environmental samples | Monitored 1,197 species dynamics in rice plots; identified candidate causal organisms [1] |
| Spike-in DNA Standards | Internal controls for quantitative eDNA analysis | Enabled accurate quantification of species abundance in time-series data [3] |
| High-Throughput Sequencing | Transcriptome profiling | Identified gene expression changes in response to G. nunn manipulation [3] |
| Nonlinear Time Series Analysis | Causal inference from observational data | Detected 52 potentially influential species from multivariate time series [1] |
| INSPRE Algorithm | Causal network reconstruction from interventional data | Provided comparative framework for validating causal inference methods [48] |
Comparative Performance Assessment
Empirical Validation Results
The ultimate test of any causal inference method lies in its predictive validity—the ability to identify relationships that withstand experimental testing. In the G. nunn research, the CCM approach successfully identified two species (G. nunn and C. kiiensis) that subsequently showed measurable effects in manipulation experiments [3].
For G. nunn specifically, addition experiments confirmed statistically significant effects on rice growth rates and gene expression patterns. The effect size was relatively small but detectable, demonstrating that the CCM method can identify biologically relevant causal relationships even when those relationships are modest in magnitude [3] [49]. This is particularly impressive given that G. nunn was just one of 1,197 species monitored, highlighting the method's value for prioritizing candidates for further investigation.
The C. kiiensis manipulation produced less clear results, with reviewers noting that the removal method may have been insufficient to fully test its effects [49]. This outcome illustrates how methodological limitations in validation experiments can complicate assessment of causal inference methods, as false negatives may reflect validation problems rather than flawed causal identification.
Methodological Tradeoffs and Complementary Applications
Each causal inference approach entails distinct tradeoffs that make them suitable for different research scenarios:
CCM excels in exploratory phases where researchers seek to identify potential causal factors from complex observational data. Its requirement for high-frequency time-series data makes it resource-intensive but invaluable for generating hypotheses worth testing through manipulation [7] [1].
INSPRE offers robust performance with interventional data and handles confounding effectively, but requires intervention instruments that may not be available in all field contexts. Its computational efficiency makes it ideal for large datasets [48].
Traditional manipulations provide the strongest causal evidence but are often limited in scale and scope. They serve best as validation tools for specific hypotheses rather than discovery tools for identifying causal factors [3] [49].
The most robust research programs strategically combine these approaches, using observational methods to generate hypotheses and interventional methods to test them. This sequential approach leverages the respective strengths of each method while mitigating their individual limitations.
Establishing causality in complex, noisy field data remains challenging but increasingly feasible through integrated methodological approaches. The G. nunn case study demonstrates how comprehensive monitoring, advanced time-series analysis, and targeted validation can collectively build compelling cases for causal relationships even in highly complex systems.
The most effective research strategies will combine: (1) high-resolution data collection using tools like quantitative eDNA metabarcoding; (2) multiple causal inference methods applied to the same system to triangulate evidence; and (3) focused manipulations to test specific causal hypotheses. This integrated approach moves beyond traditional correlation-based ecology toward a more predictive science capable of identifying key leverage points in complex biological systems.
As causal inference methods continue advancing, particularly through algorithms like INSPRE that efficiently handle real-world complexities like confounding and cyclic relationships, field researchers will gain increasingly powerful tools for distinguishing true causal relationships from mere correlations. These developments promise not only theoretical advances but more effective interventions in agriculture, conservation, and ecosystem management.
Validating the influence of specific organisms on crop growth in field conditions requires a robust methodological framework that moves beyond correlation to establish causation. This is particularly critical for organisms like Globisporangium nunn, where understanding its functional role can inform sustainable agricultural practices. Traditional observational approaches often fall short in deciphering the complex, nonlinear interactions within agricultural ecosystems [3]. This guide compares the performance of an ecological-network-based approach that integrates advanced monitoring technologies and nonlinear time series analysis against more traditional methods for designing and optimizing field validation experiments [1] [3].
The core challenge lies in the dynamic nature of paddy field ecosystems, which host over 1,000 species exhibiting complex state-dependent interactions [1] [3]. This complexity obfuscates the effects of individual organisms like G. nunn on rice growth performance and gene expression patterns. The framework presented here provides a comparative analysis of methodological approaches for quantifying these interactions and their outcomes, offering researchers a structured pathway for experimental optimization.
Experimental Protocols: Methodological Comparison
Ecological-Network-Based Approach
The most detailed protocol for G. nunn validation emerges from Japanese research institutions that established a comprehensive multi-year study. This approach employs intensive monitoring coupled with manipulative experiments to establish causal relationships [1] [3].
Core Workflow:
- Intensive Monitoring Phase (Year 1): Establish small experimental rice plots (e.g., 90 × 90 × 34.5 cm containers with Wagner pots). Monitor rice growth rates (cm/day measured daily with a ruler) and concurrently track ecological communities through daily water sampling for quantitative eDNA metabarcoding over 122 consecutive days [1] [3].
- Causal Analysis Phase: Apply nonlinear time series analysis (e.g., multiview distance regularized S-map) to the high-dimensional dataset (containing >1,000 species) to reconstruct interaction networks and identify potentially influential organisms, resulting in a shortlist of candidate species [7] [3].
- Manipulative Validation Phase (Subsequent Year): Focus on candidate species like G. nunn and Chironomus kiiensis. In artificial rice plots, implement abundance manipulations—adding G. nunn and removing C. kiiensis—while measuring rice responses including growth rate and transcriptome dynamics (gene expression patterns) before and after manipulation [1] [3].
This protocol's key advantage is its systematic identification of manipulation targets from complex field data before embarking on resource-intensive experiments [3].
Conventional Agronomic Trial Approach
Traditional approaches, as reflected in extension service recommendations, often rely on different methodological priorities:
Core Workflow:
- Background Data Collection: Depend on field history, cultivar disease ratings, and environmental condition monitoring rather than comprehensive community sampling [50].
- Scouting and Thresholds: Implement weekly scouting for visual symptoms (e.g., for sheath blight, application thresholds are based on percent positive stops: 35% for susceptible, 50% for moderately susceptible cultivars) [50].
- Intervention Timing: Base interventions on growth stages rather than causal networks—for diseases like blast, critical application timing occurs "around heading" to prevent neck and panicle blast, or between "early and late boot" for Cercospora [50].
This approach focuses on managing known pathogens rather than discovering or validating new biotic interactions.
Comparative Analysis of Experimental Setups
Table 1: Comparison of Key Experimental Parameters Between Research Approaches
| Experimental Parameter | Ecological-Network-Based Approach | Conventional Agronomic Approach |
|---|---|---|
| Community Assessment | Quantitative eDNA metabarcoding (>1,000 species) [1] [3] | Visual scouting (focused on known pests/pathogens) [50] |
| Monitoring Frequency | Daily (122 consecutive days) [3] | Weekly (from mid-tillering until heading) [50] |
| Causal Inference Method | Nonlinear time series analysis [7] [3] | Correlation with environmental conditions/field history [50] |
| Key Outcome Variables | Rice growth rate & gene expression patterns [1] [3] | Yield & visual disease symptoms [50] |
| Validation Method | Targeted species manipulation experiments [3] | Fungicide efficacy trials [50] |
Quantitative Data Synthesis
Organism Manipulation Outcomes
The ecological-network approach yielded specific, experimentally validated outcomes for G. nunn:
Table 2: Quantitative Results from Organism Manipulation Experiments
| Organism Manipulated | Type of Manipulation | Observed Effect on Rice | Magnitude of Effect |
|---|---|---|---|
| Globisporangium nunn (Oomycetes) | Addition to rice plots [3] | Changed growth rate and gene expression patterns [1] [3] | Statistically clear but relatively small effects [3] |
| Chironomus kiiensis (midge) | Removal from rice plots [1] | Altered rice growth performance [1] | Effects less pronounced than G. nunn [3] |
Comparative Farming System Data
Research comparing conventional and no-fertilizer paddy fields provides context for expected yield impacts:
Table 3: Yield Comparison Under Different Management Practices
| Farming Practice | Fertilizer/Pesticide Use | Relative Yield Performance | Research Context |
|---|---|---|---|
| No-Fertilizer Practice | No fertilizers or pesticides since 1951 [7] | 70-80% of conventional yields [7] | Kyoto, Japan (long-term adaptation) |
| No-Fertilizer Practice | No fertilizer inputs [7] | 40-50% of conventional yields [7] | Different field in same Kyoto study |
Visualization of Experimental Workflows
Ecological-Network-Based Validation Pipeline
The following diagram illustrates the integrated workflow for identifying and validating influential organisms:
Comparative Methodological Pathways
This diagram contrasts the two fundamental approaches to field experimentation:
The Scientist's Toolkit: Research Reagent Solutions
Table 4: Essential Research Materials and Their Functions
| Research Reagent/Tool | Primary Function | Application Context |
|---|---|---|
| Quantitative eDNA Metabarcoding | Comprehensive species detection from environmental samples using internal spike-in DNAs for quantification [1] [3] | Community monitoring (>1,000 species) in rice plots [3] |
| Sterivex Filter Cartridges (0.22-µm & 0.45-µm) | Sequential filtration of water samples for eDNA capture [1] | Daily water sampling from experimental rice plots [1] |
| Nonlinear Time Series Analysis | Detect causal interactions from complex multivariate data [7] [3] | Identify influential organisms from 1197-species dataset [3] |
| Multiview Distance Regularized S-map | Quantify interaction strengths in complex systems [7] | More accurate quantification of ecological interactions [7] |
| RNA Expression Analysis | Measure transcriptome dynamics (gene expression patterns) [1] | Assess rice physiological response to organism manipulation [1] [3] |
| Wagner Pots | Standardized plant growth containers [1] | Maintain consistent soil volume and plant density [1] |
The ecological-network approach demonstrates distinct advantages for discovery-oriented validation research, particularly for previously overlooked organisms like Globisporangium nunn. Its capacity to systematically identify manipulation targets from complex field data represents a significant advancement over conventional methods [3]. However, researchers must consider that effect sizes from manipulating individual species may be relatively small, as evidenced by the G. nunn validation where effects were statistically clear but modest in magnitude [3].
For research prioritizing known pathogen management, conventional protocols offer established, practical frameworks. For investigations aiming to uncover novel biotic interactions or harness ecological complexity for sustainable agriculture, the integrated framework of intensive eDNA monitoring and nonlinear time series analysis provides a more powerful methodology for optimizing dosage and timing in field validation experiments [1] [3].
In scientific research, particularly in fields like agriculture and drug development, determining whether a result is "significant" involves more than just a p-value. While statistical significance (often defined as p < 0.05) tells us that an observed effect is unlikely due to chance alone, it does not reveal the magnitude or practical importance of that effect [51]. This is where effect size becomes critical. Effect size is a quantitative measure that describes the magnitude of the difference between groups or the strength of a relationship, providing insight into the practical significance of a research finding [52]. A large effect size indicates that a finding has substantial real-world applications, whereas a small effect size suggests more limited practical importance, even if the result is statistically significant [52].
The distinction is crucial because statistical significance is heavily influenced by sample size. With very large samples, even minuscule differences that have no practical relevance can achieve statistical significance [51]. Conversely, in studies with insufficient sample sizes, potentially important effects might be dismissed as non-significant simply because the study lacked adequate statistical power to detect them [53]. For researchers validating the effects of interventions like Globisporangium nunn manipulation on rice growth, understanding and correctly interpreting effect size is essential for drawing meaningful conclusions that bridge the gap between statistical findings and their real-world applications.
Effect Size Fundamentals and Calculation
Key Effect Size Measures
Researchers commonly use several standardized measures to quantify effect size, with Cohen's d and Pearson's r being among the most prevalent [52]. Cohen's d is particularly useful for comparing differences between two groups, while Pearson's r measures the strength of association between two continuous variables.
Cohen's d: This metric expresses the difference between two group means in terms of standard deviation units. It is calculated using the formula:
d = (meanâ‚ - meanâ‚‚) / standard deviation
The denominator typically uses a pooled standard deviation from both groups [52]. This standardization allows for comparison across studies that may have used different measurement scales.
Pearson's r: This correlation coefficient measures the strength and direction of a linear relationship between two variables, ranging from -1 (perfect negative correlation) to +1 (perfect positive correlation) [52]. The closer the value is to ±1, the stronger the relationship.
Interpreting Effect Size Magnitude
Jacob Cohen, a pioneer in statistical power analysis, proposed conventional benchmarks for interpreting the magnitude of effect sizes [51]. These benchmarks provide a common language for discussing practical significance across research domains.
Table 1: Cohen's Criteria for Interpreting Effect Size Magnitude
| Effect Size | Cohen's d | Pearson's r | Practical Example |
|---|---|---|---|
| Small | 0.2 | ±0.1 to ±0.3 | Height difference between 15- and 16-year-old girls [54] |
| Medium | 0.5 | ±0.3 to ±0.5 | Height difference between 14- and 18-year-old girls [54] |
| Large | 0.8 or greater | ±0.5 or greater | Height difference between 13- and 18-year-old girls [54] |
It is important to note that these are general guidelines, and the interpretation of what constitutes a meaningful effect size should be informed by context and field-specific standards [52]. An effect considered small in one research domain might be considered highly meaningful in another, depending on the potential consequences or applications of the finding.
Case Study:Globisporangium nunnand Rice Growth
A compelling example of interpreting small but significant effects comes from agricultural research investigating the influence of ecological organisms on rice growth. A 2023 study employed an ecological-network-based approach to detect organisms potentially influencing rice performance under field conditions [3]. The research involved intensive monitoring of rice plots and ecological communities using quantitative environmental DNA (eDNA) metabarcoding, followed by manipulative experiments to validate causal relationships [3] [4].
Table 2: Key Research Reagent Solutions and Methodologies
| Research Reagent/Method | Function in the Experiment |
|---|---|
| Quantitative eDNA Metabarcoding | Comprehensive monitoring of ecological community dynamics (over 1000 species) by amplifying and sequencing DNA from environmental samples [3]. |
| Nonlinear Time Series Analysis | Reconstruction of complex interaction networks to detect causality and identify potentially influential organisms from time-series data [3]. |
| Field Manipulation Experiments | Empirical validation of predicted causal relationships by directly manipulating organism abundance (adding G. nunn or removing C. kiiensis) [3] [4]. |
| RNA Expression Analysis | Measurement of changes in gene expression patterns in rice plants in response to experimental manipulations, providing mechanistic insights [3]. |
The following diagram illustrates the integrated workflow that combined advanced monitoring and statistical techniques with traditional manipulative experiments:
Interpreting Small but Significant Effects
The study successfully identified that manipulation of Globisporangium nunn, an oomycete species, resulted in statistically significant changes in rice growth rates and gene expression patterns [3] [4]. However, the authors explicitly noted that "the effects of the manipulations were relatively small" [3]. This honest assessment is crucial for accurate interpretation.
In this context, the small effect size does not invalidate the finding but provides essential nuance. It suggests that while G. nunn does play a measurable role in rice growth, its individual impact might be limited within the complex ecological network of a rice field. This interpretation aligns with ecological theory, where multiple species interactions collectively influence ecosystem functioning, with each species contributing modestly to the overall outcome.
For agricultural applications, a small effect size from a single organism might still hold practical value if the intervention is low-cost, easily scalable, or can be combined with other approaches for cumulative benefits. The research framework demonstrates how detecting these subtle but real effects can reveal previously overlooked relationships in complex systems [3].
Implications for Research Practice
Planning and Power Analysis
Effect size consideration is not merely a post-hoc analysis activity but should be integrated at the research planning stage. Conducting an a priori power analysis requires researchers to specify the minimum effect size they consider biologically or clinically meaningful [51]. This practice ensures that studies are designed with adequate sample sizes to detect the effects of interest without wasting resources.
As noted in statistical literature, "The primary product of a research inquiry is one or more measures of effect size, not P values" [51]. This perspective shift emphasizes the importance of estimating effect sizes from pilot studies, previous literature, or theoretical considerations before embarking on large-scale investigations.
Reporting and Interpretation Standards
Complete reporting of effect sizes with confidence intervals provides readers with both the estimated magnitude and precision of an effect [51]. This practice is now required by many professional journals and associations, including the American Psychological Association [52].
When interpreting results with small effect sizes, researchers should consider:
- Practical context: Would implementing this finding, even with a small effect, lead to meaningful outcomes given the context (e.g., drug development, crop improvement)?
- Cumulative impact: Could small effects from multiple interventions combine to create substantial overall benefits?
- Mechanistic insight: Even small effects can provide valuable clues about underlying biological processes worth further investigation.
The integration of effect size interpretation with statistical significance provides a more complete picture of research findings, enabling scientists in fields from agriculture to drug development to make more informed decisions about which results warrant further investigation and potential application.
Scalability and Adaptation of the Framework for Different Crops and Environments
The challenge of achieving sustainable food production while reducing environmental impacts represents a central concern in modern agricultural science [1]. While advanced breeding techniques offer promising avenues for crop improvement, a significant knowledge gap remains regarding how crops are influenced by the complex ecological communities that surround them under real field conditions [3]. Most farming practices are conducted by subtracting or adding organisms based on human intention, but in natural settings, crops interact with numerous biological entities whose effects remain largely unknown [49]. The recent development of an ecological-network-based approach to detect influential organisms for rice growth provides a transformative framework that can be harnessed and adapted across different crops and environments [9]. This framework, which integrates intensive field monitoring with nonlinear time series analysis, demonstrates how ecological complexity can be actively utilized in agriculture rather than merely suppressed [1].
The original research, conducted with rice (Oryza sativa) as a model system, established a groundbreaking methodology that bridges molecular biology, ecology, and agriculture [9]. By combining quantitative environmental DNA (eDNA) metabarcoding with manipulative experiments, the researchers identified and validated specific organisms, including the oomycete Globisporangium nunn, that significantly influence rice growth rates and gene expression patterns [3]. This approach moves beyond traditional agricultural research by embracing rather than simplifying ecological complexity, offering a powerful template for investigating crop performance across diverse agricultural systems. The scalability of this framework to other crops and environments represents the next frontier in developing more sustainable, ecologically-informed agricultural practices that can potentially reduce reliance on chemical inputs while enhancing productivity [1].
Original Research Framework: Rice as a Model System
Experimental Design and Monitoring Protocol
The original research established a comprehensive framework for detecting ecologically influential organisms using rice as a model system [1]. The experimental design involved establishing small artificial rice plots in experimental fields in Japan, where rice growth and ecological communities were monitored intensively over 122 consecutive days [9]. The methodology incorporated several innovative approaches that enabled the detection of previously overlooked organisms affecting rice performance:
- High-frequency monitoring: Daily measurements of rice leaf height to calculate growth rates (cm/day) and daily collection of water samples for eDNA analysis [1]
- Quantitative eDNA metabarcoding: Comprehensive community analysis using four universal primer sets (16S rRNA, 18S rRNA, ITS, and COI regions) targeting prokaryotes, eukaryotes, fungi, and animals respectively [9]
- Nonlinear time series analysis: Application of advanced statistical tools to reconstruct complex interaction networks and detect causality between ecological variables [3]
This intensive monitoring approach detected more than 1,000 species in the rice plots, from which nonlinear time series analysis identified 52 potentially influential organisms with lower-level taxonomic information [3]. The scale of data collection was substantial, generating 1,220 water samples (122 days × 2 filter types × 5 plots) in addition to negative controls, providing an unprecedented resolution of ecological dynamics in an agricultural system [1].
Key Findings and Validation
The analytical phase of the research employed nonlinear time series analysis to process the extensive datasets containing 1,197 species and rice growth rates [9]. This approach generated a list of 52 potentially influential species, which subsequently underwent empirical validation through manipulative field experiments in 2019 [3]. The validation focused specifically on two species identified as potentially influential: the oomycete Globisporangium nunn (syn. Pythium nunn) and the midge Chironomus kiiensis [4].
Table 1: Organisms Validated in Original Rice Study and Their Effects
| Organism | Type | Manipulation | Effect on Rice Growth Rate | Effect on Gene Expression |
|---|---|---|---|---|
| Globisporangium nunn | Oomycete | Added to plots | Statistically significant changes | Clear changes in expression patterns |
| Chironomus kiiensis | Midge (Insect) | Removed from plots | Changes observed | Unclear effects |
The validation experiments confirmed that G. nunn specifically induced statistically clear effects on rice performance, altering both growth rates and gene expression patterns [3]. Although the effects of the manipulations were relatively small, the research successfully demonstrated a proof-of-concept framework for harnessing ecological complexity in agricultural systems [9]. The study provided solid evidence that integration of eDNA-based monitoring with time series analysis can effectively detect previously overlooked influential organisms in agricultural systems [3].
Scalability Assessment: Comparative Analysis Across Crops
Evidence from Other Crop Systems
The ecological network approach pioneered in rice systems demonstrates significant potential for adaptation to other agricultural contexts, with evidence emerging from research on various crops. The fundamental components of the framework—comprehensive community monitoring via eDNA, causal inference through time-series analysis, and validation through manipulative experiments—represent transferable methodologies that can be applied across cropping systems with appropriate modifications:
Table 2: Framework Application Potential Across Different Cropping Systems
| Crop System | Monitoring Approach | Key Taxa Identified | Management Implications |
|---|---|---|---|
| Rice [9] | Daily eDNA metabarcoding (aquatic) | Globisporangium nunn, Chironomus kiiensis | Potential growth manipulation via specific organism management |
| Soybean, Corn, Wheat [12] | Post-harvest soil eDNA metabarcoding | Globisporangium spp. (85.1%), Pythium spp. (10.4%) | Tillage and rotation regimes reshape oomycete communities |
| Holm Oak [22] | Soil baiting, culturing, molecular analysis | Globisporangium glomeratum | First report as pathogen of Quercus ilex, phytosanitary monitoring critical |
| Cucumber [18] | Aquatic sampling, multigene phylogeny | Novel Globisporangium species (parvizense, sarabense) | Pathogenicity confirmed on cucumber seedlings |
Research in soybean, corn, and wheat production systems has demonstrated how agricultural management practices significantly influence oomycete communities, particularly Globisporangium species [12]. A three-year study (2016-2018) characterizing post-harvest soil oomycete communities through metabarcoding revealed that tillage practices significantly affected community diversity, with conventional tillage (CT) supporting higher Shannon-based true diversity (Shannon-TD; p = 0.007) and Simpson-based true diversity (Simpson-TD; p = 0.014) compared to no-till (NT) practices [12]. Furthermore, crop rotation only affected community structure under CT (F = 2.01, p = 0.003) but not under NT (F = 1.20, p = 0.175), highlighting the context-dependent nature of ecological influences [12].
In woody plant systems, research on declining holm oak (Quercus ilex) in historical gardens identified Globisporangium glomeratum as a previously unrecognized pathogen [22]. Through integration of morphological observations and molecular analyses of ITS, LSU, and Cox II sequences, researchers confirmed the identity and pathogenicity of these isolates, with pathogenicity tests showing significant reductions in plant height (p < 0.05) and shoot and root biomass in inoculated seedlings [22]. This finding underscores the risk of unintentional dissemination through nursery stock or soil movement, particularly in urban settings where plant replacement is frequent [22].
Technical and Methodological Adaptation Requirements
Successfully adapting the ecological network framework across different crops and environments requires strategic modifications to the original methodology. The comparative analysis reveals several key considerations for scalability:
Sample type adjustments: While the rice study utilized aquatic environmental DNA sampling [1], terrestrial systems would require soil eDNA analysis [12], and woody perennial systems might need root or rhizosphere sampling [22]
Temporal monitoring frequency: The intensive daily monitoring in rice [9] may require adjustment for perennial crops with longer growth cycles, where seasonal sampling might capture relevant ecological shifts [22]
Taxonomic focus prioritization: The rice study employed a multi-taxa approach [3], but specific crops might benefit from targeted focus on functionally relevant groups, such as oomycetes in soybean systems [12] or specific pathogen groups in woody plants [22]
Scalability of analytical methods: The nonlinear time series analysis used in the rice study [9] requires quantitative time series data, which must be maintained across different monitoring approaches adapted for other crops
The adaptation potential is further demonstrated by research on cucumber pathogens, where novel Globisporangium species (G. parvizense and G. sarabense) were isolated from aquatic environments in Iran and confirmed to cause root and crown rot in cucumber seedlings [18]. This study utilized a combination of morphological analysis and multigene phylogeny (ITS, cox1, and cox2 regions), illustrating how the core principles of the framework can be applied with different technical emphases depending on the crop system [18].
Experimental Protocols for Framework Implementation
Core Methodological Components
Implementing the ecological network approach across different crops requires adherence to several core methodological components that ensure the reliability and interpretability of results. These protocols can be adapted to various cropping systems while maintaining the scientific rigor of the original framework:
Environmental DNA Metabarcoding Protocol:
- Sample collection: Consistent daily collection of environmental samples (water, soil, or rhizosphere) using standardized volumes and preservation methods [1]
- DNA extraction and purification: Use of optimized extraction kits with purification steps to remove inhibitors that may affect downstream analysis [1]
- Quantitative amplification: Employment of internal spike-in DNAs to enable quantitative assessment of community composition rather than just presence-absence data [9]
- Multi-locus amplification: Utilization of multiple universal primer sets (e.g., 16S rRNA, 18S rRNA, ITS, COI) to capture broad taxonomic range of prokaryotes, eukaryotes, fungi, and animals [9]
- Sequencing and bioinformatics: High-throughput sequencing followed by rigorous bioinformatic processing including quality filtering, denoising, and taxonomic assignment using reference databases [12]
Nonlinear Time Series Analysis:
- Causality detection: Application of unified information-theoretic causality measures to detect potential causal relationships between community members and crop performance [9]
- Network reconstruction: Construction of ecological interaction networks based on quantitative time series data to identify potentially influential species [3]
- Validation prioritization: Statistical ranking of detected relationships to prioritize candidates for experimental validation [9]
Manipulative Experiments:
- Field-based manipulations: Addition or removal of target organisms in realistic field conditions to test hypothesized effects [3]
- Multi-response measurement: Assessment of crop responses at multiple levels including growth rates, physiological parameters, and gene expression patterns [9]
- Fate monitoring: Tracking the population dynamics of introduced organisms following manipulation to confirm establishment and persistence [49]
Adaptation for Different Cropping Systems
The successful application of this framework across diverse crops requires specific adaptations to the core protocols:
For Annual Row Crops (Soybean, Corn, Wheat):
- Soil eDNA sampling should be synchronized with key phenological stages (emergence, flowering, grain fill) [12]
- Sampling depth should be standardized relative to root zone distribution
- Consideration of crop rotation history and tillage regimes as experimental factors [12]
For Perennial Horticultural Crops:
- Seasonal sampling rhythm aligned with dormancy, flowering, and fruit development cycles [22]
- Spatial sampling strategies that account for root system architecture and zone of influence
- Multi-year monitoring to capture long-term ecological dynamics [22]
For Aquatic Agricultural Systems (Rice, Taro):
- Water column eDNA sampling complemented by sediment samples [1]
- Consideration of water management practices (flooding, drainage) as experimental variables
- Attention to temperature and oxygen fluctuations that influence community composition [1]
Visualization of Research Framework and Signaling Pathways
Experimental Workflow Diagram
Crop-Specific Adaptation Pathways
The Scientist's Toolkit: Essential Research Reagents and Materials
Table 3: Essential Research Reagents and Materials for Framework Implementation
| Category | Specific Items | Function/Purpose | Application Notes |
|---|---|---|---|
| Sample Collection | Sterivex filter cartridges (0.22µm, 0.45µm) [1] | Environmental DNA capture from water samples | Essential for aquatic systems; different pore sizes capture different organism sizes |
| Soil corers, sterile containers [12] | Rhizosphere and soil sampling | Critical for terrestrial crop systems | |
| RNA/DNA stabilization buffers | Preservation of nucleic acid integrity | Required for gene expression studies | |
| Molecular Analysis | DNA extraction kits (e.g., NucleoSpin) [22] | Nucleic acid purification from environmental samples | Must be optimized for different sample types |
| Universal primer sets (16S, 18S, ITS, COI) [9] | Amplification of barcode regions across taxa | Multi-locus approach essential for community coverage | |
| Internal spike-in DNAs [9] | Quantitative assessment of community composition | Enables quantitative rather than relative abundance | |
| High-throughput sequencing platforms | DNA sequencing of amplicon libraries | Illumina platforms most commonly used | |
| Bioinformatics | Quality filtering tools (QIIME2, DADA2) [12] | Sequence data preprocessing and denoising | Critical for generating accurate ASV tables |
| Taxonomic databases (SILVA, UNITE, GenBank) [22] | Taxonomic assignment of sequences | Comprehensive references improve classification | |
| Time series analysis packages (rEDM, PCTS) [9] | Nonlinear causality detection | Implements convergent cross-mapping algorithms | |
| Experimental Validation | Pure cultures of target organisms [3] | Manipulative experiments | Required for addition treatments |
| Selective removal tools (nets, traps) [3] | Targeted organism removal | Enables removal experiments | |
| RNA sequencing reagents [9] | Transcriptome analysis | Reveals gene expression responses to manipulations |
The ecological network approach for detecting influential organisms represents a transformative methodology with significant potential for adaptation across diverse crops and environments. The original research in rice systems provides a robust template that integrates cutting-edge molecular techniques with ecological theory and agricultural application [9]. Evidence from other cropping systems, including soybean, corn, wheat, holm oak, and cucumber, demonstrates that the core principles of intensive monitoring, causal inference, and experimental validation can be successfully adapted with appropriate modifications to system-specific requirements [12] [22] [18].
The scalability of this framework hinges on several key factors: methodological flexibility in sampling approaches, adjustable temporal monitoring scales, and customizable analytical foci tailored to specific crop needs. The consistent detection of Globisporangium species across multiple studies and crop types [12] [22] [18] underscores the value of this approach in identifying previously overlooked influential organisms. As agricultural systems face increasing pressure to enhance productivity while reducing environmental impacts, such ecologically-informed approaches offer promising pathways for sustainable intensification.
Future applications of this framework should focus on developing crop-specific adaptation protocols, establishing standardized methodologies for cross-system comparisons, and integrating findings into practical management recommendations. The potential exists to transform agricultural management from its current focus on suppressing ecological complexity to actively harnessing it for improved crop performance and reduced environmental impact.
Empirical Validation of G. nunn Effects on Rice Growth and Gene Expression
This section objectively compares the effects of manipulating two different organisms, Globisporangium nunn and Chironomus kiiensis, on rice performance. The 2019 field manipulation experiment validated earlier findings from a 2017 ecological network analysis, which identified 52 organisms potentially influential to rice growth [3] [9].
Table 1: Experimental Treatments and Key Outcomes on Rice Performance
| Experimental Treatment | Organism Type | Manipulation Type | Observed Effect on Rice Growth Rate | Change in Gene Expression |
|---|---|---|---|---|
| Globisporangium nunn Added | Oomycete (syn. Pythium nunn) | Addition | Statistically significant change [3] [9] | Altered pattern [3] [9] |
| Chironomus kiiensis Removed | Midge (Insect) | Removal | Effect confirmed [9] | Not Specified |
The results demonstrated that the addition of G. nunn had a clearer, statistically significant effect on both rice growth rate and gene expression patterns compared to the removal of C. kiiensis [3] [9]. Although the manipulation effects were relatively small, this proof-of-concept study confirms the potential of the research framework to identify previously overlooked biotic factors influencing crop performance [3].
Detailed Experimental Protocols
The 2019 validation experiment employed a controlled field manipulation design to test causal relationships inferred from time-series data.
Organism Selection and Manipulation Design
- Candidate Identification: The two target organisms, the oomycete Globisporangium nunn and the midge Chironomus kiiensis, were selected from a list of 52 potentially influential species generated in 2017 via nonlinear time-series analysis of intensive ecological monitoring data [3] [9].
- Manipulation Protocol: Researchers established artificial rice plots and directly manipulated the abundance of the two target species [3]. The design included:
- G. nunn-added treatment: Introduction of the oomycete into plots.
- C. kiiensis-removed treatment: Removal of the midge species from plots.
- The specific methods for adding and removing organisms are detailed in the primary research article.
Rice Response Metrics and Measurement
The response of rice (Oryza sativa) to manipulations was quantified using physiological and molecular biomarkers to provide a comprehensive assessment [3] [9].
- Growth Rate Measurement: Rice growth rate was measured before and after the field manipulations, providing a direct phenotypic metric of plant performance [3] [9].
- Transcriptome Analysis: Gene expression patterns were analyzed from rice tissue samples collected before and after manipulation. This molecular-level data offers insights into the physiological pathways affected by the manipulated organisms [3] [9].
The Researcher's Toolkit: Essential Materials and Reagents
Table 2: Key Research Reagent Solutions and Experimental Materials
| Item / Solution | Primary Function in Experiment |
|---|---|
| Quantitative eDNA Metabarcoding | Comprehensive monitoring of ecological community dynamics across multiple taxa (prokaryotes, eukaryotes, fungi, animals) from environmental water samples [3] [9]. |
| Universal PCR Primer Sets | Amplification of specific gene regions (16S rRNA, 18S rRNA, ITS, COI) for taxonomic identification of organisms via eDNA [9]. |
| Internal Spike-in DNAs | Enable quantitative eDNA analysis by accounting for technical variation during sequencing, transforming data from presence/absence to quantitative abundance [3] [9]. |
| Nonlinear Time Series Analysis | Computational tool to reconstruct complex ecological interaction networks and detect causal relationships from quantitative time-series data [3] [9]. |
Within the pursuit of sustainable agriculture, researchers are increasingly looking to harness complex ecological interactions to improve crop performance. A groundbreaking study has demonstrated a novel framework combining environmental DNA (eDNA) metabarcoding and nonlinear time series analysis to identify previously overlooked organisms influencing rice growth under field conditions [1] [9] [2]. This research validated the approach by manipulating two species detected as potentially influential: the oomycete Globisporangium nunn and the midge Chironomus kiiensis [1] [3]. This guide provides a detailed, objective comparison of the outcomes resulting from the manipulation of these two distinct organisms, offering methodological insights and quantitative data for the research community.
The comparative data for G. nunn and C. kiiensis were generated through a multi-year, two-phase experimental workflow. The initial phase in 2017 involved intensive daily monitoring of small experimental rice plots over 122 consecutive days [1] [9]. Rice growth rate was measured daily, while ecological community dynamics were tracked using quantitative eDNA metabarcoding with four universal primer sets (16S rRNA, 18S rRNA, ITS, and COI) [9] [2]. This process detected over 1,000 species [1] [3]. The application of nonlinear time series analysis (a causality analysis method) to this extensive dataset identified 52 organisms with potentially influential effects on rice growth, including G. nunn and C. kiiensis [9] [2].
The validation phase in 2019 employed manipulative experiments on artificial rice plots [1]. The abundance of the two target species was manipulated: G. nunn was added, while C. kiiensis was removed [1] [55]. Rice responses, including growth rate and gene expression patterns, were measured before and after the manipulations to confirm causal effects [1] [9].
The diagram below illustrates this comprehensive experimental workflow.
Comparative Experimental Outcomes
The manipulations of G. nunn and C. kiiensis yielded distinct outcomes for rice growth and development, as summarized in the table below.
| Experimental Metric | Globisporangium nunn (Added) | Chironomus kiiensis (Removed) |
|---|---|---|
| Rice Growth Rate | Statistically clear increase [1] [9] | Changes observed, but validation less clear compared to G. nunn [55] |
| Gene Expression Patterns | Significant changes detected [1] [9] [2] | No differentially expressed genes (DEGs) reported [55] |
| Overall Effect on Rice | Relatively small but statistically clear effects [1] [9] | Effectiveness remains questionable [55] |
Analysis of Globisporangium nunn Outcomes
The addition of G. nunn demonstrated more statistically definitive results. The treatment led to a measurable increase in the rice growth rate and triggered significant changes in gene expression patterns [1] [9]. While the effects were characterized as "relatively small," the evidence for a causal relationship was solid [1]. This suggests that G. nunn plays a role in influencing rice physiology. The study did not fully elucidate the molecular mechanisms, and the fate of the introduced oomycete in the field environment was not tracked, indicating an area for future research [55].
Analysis of Chironomus kiiensis Outcomes
The manipulation of C. kiiensis produced more ambiguous results. Although the time series analysis initially identified it as potentially influential, and its removal was associated with changes in rice growth, the subsequent validation was less conclusive [55]. Notably, the transcriptome data analysis did not find differentially expressed genes in the C. kiiensis removal treatment, and reviewers noted that the validation of this specific treatment was not as clear as for G. nunn [55]. This contrast highlights the challenge of translating statistical predictions from complex ecological networks to confirmed field-level interactions.
The Scientist's Toolkit: Key Research Reagents & Materials
The following table details essential reagents and materials central to the experimental protocols of the featured study.
| Reagent/Material | Function in Experimental Protocol |
|---|---|
| Universal Primer Sets (16S rRNA, 18S rRNA, ITS, COI) | For eDNA metabarcoding to comprehensively amplify DNA from prokaryotes, eukaryotes, fungi, and animals, respectively [9] [2]. |
| Sterivex Filter Cartridges (0.22-µm & 0.45-µm) | For filtering water samples to capture eDNA from the environment for subsequent extraction and analysis [1]. |
| Internal Spike-in DNAs | To enable quantitative eDNA metabarcoding, allowing for the estimation of species' abundance in addition to mere presence/absence [9] [2]. |
| Nonlinear Time Series Analysis | A computational method to detect causal relationships (information transfer) between rice growth and the abundance of thousands of detected organisms from the time series data [9] [2]. |
This comparison guide illustrates the contrasting outcomes of manipulating Globisporangium nunn and Chironomus kiiensis in rice agroecosystems. The study demonstrates that an ecological-network-based approach is a feasible and powerful tool for identifying hidden influential organisms in complex field environments [9] [3]. While G. nunn emerged with a more clearly validated effect on rice growth and gene expression, the case of C. kiiensis underscores that statistical detection requires rigorous field validation. The integrated methodology, leveraging eDNA metabarcoding and nonlinear time series analysis, provides a valuable proof-of-concept for future efforts aimed at harnessing ecological complexity for sustainable agricultural innovation.
Quantitative Assessment of Treatment Impact
Rice (Oryza sativa) is a staple crop for over half of the world's population, making the sustainability and efficiency of its production a critical global concern. [3] [56] While advanced breeding techniques offer promising avenues for improvement, rice grown in field conditions is inevitably influenced by a complex network of surrounding ecological organisms. [3] [7] The manipulation of key organisms within this network presents a novel, environment-friendly strategy for enhancing agricultural systems. This guide provides a quantitative comparison of the impacts resulting from the manipulation of specific organisms, with a focused analysis on the effects of Globisporangium nunn on rice growth performance, offering researchers a validated framework for ecological intervention in agriculture.
Experimental Protocols and Methodologies
The quantitative assessment of treatment impacts on rice growth relies on sophisticated ecological monitoring and rigorous field validation. Below are the detailed methodologies for the key experiments cited in this guide.
Ecological Network Analysis and Causality Detection
This protocol is designed to identify previously overlooked organisms that causally influence rice growth from complex field data [3] [7].
- Field Monitoring Setup: Establish multiple small experimental rice plots. Monitor rice growth rates (e.g., daily height increase in cm/day) and concurrently collect water samples from the plots daily over an entire growing season (e.g., 122 consecutive days) [3].
- Quantitative eDNA Metabarcoding: Extract total DNA from the environmental water samples. Use quantitative metabarcoding approaches—employing internal spike-in DNAs for calibration—to comprehensively sequence and quantify the abundance of microbial and macrobial (e.g., insect) communities. This method can detect over 1,000 species in the system [3] [7].
- Nonlinear Time Series Analysis: Analyze the generated intensive time series data (e.g., for 1197 species and rice growth) using causality detection algorithms, such as convergent cross-mapping. This statistical method distinguishes causal interactions from simple correlation within complex, nonlinear ecological networks to produce a shortlist of potentially influential organisms [3].
Field Manipulation for Organism Impact Validation
This protocol validates the effects of candidate organisms identified via ecological network analysis [3].
- Treatment Design: Establish artificial rice plots for manipulative experiments. For a candidate organism identified as potentially influential, such as the oomycete Globisporangium nunn, design an "additive" treatment where its abundance is artificially increased. For an insect species like Chironomus kiiensis, design a "removal" treatment. Include appropriate control plots.
- Response Measurement: Before and after the manipulation, measure rice response variables:
- Growth Rate: Quantify the change in plant height over time.
- Gene Expression: Conduct transcriptome analysis (e.g., RNA sequencing) on rice tissue to identify changes in gene expression patterns triggered by the manipulation [3].
- Statistical Comparison: Compare the growth rates and gene expression profiles between the treatment and control groups using statistical models to confirm the causal effect of the manipulated organism.
Comparative Quantitative Data of Treatments
The following tables summarize the quantitative impacts of different biological and genetic manipulations on rice growth and performance, based on experimental data.
Table 1: Impact of Ecological Organism Manipulation on Rice Growth
| Treatment Organism | Type of Manipulation | Key Measured Rice Response | Quantitative Impact | Experimental Context |
|---|---|---|---|---|
| Globisporangium nunn (Oomycete) | Addition to plots | Growth Rate & Gene Expression | Statistically clear changes in growth rate and transcriptome dynamics [3] | Field validation in artificial plots, 2019 [3] |
| Chironomus kiiensis (Midge) | Removal from plots | Growth Rate & Gene Expression | Statistically clear effects, though relatively smaller than G. nunn [3] | Field validation in artificial plots, 2019 [3] |
Table 2: Impact of Genetic Manipulation on Rice Traits for Hybrid Production
| Genetic Manipulation | Target Trait | Key Measured Outcome | Quantitative Impact |
|---|---|---|---|
| Simultaneous knockout of GS3, GW8, GS9 | Stigma Exsertion Rate (SER) | Total Stigma Exsertion Rate (TSE) | Increased to ~60% in the triple mutant, a dramatic improvement from typical rates (<25% in indica) [56] |
| Simultaneous knockout of GS3, GW8, GS9 | Grain Shape | Spikelet Length/Width Ratio | Gradual elevation from single to triple mutant [56] |
| Simultaneous knockout of GS3, GW8, GS9 | Outcrossing Rate | Seed Production Yield | Effectively improved in both japonica and indica male sterile lines [56] |
Research Reagent Solutions Toolkit
The following reagents and materials are essential for executing the experimental protocols described above.
Table 3: Essential Research Reagents and Materials
| Item | Function/Brief Explanation |
|---|---|
| Internal Spike-in DNAs | Synthetic DNA sequences added to environmental samples before DNA extraction to calibrate and enable quantitative eDNA metabarcoding, moving beyond simple species detection to abundance estimation [3] [7]. |
| PCR Primers for Metabarcoding | Designed to comprehensively amplify specific marker gene regions (e.g., 18S rRNA, COI) across a wide taxonomic range from the total extracted eDNA, allowing for the simultaneous identification of microbes and macrobes [3]. |
| CRISPR/Cas9 Constructs | Used for targeted genetic manipulation, such as knocking out specific genes (e.g., GS3, GW8, GS9) to study their synchronous effect on grain shape and stigma excretion [56]. |
| RNA Sequencing Kits | Facilitate transcriptome analysis by converting RNA extracted from plant tissue into a sequencing library, enabling the measurement of genome-wide gene expression changes in response to experimental treatments [3]. |
Signaling Pathways and Workflows
The diagrams below illustrate the core logical workflows and relationships derived from the research methodologies.
Experimental Workflow for Ecological Impact Validation
Ecological Interaction Network in Rice Paddy
The pursuit of sustainable agricultural productivity necessitates a deep understanding of the complex biological interactions within crop ecosystems. While advanced breeding techniques offer promising avenues for improving rice (Oryza sativa) performance, the plant's growth under field conditions remains inevitably influenced by surrounding ecological community members [3] [9]. Among these influential organisms, Globisporangium nunn (syn. Pythium nunn), an oomycete species, has emerged as a significant biotic factor capable of altering rice growth and gene expression patterns [3] [9]. This review synthesizes experimental evidence within the broader context of validating influential organisms for rice growth, focusing specifically on the transcriptomic shifts induced by G. nunn manipulation.
The ecological network approach employed in foundational studies integrated intensive field monitoring with quantitative environmental DNA (eDNA) metabarcoding to identify previously overlooked organisms affecting rice performance [3] [9]. From over 1,000 species detected in rice plots, nonlinear time series analysis identified 52 potentially influential organisms, including G. nunn [9]. Subsequent manipulative experiments confirmed that G. nunn addition statistically altered rice growth rates and gene expression patterns, providing compelling evidence for its functional role in rice agricultural systems [3]. This review objectively compares the documented effects of G. nunn against other biotic and abiotic factors, presenting supporting experimental data to elucidate the molecular mechanisms underlying these interactions.
Experimental Validation: From Ecological Detection to Functional Confirmation
Research Workflow and Methodological Framework
The identification and validation of G. nunn as an influential organism followed a systematic research workflow that integrated ecological monitoring, computational analysis, and experimental manipulation. The comprehensive approach ensured that the detected relationship between G. nunn and rice performance was not merely correlational but reflected causal influence.
Experimental Protocols for G. nunn Manipulation and Transcriptomic Analysis
Field Manipulation Design
The functional validation of G. nunn involved carefully controlled manipulative experiments conducted in artificial rice plots during the 2019 growing season [9]. The experimental protocol was designed as follows:
Plot Establishment: Small plastic containers (90 × 90 × 34.5 cm; 216 L total volume) were established as artificial rice plots in an experimental field [1]. Sixteen Wagner pots were filled with commercial soil, with three rice seedlings (variety Hinohikari) planted in each pot [1].
G. nunn Manipulation: The abundance of G. nunn was experimentally increased in treatment plots through controlled addition [3] [9]. The oomycete was introduced to the rice plot environment at quantified levels, while control plots maintained natural G. nunn abundance.
Response Measurement: Rice responses were measured both before and after manipulation, including growth rate assessment and tissue sampling for transcriptomic analysis [9]. This before-after control-impact design allowed for robust detection of treatment effects.
Transcriptomic Profiling Methodology
The molecular analysis of rice responses to G. nunn manipulation followed established transcriptomic protocols:
RNA Extraction and Sequencing: RNA was extracted from rice tissues collected before and after G. nunn manipulation [9]. While the specific RNA extraction methodology for the G. nunn experiments was not detailed in the available sources, standard approaches in similar studies involve tissue homogenization, RNA isolation using commercial kits, quality control, and cDNA library preparation for sequencing [57].
Differential Expression Analysis: Gene expression differences between treatment and control conditions were statistically analyzed using appropriate bioinformatic tools. Commonly applied methods include DESeq software for identifying differentially expressed genes (DEGs) with significance thresholds typically set at |log2FoldChange| > 1 and p < 0.05 [57].
Functional Enrichment Analysis: Gene Ontology (GO) enrichment and KEGG pathway analysis were performed to identify biological processes, molecular functions, and pathways significantly affected by G. nunn manipulation [57]. These analyses used hypergeometric distribution methods with significance thresholds of p < 0.05.
Table 1: Key Experimental Parameters for G. nunn Manipulation Study
| Experimental Component | Specification | Application in G. nunn Study |
|---|---|---|
| Rice Variety | Hinohikari | Selected for consistent growth response assessment [1] |
| Plot Design | 90 × 90 × 34.5 cm containers with 16 Wagner pots | Standardized growing conditions across replicates [1] |
| Monitoring Period | Daily from May 23 to September 22 (122 days) | Intensive temporal resolution for dynamics capture [3] |
| eDNA Regions | 16S rRNA, 18S rRNA, ITS, COI | Comprehensive community profiling across taxa [9] |
| Manipulation Approach | Addition to plots | Direct testing of causal relationship [9] |
| Response Variables | Growth rate, gene expression patterns | Integrated physiological and molecular assessment [3] |
Comparative Analysis of G. nunn Effects on Rice Gene Expression
Transcriptomic Changes Induced by G. nunn Manipulation
The experimental addition of G. nunn to rice plots resulted in statistically significant changes in rice gene expression patterns, demonstrating the oomycete's influence on rice molecular physiology [3] [9]. Although the specific genes and pathways altered by G. nunn were not exhaustively detailed in the available sources, the research confirmed that the transcriptomic changes were sufficient to impact rice growth rates [9]. The effects were characterized as "relatively small" but statistically clear, suggesting a modulatory rather than transformative influence on rice gene expression [3].
When compared to other environmental influences on rice transcriptomes, G. nunn appears to function as a biotic modulator of rice physiology. The following table compares the characteristics of transcriptomic responses to various environmental factors based on data from multiple studies:
Table 2: Comparative Transcriptomic Responses in Rice Under Various Environmental Stimuli
| Environmental Factor | Number of DEGs | Key Affected Pathways | Representative Study |
|---|---|---|---|
| G. nunn Addition | Not specified | Not fully characterized | [9] |
| Salt Stress (N14 tolerant variety) | 372 DEGs | Protein phosphorylation, lipid transport, plant-pathogen interaction | [57] |
| Salt Stress (N6 sensitive variety) | 393 DEGs | Photosynthesis, metabolic pathways, protein folding | [57] |
| Heat Stress (S49 tolerant line) | Not specified | IAA and JA signaling pathways | [58] |
| Iron Toxicity | 35 metal homeostasis genes | Metal homeostasis, oxidative stress response | [59] |
| Low Nitrogen Conditions | Not specified | Nitrogen metabolism, cell wall modification, transport processes | [60] |
Contrasting Transcriptomic Response Patterns Across Stress Conditions
The transcriptomic shifts observed in rice under various environmental challenges reveal distinct response strategies that provide context for understanding G. nunn effects:
Salt Stress Mechanisms: Salt-tolerant and salt-sensitive rice varieties employ fundamentally different molecular strategies under NaCl stress. Tolerant varieties like N14 activate protein phosphorylation and lipid transport pathways, primarily localized to membranes and extracellular regions, while sensitive varieties like N6 activate photosynthesis and protein folding pathways in chloroplasts and peroxisomes [57]. The activation of "plant-pathogen interaction" pathways in salt-tolerant varieties suggests potential overlap with biotic response mechanisms relevant to G. nunn interactions.
Heat Stress Adaptation: Transcriptomic analysis of heat-tolerant (S49) and susceptible (Sa) rice cultivars reveals distinctive phytohormone involvement, with tolerant lines maintaining higher indole-3-acetic acid (IAA) and lower jasmonic acid (JA) levels under stress [58]. This hormonal rebalancing represents a specialized transcriptomic adjustment strategy that may parallel responses to biotic influences like G. nunn.
Nutrient Stress Responses: Under low nitrogen conditions, rice introgression lines demonstrate transcriptomic rewiring involving ion transport repression and cell wall modification to enhance nutrient acquisition [60]. This resource reallocation strategy represents another distinct pattern of transcriptomic adjustment to environmental challenges.
Research Reagents and Methodological Toolkit
Table 3: Essential Research Reagents and Resources for Rice Transcriptomic Studies
| Reagent/Resource | Application Function | Example Implementation |
|---|---|---|
| Quantitative eDNA Metabarcoding | Comprehensive ecological community monitoring | Detection of 1,000+ species in rice plots using 16S/18S rRNA, ITS, and COI primers [3] |
| Internal Spike-in DNAs | Quantitative normalization of eDNA data | Enable accurate quantification of species abundance [9] |
| RNA-Sequencing | Transcriptome profiling | Identification of differentially expressed genes under experimental conditions [57] |
| DESeq Software | Differential expression analysis | Statistical identification of significant gene expression changes [57] |
| GO and KEGG Enrichment | Functional interpretation of transcriptomic data | Identification of biological pathways affected by experimental manipulations [57] |
| qRT-PCR Validation | Confirmation of RNA-Seq results | Verification of differential expression using orthogonal method [57] |
| Nonlinear Time Series Analysis | Causal network inference | Detection of influential species from abundance dynamics [9] |
Molecular Pathways and Proposed Mechanism of G. nunn Influence
Based on the confirmed effects of G. nunn on rice gene expression and analogous pathways activated in other biotic interactions, we propose a mechanistic model for how this oomycete influences rice molecular physiology:
While the precise molecular mechanisms through which G. nunn influences rice transcriptomes require further elucidation, several plausible pathways can be inferred from related research:
Plant-Pathogen Interaction Pathways: Given that salt-tolerant rice varieties activate "plant-pathogen interaction" pathways as part of their stress adaptation strategy [57], and G. nunn belongs to the oomycetes (a group containing many plant pathogens), it is plausible that similar pathways are modulated in response to G. nunn presence.
Hormonal Signaling Modulation: The distinct jasmonic acid (JA) and indole-3-acetic acid (IAA) profiles observed in heat-stressed rice cultivars [58] suggest that hormonal rebalancing may represent a common transcriptomic adjustment strategy that could be similarly engaged by G. nunn influence.
Defense Response Activation: As an oomycete, G. nunn may trigger mild defense responses in rice that consequently affect growth processes, representing a trade-off between defense and growth that manifests in altered growth rates and transcriptomic patterns [9].
The validation of G. nunn as an influential organism affecting rice transcriptomes represents a significant advancement in understanding the complex ecological interactions that influence crop performance. The research framework integrating eDNA-based ecological monitoring, nonlinear time series analysis, and experimental manipulation provides a powerful approach for identifying previously overlooked biotic factors in agricultural systems [3] [9].
While the specific molecular mechanisms and complete transcriptomic profile changes induced by G. nunn require further characterization, the confirmed effects on both rice growth rates and gene expression patterns demonstrate the functional importance of this oomycete in rice field ecosystems [9]. The relatively small but statistically clear effects suggest that G. nunn may function as one of many ecological modulators that collectively influence rice physiology in complex agricultural environments.
This research direction holds promise for developing novel agricultural management strategies that harness ecological complexity to enhance crop productivity and sustainability. By identifying key influential organisms like G. nunn and understanding their molecular effects on rice, we move closer to designing agricultural systems that optimize beneficial ecological interactions while minimizing environmental impacts.
Comparative Analysis with Other Detected Organisms and Traditional Agrochemicals
The validation of Globisporangium nunn as an organism influencing rice growth represents a paradigm shift in agricultural science, moving from a traditional single-factor approach to a complex ecological network perspective [1] [9]. This research emerges from a broader thesis that recognizes agricultural systems as complex networks of interacting species, where manipulating key organisms can potentially enhance crop productivity more sustainably than conventional agrochemicals [3]. Where traditional agrochemicals typically target specific pests or nutritional deficiencies, the ecological network approach identifies organisms that influence crop performance through often indirect ecological interactions [9]. The detection and validation of G. nunn and other influential organisms like Chironomus kiiensis was made possible through advanced monitoring technologies and analytical methods that can decode complex biological relationships in agricultural ecosystems [1] [9]. This comparative analysis examines how these biologically-based interventions compare with traditional agrochemical approaches in terms of efficacy, mechanisms of action, and potential for sustainable agriculture implementation.
Methodological Framework for Detection and Validation
Experimental Workflow for Organism Detection and Testing
The identification and validation of influential organisms followed a systematic research pipeline that integrated field ecology, molecular biology, and computational modeling [9]. The workflow below illustrates this multi-stage process:
Core Research Protocols
The experimental approach combined intensive field monitoring with molecular validation techniques conducted over multiple growing seasons [1] [9]:
Field Plot Establishment and Monitoring (2017): Researchers established five experimental rice plots (90 × 90 × 34.5 cm containers) at Kyoto University, Japan [1]. Each plot contained sixteen Wagner pots with commercial soil, with three rice seedlings (variety Hinohikari) planted per pot [1]. Daily monitoring occurred from 23 May to 22 September 2017 (122 consecutive days), during which rice growth rates (cm/day in height) were measured daily using ruler measurements of the largest leaf heights [1] [9]. Concurrently, climate variables (temperature, light intensity, and humidity) were monitored at each plot [1].
Ecological Community Assessment via eDNA Metabarcoding: Water samples (approximately 200 ml) were collected daily from each rice plot and filtered using two types of Sterivex filter cartridges (φ 0.22-µm and φ 0.45-µm) [1]. Environmental DNA was extracted and analyzed using quantitative eDNA metabarcoding with four universal primer sets targeting different taxonomic groups: 16S rRNA (prokaryotes), 18S rRNA (eukaryotes), ITS (fungi), and COI (animals) [9]. This approach detected 1,197 species across the rice plots, providing the comprehensive community data necessary for subsequent causal inference analysis [9].
Nonlinear Time Series Analysis for Causal Inference: The research team applied convergent cross-mapping (CCM), a nonlinear time series analysis method, to detect potential causal relationships between rice growth and the abundance of specific organisms [9]. This method can distinguish true causality from correlation in complex ecological systems by testing whether information about rice growth rates can be recovered from the time series of organism abundance [9]. The analysis identified 52 potentially influential organisms with lower-level taxonomic information from the initial 1,197 species detected [9].
Manipulation Experiments (2019): Based on the 2017 analysis, researchers selected two species for experimental validation: Globisporangium nunn (added to plots) and Chironomus kiiensis (removed from plots) [9]. The responses of rice—including growth rates and gene expression patterns—were measured before and after manipulation [9]. In the G. nunn-added treatment, rice growth rate and gene expression patterns showed statistically significant changes, confirming its influential status [9].
Comparative Performance Analysis
Quantitative Outcomes Comparison
Table 1: Comparative Effects on Rice Growth and Soil Health
| Treatment Type | Effect on Rice Growth Rate | Gene Expression Changes | Impact on Soil Biodiversity | Evidence Strength |
|---|---|---|---|---|
| G. nunn Addition | Moderate increase | Significant transcriptome alterations | Potentially positive (based on network effects) | Solid experimental validation [9] |
| C. kiiensis Removal | Minor changes | Limited alterations | Unknown ecological consequences | Limited effects observed [9] |
| Traditional Agrochemicals | Variable (highly dependent on type) | Often stress-responsive pathways | Typically negative reduction in microbial diversity | Extensive literature support |
| Oomycete-Targeted Fungicides | Effective against pathogens | Defense pathway activation | Non-target effects on beneficial oomycetes | Established efficacy [61] |
Table 2: Agricultural Implementation Considerations
| Parameter | G. nunn-Based Approach | Conventional Agrochemicals |
|---|---|---|
| Specificity | High (organism-specific) | Variable (broad to targeted) |
| Environmental Persistence | Likely low (biological agent) | Often high (chemical residues) |
| Application Frequency | Unknown (requires further study) | Established schedules |
| Resistance Risk | Potentially low | Increasing concern |
| Ecological Network Effects | Potentially positive | Often disruptive |
| Development Timeline | Longer (validation required) | Streamlined (existing protocols) |
Mechanistic Comparison: Modes of Action
The diagram below illustrates the contrasting mechanisms through which G. nunn manipulation versus traditional agrochemicals influence rice growth:
The Scientist's Toolkit: Essential Research Reagents and Materials
Table 3: Key Research Reagents for Ecological Network Analysis in Agriculture
| Reagent/Material | Specific Application | Research Function |
|---|---|---|
| Universal PCR Primers (16S, 18S, ITS, COI) | eDNA metabarcoding | Comprehensive community detection across taxonomic kingdoms [9] |
| Sterivex Filter Cartridges (0.22-µm, 0.45-µm) | eDNA sample collection | Efficient capture of DNA from diverse organisms in water samples [1] |
| Spike-in DNA Standards | Quantitative eDNA analysis | Enables absolute quantification of eDNA copies for time series analysis [9] |
| Convergent Cross-Mapping Algorithms | Nonlinear time series analysis | Detects causal relationships in complex ecological community data [9] |
| RNA Sequencing Reagents | Transcriptome analysis | Measures gene expression changes in response to organism manipulation [9] |
| Artificial Rice Plots (90 × 90 × 34.5 cm) | Field experimentation | Controlled field environment for manipulation experiments [1] |
Discussion: Advantages and Limitations of Ecological Network Approach
Comparative Efficacy and Implementation Challenges
The ecological network approach for detecting influential organisms presents distinct advantages and limitations compared to traditional agrochemical strategies. The network-based method identified G. nunn through its ecological context rather than predetermined functional categories, allowing discovery of previously overlooked influential organisms [9]. This approach leverages naturally evolved biological interactions, potentially offering more sustainable and self-regulating agricultural interventions [3]. However, the effects observed from G. nunn manipulation, while statistically clear, were relatively small compared to established agrochemical treatments [9], suggesting that biological approaches may require complementary strategies rather than direct replacement of conventional methods.
The scalability and reproducibility of organism-based interventions present significant challenges. Unlike standardized agrochemical formulations, the effects of G. nunn and similar organisms likely depend on ecological context, soil conditions, and climate factors [61]. Research on related oomycete species demonstrates that agricultural practices like tillage and crop rotation significantly influence oomycete community composition and pathogenicity [61]. No-till practices were shown to decrease oomycete diversity and reduce community heterogeneity compared to conventional tillage [61], suggesting that management practices must be coordinated with biological interventions.
Ecological Specificity and Non-target Effects
A significant advantage of the organism-based approach is its potential for ecological specificity. Where broad-spectrum agrochemicals often impact non-target species, including beneficial soil organisms, G. nunn manipulation appears to work through specific ecological interactions [9]. This specificity was evidenced by distinct gene expression patterns in rice following G. nunn addition, suggesting a targeted physiological response rather than general stress activation [9]. However, the complexity of ecological networks means that manipulating one species can have unforeseen consequences through direct and indirect pathways [9], requiring careful monitoring of whole-community responses.
The detection method itself represents a significant advancement for agricultural science. Traditional agrochemical development follows a deductive approach—identifying a target function (e.g., nitrogen fixation, pathogen suppression) and screening for compounds that achieve it. In contrast, the ecological network approach inductively identifies influential species through empirical monitoring and causal inference, allowing discovery of organisms whose functional significance was previously unrecognized [9]. This method could potentially identify species that enhance crop performance through novel mechanisms not targeted by existing agrochemicals.
This comparative analysis demonstrates that G. nunn manipulation and similar organism-based approaches represent a complementary rather than replacement strategy for traditional agrochemicals. The ecological network approach offers a powerful discovery tool for identifying influential organisms, with advantages in environmental compatibility and novel mechanisms of action [9] [3]. However, traditional agrochemicals currently provide more consistent, immediate, and scalable effects for crop protection and enhancement. The most promising path forward likely involves integration of both approaches—using ecological network analysis to identify key organisms and their mechanisms of action, then developing targeted interventions that may include biological agents, selective chemicals, or management practices that optimize these biological relationships. This integrated approach acknowledges the complexity of agricultural ecosystems while providing practical solutions for sustainable food production.
Conclusion
This study successfully establishes a novel, repeatable framework that combines ecological network analysis with molecular tools to identify and validate specific organisms influencing crop performance. The confirmation that Globisporangium nunn manipulation alters rice growth and physiology underscores the potential of leveraging field ecological complexity for agriculture, moving beyond a purely plant-centric view. This proof-of-concept opens avenues for developing new biological amendments or management strategies. Future research should focus on elucidating the molecular mechanisms of the G. nunn-rice interaction, testing the framework across diverse agricultural systems, and exploring the commercial application of identified influential organisms to reduce reliance on synthetic inputs, thereby advancing more sustainable and resilient food systems.
References
- 1. Detecting and validating influential organisms for rice growth [https://elifesciences.org/reviewed-preprints/87202v1]
- 2. An ecological network approach for detecting and validating influential... [https://elifesciences.org/articles/87202]
- 3. Detecting and validating influential organisms for rice growth [https://elifesciences.org/reviewed-preprints/87202]
- 4. An ecological network approach for detecting and ... [https://pubmed.ncbi.nlm.nih.gov/37702717/]
- 5. International Rice Research Institute wins at Asian ... [https://www.irri.org/news-and-events/news/international-rice-research-institute-wins-asian-innovation-excellence-awards]
- 6. AI Insights from 50 years of rice data: Seasonal breeding ... [https://www.agtechnavigator.com/Article/2025/09/10/ai-uncovers-50-years-of-rice-data-seasonal-breeding-and-variety-shifts-crucial-for-sustained-yields/]
- 7. Contrasting ecological communities in rice paddy fields ... [https://www.sciencedirect.com/science/article/abs/pii/S0167880925005985]
- 8. 110 years of rice breeding at LSU: realized genetic gains and ... [https://pmc.ncbi.nlm.nih.gov/articles/PMC12149018/]
- 9. An ecological network approach for detecting and ... [https://pmc.ncbi.nlm.nih.gov/articles/PMC10499375/]
- 10. Realized Genetic Gain in Rice: Achievements from Breeding ... [https://thericejournal.springeropen.com/articles/10.1186/s12284-023-00677-6]
- 11. Breeding rice varieties provides an effective approach to ... [https://www.sciencedirect.com/science/article/abs/pii/S1161030121000113]
- 12. Long-Term Tillage and Crop Rotation Regimes Reshape Soil ... [https://pmc.ncbi.nlm.nih.gov/articles/PMC10305274/]
- 13. Role of Keystone Species in an Ecosystem [https://education.nationalgeographic.org/resource/role-keystone-species-ecosystem/]
- 14. Identification of Keystone Species in Ecological ... [https://www.mdpi.com/2410-3888/8/5/224]
- 15. Farmers and landowners are the keystone species for ... [https://www.openaccessgovernment.org/farmers-and-landowners-are-the-keystone-species-for-agroecosystem-sustainability/95401/]
- 16. Keystone species can be identified based on motif centrality [https://www.sciencedirect.com/science/article/abs/pii/S1470160X19308726]
- 17. Keystone species and food webs - PMC - PubMed Central [https://pmc.ncbi.nlm.nih.gov/articles/PMC2685432/]
- 18. Multigene phylogeny, morphology, and pathogenicity ... [https://pmc.ncbi.nlm.nih.gov/articles/PMC12364885/]
- 19. Isolation and Characterization of Globisporangium ... [https://pmc.ncbi.nlm.nih.gov/articles/PMC12567531/]
- 20. Novel Fusari- and Toti-like Viruses, with Probable Different ... [https://www.mdpi.com/1999-4915/13/10/1931]
- 21. Socio-ecological factors determine crop performance in ... [https://www.nature.com/articles/s41598-020-60927-1]
- 22. Isolation and Characterization of Globisporangium ... [https://www.mdpi.com/2076-0817/14/10/960]
- 23. Rice Growth Parameter Estimation Based on Remote ... [https://www.mdpi.com/2077-0472/15/10/1026]
- 24. Estimating the phenological dynamics of irrigated rice leaf ... [https://www.sciencedirect.com/science/article/pii/S0303243421001616]
- 25. Rice yield prediction through integration of biophysical ... [https://www.nature.com/articles/s41598-024-72624-4]
- 26. tabrizense sp. nov., Globisporangium ... Globisporangium [https://www.nature.com/articles/s41598-024-81651-0?error=cookies_not_supported]
- 27. A manager's guide to using eDNA metabarcoding in marine ... [https://pmc.ncbi.nlm.nih.gov/articles/PMC9673773/]
- 28. How quantitative is metabarcoding: A metaâ€analytical ... [https://pmc.ncbi.nlm.nih.gov/articles/PMC7379500/]
- 29. Quantitative environmental DNA metabarcoding shows ... [https://www.nature.com/articles/s41598-022-25274-3]
- 30. eDNA metabarcoding for qualitative and semi-quantitative ... [https://www.frontiersin.org/journals/marine-science/articles/10.3389/fmars.2025.1688716/full]
- 31. Report Interpretation Guide [https://www.naturemetrics.com/report-interpretation-guide]
- 32. Physiological indicators drive climate-smart and ... [https://www.nature.com/articles/s41598-025-23184-8]
- 33. Genetic variability in physiological and agronomic traits of ... [https://bmcplantbiol.biomedcentral.com/articles/10.1186/s12870-025-07436-3]
- 34. Physiological analysis reveals the mechanism of ... [https://www.frontiersin.org/journals/plant-science/articles/10.3389/fpls.2023.1133592/full]
- 35. Empirical dynamic modeling [https://en.wikipedia.org/wiki/Empirical_dynamic_modeling]
- 36. Empirical dynamic modelling and enhanced causal ... [https://www.nature.com/articles/s41598-024-54054-4]
- 37. Detecting and validating influential organisms for rice growth [https://elifesciences.org/reviewed-preprints/87202v2]
- 38. A predictive approach to enhance time-series forecasting [https://www.nature.com/articles/s41467-025-63786-4]
- 39. Microbial network analysis: How to unravel interactions ... [https://lizard.bio/knowledge-hub/microbial-network-analysis]
- 40. Integrated Value of Influence: An Integrative Method for the ... [https://pmc.ncbi.nlm.nih.gov/articles/PMC7660386/]
- 41. sylvaticum - Wikipedia Globisporangium [https://en.wikipedia.org/wiki/Globisporangium_sylvaticum]
- 42. oryzicola sp. nov., causing poor seedling... Globisporangium [https://link.springer.com/article/10.1007/s10482-016-0822-2]
- 43. Frontiers | Multigene phylogeny, morphology, and pathogenicity... [https://www.frontiersin.org/journals/microbiology/articles/10.3389/fmicb.2025.1615096/full]
- 44. Prospects and challenges of environmental DNA (eDNA ... [https://link.springer.com/article/10.1007/s10750-018-3750-5]
- 45. Environmental DNA (eDNA): A review of ecosystem ... [https://link.springer.com/article/10.1007/s10531-025-03112-y]
- 46. First national survey of terrestrial biodiversity using ... [https://www.nature.com/articles/s41598-025-03650-z]
- 47. eDNA Adoption: Weighing the Benefits and Challenges from ... [https://pmc.ncbi.nlm.nih.gov/articles/PMC12457547/]
- 48. Large-scale causal discovery using interventional data sheds ... [https://pmc.ncbi.nlm.nih.gov/articles/PMC12579002/]
- 49. Peer review in An ecological network approach for ... [https://elifesciences.org/articles/87202/peer-reviews]
- 50. Specialists Speaking: May 2025 - Rice Farming [https://www.ricefarming.com/departments/specialists-speaking/specialists-speaking-may-2025/]
- 51. Using Effect Size—or Why the P Value Is Not Enough - PMC [https://pmc.ncbi.nlm.nih.gov/articles/PMC3444174/]
- 52. What is Effect Size and Why Does It Matter? (Examples) [https://www.scribbr.com/statistics/effect-size/]
- 53. What to interpret when observed effect size is smaller but ... [https://discourse.datamethods.org/t/what-to-interpret-when-observed-effect-size-is-smaller-but-statistically-significant-than-expected-effect-size/675]
- 54. Effect size: What is it and when and how should I use it? [https://www.physport.org/expert/effectsize/]
- 55. Detecting and validating influential organisms for rice growth [https://elifesciences.org/reviewed-preprints/87202v2/reviews]
- 56. Targeted manipulation of grain shape genes effectively ... [https://pmc.ncbi.nlm.nih.gov/articles/PMC9884017/]
- 57. Transcriptome Analysis Reveals Differences in Molecular ... [https://pmc.ncbi.nlm.nih.gov/articles/PMC12564911/]
- 58. Transcriptome analysis of two rice cultivars highlights the role ... [https://bmcgenomics.biomedcentral.com/articles/10.1186/s12864-025-12079-7]
- 59. Comparative Transcriptomics of Lowland Rice Varieties ... [https://pmc.ncbi.nlm.nih.gov/articles/PMC8462385/]
- 60. Transcriptome and gene co-expression network analysis ... [https://pubmed.ncbi.nlm.nih.gov/40556686/]
- 61. Long-Term Tillage and Crop Rotation Regimes Reshape ... [https://www.mdpi.com/2223-7747/12/12/2338]