Balancing Act in Research: Strategies to Optimize Data Quality While Minimizing Volunteer Burden in Clinical Studies
This article provides a comprehensive framework for researchers and drug development professionals to navigate the critical trade-off between data integrity and participant effort in volunteer-based studies.
Balancing Act in Research: Strategies to Optimize Data Quality While Minimizing Volunteer Burden in Clinical Studies
Abstract
This article provides a comprehensive framework for researchers and drug development professionals to navigate the critical trade-off between data integrity and participant effort in volunteer-based studies. It explores the foundational principles defining data quality and volunteer burden, presents methodological approaches for efficient study design, offers troubleshooting strategies for common data collection challenges, and reviews validation techniques to assess optimization success. The synthesis aims to empower the design of more ethical, efficient, and scientifically robust biomedical research.
Understanding the Core Conflict: Defining Data Quality and Volunteer Burden in Clinical Research
Technical Support Center
Troubleshooting Guides & FAQs
Q1: Our high-throughput screening assay is yielding data with high intra-plate variability, compromising accuracy. What are the primary troubleshooting steps?
A: High variability often stems from reagent or instrumentation inconsistency. Follow this protocol:
- Instrument Calibration: Perform a full maintenance cycle on liquid handlers and readers. Log all calibration data.
- Reagent Validation: Thaw a new aliquot of critical reagents (e.g., ATP for kinase assays). Prepare a fresh batch of assay buffer.
- Control Re-test: Run a control plate (maximum, minimum, and mid-range signal controls) using the newly calibrated instrument and fresh reagents.
- Data Analysis: Calculate the Z'-factor for the control plate. A value >0.5 indicates a robust assay. If variability persists, proceed to step 5.
- Environmental Check: Verify incubator temperature and CO₂ levels are stable and logged.
Q2: We are missing critical time-point data in a longitudinal volunteer-reported outcome study, affecting completeness. How can we mitigate this during the study and handle the gaps afterward?
A: Proactive engagement and robust imputation are key.
- Proactive Mitigation Protocol:
- Implement automated, scheduled reminder messages (email, SMS) with direct links to the reporting tool.
- After a missed time-point, trigger a low-effort "catch-up" survey that asks for the most critical data points only.
- Data Handling Protocol for Gaps:
- Classify the missingness mechanism (e.g., Missing Completely at Random - MCAR) using Little's test.
- For MCAR data, apply multiple imputation by chained equations (MICE) to create 5-10 complete datasets.
- Perform your analysis on each dataset and pool the results using Rubin's rules.
Q3: Delays in sample processing at satellite collection sites are impacting the timeliness of biomarker analysis. What is a validated workflow to stabilize samples?
A: Implement a sample stabilization and logging protocol.
- Immediate Stabilization: Upon collection, immediately mix blood with a commercial cell-stabilizing reagent (e.g., PAXgene for RNA, Streck tubes for cfDNA). Invert 10 times.
- Pre-processing Log: Record exact collection time and required processing delay in a central log. Place tube in a 4°C portable cooler.
- Batch Shipping: Ship stabilized samples daily (not weekly) to the core lab using a monitored cold chain logistics service.
- Core Lab Receipt: Upon receipt, log the time, perform a visual QC, and immediately process or store at -80°C.
Q4: Inconsistencies in diagnostic criteria between clinical sites are causing major data consistency errors in our multi-center trial. How can we align assessments?
A: Implement a centralized, ongoing quality assurance program.
- Standardized Training: All site raters must complete a mandatory, interactive e-learning module with video vignettes of patient assessments.
- Certification Test: Raters must pass a >90% agreement test against a gold-standard rating panel.
- Regular Re-calibration: Every 3 months, raters review and score 5 new vignettes. Scores falling below 85% agreement trigger re-training.
- Centralized Monitoring: Use a clinical data management system with embedded logic checks that flag assessments falling outside pre-defined, consistent ranges for central review.
Table 1: Impact of Data Quality Dimensions on Regulatory & Research Outcomes
| Dimension | Definition | Key Metric | Target for Regulatory Submissions | Common Source of Error in Volunteer Studies |
|---|---|---|---|---|
| Accuracy | Closeness to true value. | % Error, Z'-factor (>0.5), CV (<20%) | Assay validation reports showing precision & accuracy within ±15%. | Uncalibrated sensors, vague survey questions, transcription errors. |
| Completeness | Proportion of expected data captured. | % Missingness, Missed Time-points | <5% missing for primary endpoints; justification required. | High volunteer burden, poor user interface, lack of reminders. |
| Timeliness | Availability & relevance within timeframe. | Processing Lag, Sample Degradation Rate | Sample processing within validated stability window (e.g., 2h post-collection). | Infrequent data sync, batch processing delays, slow adjudication. |
| Consistency | Uniformity across datasets/sources. | Inter-rater Reliability (Kappa >0.8), Database Rule Violations | Concordance between source data and CRFs; audit trails. | Differing site protocols, uncontrolled terminology, software updates. |
Experimental Protocols
Protocol 1: Assessing the Accuracy & Precision of a Volunteer-Used Digital Health Tool Objective: Validate a consumer-grade activity tracker against a research-grade accelerometer for step count accuracy in a free-living environment. Methodology:
- Participants: Recruit 30 volunteers. Fit each with the validated research-grade device (e.g., ActiGraph GT9X) on the dominant wrist and the consumer-grade device (e.g., Fitbit) on the non-dominant wrist.
- Procedure: Instruct volunteers to proceed with normal activities for 7 days. Devices are worn continuously except during water activities.
- Data Collection: Download step count data from both devices, aligned by timestamp.
- Analysis: Calculate mean absolute percentage error (MAPE) and Bland-Altman limits of agreement between the two devices for daily step counts. Perform an intraclass correlation coefficient (ICC) analysis for consistency.
Protocol 2: Optimizing Survey Completeness vs. Length Trade-off Objective: Determine the maximum survey length (number of items) that maintains >85% completion rate without sacrificing data richness. Methodology:
- Design: Create a core set of 15 essential questions (Core Set). Develop three supplementary modules of 5, 10, and 15 questions each (Module A, B, C).
- Randomization: Randomly assign 400 volunteer participants into four arms: Arm 1 (Core only), Arm 2 (Core + A), Arm 3 (Core + B), Arm 4 (Core + C).
- Procedure: Administer the assigned survey via a mobile app. Log time to completion and dropout points.
- Analysis: Compare completion rates across arms using Chi-square. Use survival analysis (Kaplan-Meier) to model dropout risk as a function of survey length and item complexity.
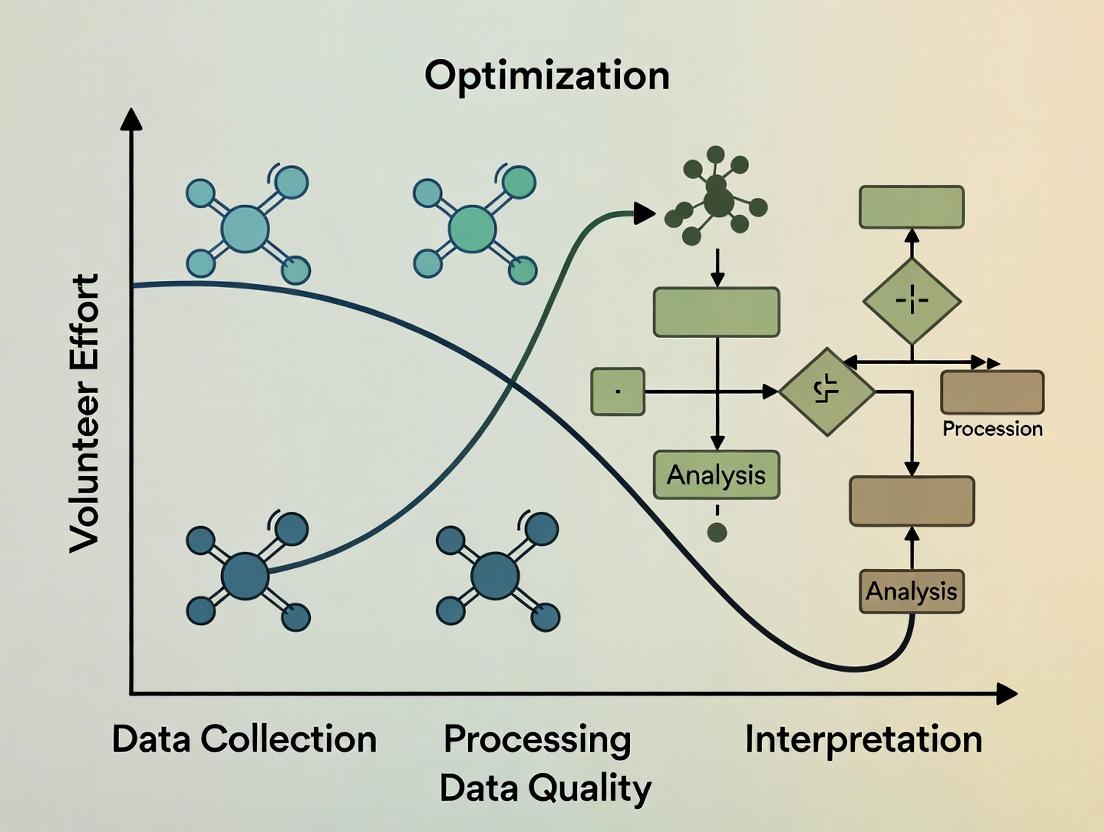
Mandatory Visualizations
Research Data Quality Optimization Workflow
Pathway from Data Capture to Regulatory Acceptance
The Scientist's Toolkit: Research Reagent Solutions
Table 2: Essential Reagents for Biomarker Sample Quality Assurance
| Item | Function | Example Product (Brand) | Key for Data Quality Dimension |
|---|---|---|---|
| Cell-Stabilizing Blood Collection Tubes | Preserves cellular RNA/DNA profile at room temperature for days/weeks, enabling timely processing from remote sites. | PAXgene Blood RNA Tube, Streck Cell-Free DNA BCT | Timeliness, Accuracy |
| Protease & Phosphatase Inhibitor Cocktails | Added immediately to tissue or cell lysates to prevent protein degradation and loss of post-translational modification signals. | Halt Protease & Phosphatase Inhibitor Cocktail (Thermo) | Accuracy, Consistency |
| Quantitative PCR (qPCR) Master Mix with ROX Dye | Provides a passive reference signal to normalize for well-to-well volumetric variations in real-time PCR instruments, improving accuracy. | PowerUp SYBR Green Master Mix (Applied Biosystems) | Accuracy |
| Digital Calibration Standards | Precisely characterized particles or molecules used to calibrate flow cytometers and imaging systems across multiple sites and time points. | Rainbow Calibration Particles (Spherotech), URMC3 Microscope Calibration Slide | Consistency, Accuracy |
| Automated Nucleic Acid Quantitation Assay | Fluorometric assay (e.g., dsDNA HS) for precise, consistent concentration measurement of low-input samples prior to sequencing/library prep. | Qubit dsDNA HS Assay Kit (Thermo) | Completeness, Accuracy |
Technical Support Center
Troubleshooting Guides & FAQs
Q1: Our study participants are reporting high frustration with the daily eDiary, leading to missed entries. How can we reduce cognitive load without compromising data granularity? A: Implement intelligent survey branching. Use initial screening questions to route participants to shorter, more relevant question sets. For example, if a participant reports "no symptom change" from baseline, skip detailed symptom severity grids. This can reduce time burden by ~40%. Validate by comparing data completeness and variance between branched and full protocols in a pilot.
Q2: Volunteer drop-out rates are spiking in our long-term observational study. How do we quantify and address the emotional cost of continued participation? A: Integrate brief, validated emotional burden scales (e.g., a single-item Perceived Burden Scale) at scheduled intervals. Correlate scores with compliance metrics. Protocol: Administer the scale monthly. If a participant's burden score increases by >30% from their baseline, trigger a support protocol: reduce contact frequency, offer a "pause" period, or provide additional context on how their data is used. This proactive approach has shown a 25% reduction in attrition in similar cohorts.
Q3: We need high-frequency physiological data but are concerned about physical intrusion (wearable devices). What's the optimal trade-off between data density and volunteer comfort? A: Conduct a crossover feasibility sub-study. Protocol: Randomize participants to wear a research-grade continuous wearable (e.g., chest strap) for 7 days, followed by a consumer-grade device (e.g., smartwatch) for 7 days, or vice versa. Compare data yield (sampling rate, completeness), technical error rates, and participant comfort scores (via daily survey). Data often shows consumer devices offer >80% data yield with significantly higher comfort and adherence.
Q4: How can we accurately measure the total time commitment for a complex, multi-visit trial? A: Implement a micro-time tracking methodology. Provide participants with a simple log (digital or paper) to record not just travel and site visit time, but also pre-visit preparation (fasting, medication pauses), at-home tasks, and communication time. Average this data across your cohort to calculate the true "hidden" time cost, which is typically 1.8x the estimated core visit time.
Q5: Our lab-based cognitive tests are yielding high-quality data but low compliance. How can we adapt them for remote, unsupervised use without introducing noise? A: Redesign tests using "gamified" elements with embedded data quality checks. Protocol: Convert a standard n-back test into a short, engaging game with adaptive difficulty. Include periodic "catch trials" where a known stimulus is presented to measure attention drift. Use the device's front-facing camera (with consent) to record ambient light and gross movement as proxy measures for testing environment quality. Pilot data shows a compliance increase of 60% with a <15% increase in data variability.
Table 1: Impact of Burden Mitigation Strategies on Data Quality & Compliance
| Burden Dimension | Mitigation Strategy | Typical Reduction in Burden Metric | Impact on Data Completeness | Impact on Data Variance |
|---|---|---|---|---|
| Cognitive Load | Survey Branching | Time: -40% | +12% | No significant change |
| Time Commitment | Visit Consolidation | Total Hours: -25% | -5% | Slight increase in diurnal noise |
| Physical Intrusion | Device Downgrade | Comfort Score: +35% | -15% Data Yield | Increased +/- 5% |
| Emotional Cost | Proactive Support | Attrition: -25% | +18% for remaining participants | Not applicable |
Table 2: Measured Volunteer Burden by Study Type
| Study Type | Avg. Cognitive Load (Survey Length mins/day) | Avg. Time Commitment (Hrs/Month) | Avg. Physical Intrusion Score (1-10) | Avg. Emotional Cost Score (1-10) |
|---|---|---|---|---|
| Phase III RCT (On-site) | 15 | 20 (incl. travel) | 7.5 | 6.2 |
| Remote Observational (Digital) | 25 | 8 (at-home tasks) | 3.1 | 4.8 |
| Bio-sampling Intensive | 8 | 15 | 8.9 | 7.1 |
| Long-Term Cohort | 10 | 5 | 2.5 | 5.5 (cumulative) |
Experimental Protocol: Crossover Feasibility for Device Intrusion
Title: Protocol for Evaluating Wearable Device Burden vs. Data Yield.
Objective: To determine the optimal trade-off between physical intrusion and data quality for continuous physiological monitoring.
Design: Randomized, open-label, two-period crossover.
Participants: N=50 healthy volunteers from target demographic.
Interventions:
- Period 1 (7 days): Device A (Research-grade chest strap, continuous ECG).
- Period 2 (7 days): Device B (Consumer-grade wrist-worn optical sensor).
- Washout: 2 days.
Outcome Measures:
- Primary Burden: Mean physical intrusion score from daily 5-point Likert scale.
- Primary Data Yield: Percentage of valid, artifact-free heart rate intervals per 24-hour period.
- Secondary: Adherence (hours worn/day), comfort questionnaire, signal-to-noise ratio.
Analysis: Paired t-tests to compare burden and yield between devices. Linear mixed model to assess period and carryover effects.
The Scientist's Toolkit: Research Reagent Solutions
Table 3: Essential Materials for Digital Burden Assessment Studies
| Item | Function & Relevance to Burden Research |
|---|---|
| Consumer-Grade Wearables (e.g., Fitbit, Apple Watch) | Enable low-intrusion, continuous passive data collection in ecological settings; critical for assessing real-world time commitment and activity. |
| Experience Sampling (ESM) Apps (e.g., mEMA, Ethica) | Platform to deliver micro-surveys at random or fixed intervals; primary tool for quantifying in-the-moment cognitive and emotional burden. |
| Perceived Burden Scale (PBS) | Validated short-form questionnaire to quantitatively assess the multidimensional burden (emotional, time, physical) from the participant's perspective. |
| Time-Use Diaries (Digital) | Frameworks for participants to log activities in real-time; essential for capturing the "hidden" time costs of study participation beyond scheduled visits. |
| Data Quality Suites (e.g., BrainBaseline, Cambridge Cognition) | Provide remote, gamified cognitive tests with built-in integrity checks (e.g., background noise detection); reduce cognitive burden while ensuring data validity. |
| Secure Video Conferencing & eConsent Platforms | Reduce time/travel burden for visits and enable complex consent processes to be broken into digestible modules, lowering initial cognitive load. |
Visualizations
Study Design: Burden vs Data Quality Trade-off
Pathway: How High Burden Threatens Study Validity
Technical Support Center
Welcome to the Data Quality-Participant Effort Technical Support Hub. This center provides targeted guidance for researchers facing the critical trade-off between data richness and participant burden, framed within the thesis of optimizing this balance for sustainable, high-quality data.
Troubleshooting Guides
Issue: High Attrition Rates in Longitudinal Studies
- Symptoms: Participant drop-off exceeds 30% after the third study visit. Follow-up compliance for daily diaries falls below 50%.
- Diagnosis: Excessive participant burden leading to disengagement.
- Solution:
- Implement Burden Scoring: Use a tool like the "Participant Burden Questionnaire" (see Table 1) to quantify effort before study launch.
- Apply Adaptive Protocols: Design studies where data collection intensity (e.g., weekly surveys vs. daily) adapts based on individual participant compliance or self-reported fatigue signals.
- Micro-randomized Trials (MRTs): For digital interventions, use MRTs to test engagement strategies (e.g., timing of prompts) with minimal added burden, optimizing adherence.
Issue: Poor Quality or Rushed Self-Reported Data
- Symptoms: Straight-lining in surveys, implausibly fast completion times, increased missing entries in ecological momentary assessment (EMA).
- Diagnosis: Participant fatigue leading to satisficing behavior.
- Solution:
- Embedded Data Quality Checks: Integregate attention-check items and response time monitoring to flag low-quality submissions in real-time.
- Dynamic Questionnaire Branching: Use logic to skip irrelevant questions, shortening task length.
- Gamification & Feedback: Introduce subtle progress bars or provide aggregate feedback (e.g., "Your responses are helping identify X pattern") to enhance intrinsic motivation without coercion.
Issue: Sensor/Device Non-Adherence in Digital Phenotyping
- Symptoms: Poor compliance with wearable device wear-time (<10 hours/day), frequent missed passive data streams.
- Diagnosis: Device burden, privacy concerns, or unclear participant value proposition.
- Solution:
- Co-Design Device Protocols: Involve patient advocates in setting realistic wear-time expectations (e.g., 12 hrs/day vs. 24).
- Transparent Data Pathways: Clearly communicate to participants what data is collected and how it is processed (see Diagram 1: Data Flow & Participant Awareness).
- Simplify Charging Logistics: Provide portable chargers or design protocols with explicit charging windows to reduce hassle.
Diagram 1: Data Flow & Participant Awareness (86 chars)
Frequently Asked Questions (FAQs)
Q1: How can we quantitatively estimate participant burden before starting a trial? A: Use a pre-study burden assessment framework. Score different components (time, frequency, emotional load, physical effort) and sum them for a total burden score. Correlate this with predicted adherence from pilot studies.
Table 1: Pre-Study Participant Burden Assessment Matrix
| Data Collection Modality | Time Burden (per instance) | Cognitive/Emotional Load | Physical/Logistical Effort | Burden Score (1-10) |
|---|---|---|---|---|
| 60-min Clinical Visit | 90 mins (incl. travel) | High (medical procedures) | High | 9 |
| 10-item Daily EMA | 2-3 mins | Low-Medium | Low | 3 |
| Continuous Wearable | 1 min (to don/charge) | Very Low | Medium | 2 |
| Weekly Biospecimen (Saliva) | 5 mins | Low | Medium (must remember) | 4 |
Q2: What experimental protocols can dynamically balance data density and participant fatigue? A: Adaptive Trial Designs and Just-in-Time Adaptive Interventions (JITAIs) are key methodologies.
- JITAI Protocol Overview: The goal is to deliver the right intervention component at the right time, based on a participant's state, while minimizing unnecessary interactions.
- Streaming Data Input: Continuous or frequent data (e.g., GPS, step count, self-reported mood) serve as proximal outcomes.
- Decision Points: Pre-specified moments (e.g., 8 PM daily) where an algorithm assesses if a participant is in a "vulnerable state" (e.g., sedentary, low mood).
- Intervention Randomization: If the "vulnerable state" threshold is met, the system randomly assigns (or selects) an intervention (e.g., a motivational message) vs. no message. This tests the intervention's efficacy in context.
- Burden Optimization: The algorithm's sensitivity can be tuned to avoid over-solicitation, directly trading off intervention dose/data points for participant fatigue.
Q3: Our data shows a clear decline in response accuracy after week 4. How do we statistically adjust for this fatigue effect?
A: Incorporate Time-on-Study as a covariate in your longitudinal mixed-effects models. For example:
Response_Accuracy_ij = β0 + β1*(Condition) + β2*(Week_Number_ij) + u_i + e_ij
Where β2 estimates the linear effect of time (fatigue), and u_i is the random intercept for each participant. This controls for the overall decline, allowing you to isolate the true condition effect.
The Scientist's Toolkit: Research Reagent Solutions
Table 2: Essential Tools for Optimizing the Data-Burden Trade-off
| Tool / Reagent | Function in Research | Role in Managing Trade-off |
|---|---|---|
| Digital Phenotyping Platforms (e.g., Beiwe, RADAR-base) | Open-source frameworks for passive (GPS, accelerometer) and active (EMA) data collection via smartphones. | Enable low-burden, continuous data collection in naturalistic settings, reducing need for clinic visits. |
| Consent & Transparency Tools (e.g., "Dynamic Consent" portals) | Digital platforms allowing participants to view, manage, and adjust their data sharing preferences over time. | Builds trust, reduces perceived burden of data misuse anxiety, potentially improving retention. |
| Burden Quantification Surveys (e.g., PBQ, Perceived Burden Scale) | Validated questionnaires administered during trials to measure subjective burden. | Provides real-time metrics to identify breaking points and trigger protocol adaptations. |
Adaptive Randomization Software (e.g., R AdaptiveDesign package) |
Algorithms that adjust allocation probabilities or intervention densities based on accumulating data or participant state. | Core engine for JITAIs and adaptive protocols that minimize unnecessary participant effort. |
Data Quality Suites (e.g., dataquieR in R) |
Software pipelines that perform automated quality checks (missingness, variability, paradoxical responding). | Identifies fatigue-related data degradation early, allowing for corrective contact or statistical control. |
Technical Support Center: Troubleshooting Guides & FAQs
Frequently Asked Questions (FAQs)
Q1: Our sensor-based adherence data shows high variance, potentially compromising trial validity. How can we improve data quality without overburdening participants? A: High variance often stems from inconsistent device use. Implement a tiered engagement protocol:
- Passive Optimization: First, deploy software algorithms (e.g., anomaly detection) to filter non-physiological artifacts from sensor data without participant contact.
- Low-Intensity Nudge: If artifacts persist, trigger an automated, friendly app notification reminding of proper device placement.
- Personalized Support: Only for persistent issues, initiate a brief, supportive call from the study coordinator. This minimizes effort while safeguarding data integrity.
Q2: Participant dropout rates are increasing in our long-term observational study, threatening data continuity. What are effective, ethical retention strategies? A: Retention is a key trade-off between longitudinal data quality and participant burden. Evidence-based strategies include:
Table 1: Participant Retention Strategies & Impact on Burden
| Strategy | Implementation | Expected Impact on Retention | Participant Burden Level |
|---|---|---|---|
| Micro-incentives | Small, periodic thank-you gifts or compensation milestones. | +10-15% | Low |
| Feedback Loops | Share aggregated, anonymized study findings with participants. | +5-10% | Very Low |
| Flexible Scheduling | Allow mobile app-based data entry within a wide time window. | +8-12% | Low |
| Reduced Contact Frequency | Switch from weekly to bi-weekly check-ins for stable cohorts. | May stabilize rates | Significantly Reduced |
Q3: How do we validate self-reported questionnaire data against objective biometrics without breaching trust? A: Use a transparent, consent-driven methodology. During enrollment, explicitly request permission to compare data types for validation. The analysis protocol should:
- Correlate self-reported mood scores (e.g., PHQ-9) with objective sleep patterns from wearable devices.
- Key Reagent Solution: Utilize de-identification hashing algorithms to link datasets while protecting identity, ensuring analysis occurs on pseudonymized data only.
- Present this validation plan in the informed consent form to uphold ethical transparency.
Experimental Protocol: Validating Subjective vs. Objective Data
- Objective: Assess correlation between self-reported fatigue and actigraphy data.
- Method:
- Cohort: 100 participants from chronic condition study.
- Tools: Daily 1-question fatigue VAS (Visual Analog Scale) via app; wrist-worn actigraph.
- Duration: 30 days.
- Analysis: Compute correlation coefficient (Pearson's r) between daily VAS score and actigraph-derived total sleep time & resting heart rate. Statistical significance set at p < 0.05.
- Ethical Guard: Participants can opt-out of this specific analysis while remaining in the main study.
The Scientist's Toolkit: Research Reagent Solutions
Table 2: Essential Tools for Digital Phenotyping & Engagement
| Item / Solution | Function | Example in Practice |
|---|---|---|
| FHIR (Fast Healthcare Interoperability Resources) Standards | Enables secure, standardized data exchange between apps, devices, and EHRs. | Harmonizing patient-reported outcomes from an app with clinical lab data. |
| Federated Learning Algorithms | Trains machine learning models across decentralized devices without sharing raw data. | Developing a global predictive model for adherence while keeping individual data on participants' phones. |
| eConsent Platforms with Multimedia | Enhances participant understanding through interactive, video-based consent forms. | Ensuring true informed consent for complex data sharing and validation protocols. |
| Behavioral "Nudge" Engines | Delivers automated, personalized prompts based on participant behavior patterns. | Sending a reminder to complete a survey only when app usage indicates low-burden timing. |
Visualizations
Technical Support Center: Troubleshooting PROs in DCTs
Thesis Context: This support center addresses common technical and operational challenges in the context of research focused on optimizing the trade-offs between data completeness/quality and volunteer (patient) effort in decentralized clinical trials utilizing PRO measures.
FAQs & Troubleshooting Guides
Q1: In our DCT, PRO completion rates dropped by over 40% after the first month. What are the primary technical and human-factor causes? A: Common causes include:
- Application Fatigue: Overly frequent notifications or complex PRO interfaces.
- Technical Glitches: PRO surveys not loading or failing to submit on certain mobile OS versions.
- Lack of Integration: PRO data not syncing with wearables data, making the effort seem disjointed.
- Battery Drain: The trial app is perceived to excessively drain device battery.
- Troubleshooting Protocol:
- Analyze backend compliance data by device type and OS.
- Deploy a short, anonymous in-app survey to the non-compliant cohort asking about the primary barrier.
- Check server logs for failed submission APIs around the time of scheduled reminders.
- Pilot a simplified PRO version with a subset of participants.
Q2: How do we validate that a PRO collected via a personal smartphone in a DCT is equivalent to data collected on a provisioned device or in-clinic? A: Execute a controlled validation sub-study.
- Protocol: Recruit a small cohort (n=50-100) from your trial population. Have each participant complete the same PRO assessment three ways in a randomized order within a 24-hour window: 1) On their personal device via the DCT app, 2) On a standardized, provisioned tablet, and 3) Via a paper form (the traditional gold standard). Collect metadata (device type, OS, completion time).
- Analysis: Use Intraclass Correlation Coefficient (ICC) for agreement and multivariate analysis to identify if device type is a significant variable influencing score variance.
Q3: Our DCT platform collects PROs, wearable data, and eCOA. How can we technically triage missing data: is it a patient compliance issue or a system integration failure? A: Implement a diagnostic workflow.
Diagram Title: Triage Workflow for Missing PRO Data in DCT
Q4: What are the key technical specifications for ensuring PRO instrument adherence to FDA guidelines when delivered via a DCT app? A: The system must ensure:
- Data Integrity: End-to-end encryption with audit trails. No local caching of unsubmitted responses.
- Precision in Timing: Timestamps for question presentation, modification, and final submission.
- Content Fidelity: The PRO must be rendered exactly as validated, with no alteration of question text, order, or response scale layout across devices.
- Accessibility: Compliance with WCAG 2.1 AA standards for participants with disabilities.
Table 1: Common PRO Compliance Issues in DCTs & Mitigation Impact
| Issue | Typical Incidence Rate in DCTs | Mitigation Strategy | Observed Improvement in Compliance |
|---|---|---|---|
| Notification Overload | 25-40% of participants mute alerts | Personalized reminder scheduling based on user activity | +15-25% |
| Long PRO Burden | 50%+ drop-off for forms >10 min | Micro-randomization to test shorter, adaptive forms | +30% completion rate |
| Technical Friction | 5-15% of submissions fail | Pre-submission local validation & auto-save drafts | +12% submission success |
| Low Digital Literacy | Cohort-dependent (up to 20%) | In-app video tutorials & one-tap helpline | +18% in affected cohort |
Table 2: Data Quality Indicators: DCT vs. Traditional Site-Based PRO Collection
| Data Quality Metric | Traditional Site-Based (Paper) | DCT (Digital PRO) | Notes |
|---|---|---|---|
| Missing Item Level Data | 5-10% | <2% | Digital forms can enforce completeness. |
| Transcription Errors | Potential (manual entry) | Near Zero | Direct digital capture. |
| Ecological Validity | Lower (clinic environment) | Higher (home environment) | Context influences responses. |
| Score Variance | Often Lower | Can be Higher | Reflects real-world fluctuation. |
Experimental Protocol: Measuring the Effort-Quality Trade-off
Title: Protocol for a Micro-Randomized Trial (MRT) to Optimize PRO Reminder Strategies.
Objective: To determine the effect of different reminder message framings ("for your health" vs. "for the study") and delivery times on PRO compliance and data quality (measured by response variance and correlation with wearable activity data).
Methodology:
- Participants: 300 participants enrolled in a DCT for chronic condition X.
- Intervention: Over a 4-week period, participants are micro-randomized daily to receive one of four PRO reminder push notifications:
- Arm A: Altruistic Frame, Morning
- Arm B: Altruistic Frame, Evening
- Arm C: Personal Health Frame, Morning
- Arm D: Personal Health Frame, Evening
- Primary Outcome: PRO completion rate within 2 hours of reminder.
- Secondary Outcome: Within-person standard deviation of PRO scores, adjusted for wearable-measured activity.
- Analysis: Use generalized estimating equations (GEE) to model the proximal effect of reminder type on daily completion, accounting for participant-level factors and temporal trends.
The Scientist's Toolkit: Research Reagent Solutions
Table 3: Essential Components for a PRO-DCT Research Stack
| Item | Function in PRO/DCT Research | Example/Note |
|---|---|---|
| eCOA/PRO Platform | Validated system for delivering questionnaires electronically. | Must be 21 CFR Part 11 compliant and support linguistic validation. |
| Wearable Data Aggregator | Device-agnostic API platform to collect actigraphy, heart rate, etc. | Enables correlation of PRO scores with objective physiological measures. |
| Micro-Randomization Engine | Software for assigning time-varying interventions at the individual level. | Core tool for optimizing engagement strategies in real-time. |
| Digital Phenotyping SDK | Passive data collection from smartphones (anonymized usage, location patterns). | Provides context for PRO responses (e.g., social activity level). |
| Participant Feedback Module | Integrated tool for in-app surveys and experience sampling. | Critical for understanding the volunteer effort perspective. |
| Data Lake with Audit Trail | Centralized repository for all trial data (PRO, wearable, device metadata). | Allows for complex, integrated analysis of quality-effort trade-offs. |
Diagram Title: PRO Data Flow & Optimization Loop in a DCT System
Practical Frameworks for Study Design: Methodologies to Maximize Data Yield Per Participant Effort
Technical Support Center
Troubleshooting Guides & FAQs
Q1: In our early-phase proof-of-concept study, our pharmacokinetic (PK) data shows high variability, making it difficult to draw clear conclusions. Are we collecting too many blood samples, potentially increasing stress and variability?
A: This is a common issue. A 'Fit-for-Purpose' approach suggests aligning sampling intensity with the phase's primary objective. For early-phase studies (Phase I/IIa), the goal is often to confirm exposure and assess safety signals, not to define the precise PK profile.
- Protocol Suggestion: Implement a sparse sampling strategy. Instead of 15-20 samples per subject, use a population PK approach with 2-4 strategically timed samples per subject across a larger cohort. This reduces burden per volunteer while still enabling model-based population parameter estimation.
- Solution: Review your primary endpoint. If it is "Proof of sufficient exposure to test the mechanism," a sparse design is valid. Use the following optimized protocol.
Experimental Protocol: Sparse PK Sampling for Early-Phase Studies
- Cohort Design: Enroll 24 subjects into 4 dose groups (n=6 each).
- Dosing: Administer single ascending oral doses.
- Sparse Sampling Schedule: For each subject, collect 4 blood samples at pre-determined windows (e.g., pre-dose, 0.5-2h post, 2-6h post, and 6-24h post-dose). Assign specific times randomly within these windows across the population to cover the profile.
- Bioanalysis: Use a validated LC-MS/MS method for compound quantification.
- Analysis: Perform population pharmacokinetic (PopPK) modeling (e.g., using NONMEM or Monolix) to estimate key parameters (CL/F, Vd/F, ka) and their variability.
Q2: We need to demonstrate target engagement for our novel kinase inhibitor in a Phase II trial. What is the most volunteer-friendly way to collect robust pharmacodynamic (PD) data without overly invasive serial biopsies?
A: The principle is to use the least invasive method sufficient to reliably measure the PD biomarker correlated with your clinical endpoint.
- Protocol Suggestion: Employ a surrogate tissue approach combined with imaging. If the target is expressed in peripheral blood mononuclear cells (PBMCs), use serial blood draws instead of tissue biopsies. Couple this with a functional imaging endpoint (e.g., FDG-PET for metabolic response) at baseline and key time points.
- Solution: A tiered biomarker strategy reduces patient burden while collecting multi-faceted evidence.
Experimental Protocol: Tiered PD Assessment for a Kinase Inhibitor
- Primary PD (Blood-based): Collect blood samples at pre-dose, 2h, 24h, and Day 15. Isolate PBMCs, lyse, and measure phospho-protein target inhibition via Western Blot or phospho-flow cytometry.
- Secondary/Exploratory PD (Imaging): Perform FDG-PET scans at screening and on Day 15 of treatment to assess metabolic response in the target tissue.
- Correlative Analysis: Link the degree and duration of target inhibition in PBMCs with changes in imaging metrics and early efficacy signals.
Q3: For our large Phase IIIb outcomes study, how do we balance the need for long-term safety data with minimizing the burden on thousands of participants who may be on drug for years?
A: In late-phase studies, the 'Fit-for-Purpose' philosophy shifts towards efficiency at scale and collecting data directly relevant to the benefit-risk profile in a real-world setting.
- Protocol Suggestion: Implement risk-based monitoring and electronic patient-reported outcomes (ePRO). Schedule clinic visits at longer intervals (e.g., every 6 months) for core safety labs and efficacy assessment, while using ePRO diaries on secure tablets/smartphones for frequent symptom and quality-of-life tracking between visits.
- Solution: Streamline in-clinic data collection and decentralize routine reporting.
Experimental Protocol: Hybrid Data Collection for Phase IIIb/IV Study
- In-Clinic Visits (Quarterly/Biannual): Conduct physical exams, comprehensive metabolic panel (CMP), complete blood count (CBC), adverse event (AE) assessment, and primary efficacy endpoint measurement.
- Remote ePRO Collection (Weekly): Patients complete validated symptom questionnaires and global assessment scales via a compliant ePRO app.
- Passive Data (Optional): Integrate data from wearable devices (e.g., step count, heart rate) with patient consent.
- Statistical Analysis: Use mixed models for repeated measures (MMRM) to analyze longitudinal ePRO data, correlating trends with clinic-based outcomes.
Table 1: Recommended Data Collection Intensity by Clinical Trial Phase
| Study Phase | Primary Goal | Recommended Sampling/Data Intensity | Key Trade-off Optimized |
|---|---|---|---|
| Phase I | Safety, Tolerability, PK | Intensive PK (full profile in limited subjects) → Sparse PK (across population) | Volunteer burden vs. Model-informed PK |
| Phase IIa | Proof of Concept, PD | Invasive serial biopsies → Surrogate tissue + imaging | Invasiveness vs. Evidence of target modulation |
| Phase IIb/III | Efficacy, Dose-response | Frequent clinic visits → Hybrid (clinic + ePRO) | Data richness vs. Participant retention & real-world relevance |
| Phase IIIb/IV | Long-term Outcomes, Safety | Traditional CRF-heavy monitoring → Risk-based + remote monitoring | Data volume vs. Operational cost & ecological validity |
Table 2: Comparison of Biomarker Collection Methods
| Method | Data Richness | Volunteer Burden/Cost | Best Fit Phase | Key Consideration |
|---|---|---|---|---|
| Serial Tumor Biopsy | Very High (direct tissue) | Very High (invasive, risky) | Phase I/II (PoC) | Ethical limits, sample feasibility |
| Sparse Blood PK | Moderate (population estimates) | Low (few blood draws) | Phase I/II | Requires robust PopPK modeling |
| PBMC PD Analysis | Moderate-High (surrogate) | Low-Moderate (blood draw) | Phase I/II | Must validate correlation to tissue |
| Imaging (PET/MRI) | High (anatomic/functional) | Moderate (cost, time) | Phase II/III | Excellent for longitudinal, non-invasive assessment |
| ePRO/Wearables | Moderate (subjective/continuous) | Very Low (remote) | Phase III/IV | Validation, patient compliance critical |
Diagrams
Diagram 1: Fit-for-Purpose Decision Pathway
Diagram 2: Tiered Biomarker Strategy Workflow
The Scientist's Toolkit: Research Reagent Solutions
Table 3: Essential Materials for 'Fit-for-Purpose' Biomarker Studies
| Item | Function & Application | 'Fit-for-Purpose' Consideration |
|---|---|---|
| EDTA or Heparin Blood Collection Tubes | Stabilizes blood for plasma/PBMC isolation. Foundation for PK and surrogate PD assays. | Enables lower-volume, multi-analyte draws from a single sample, minimizing burden. |
| Lymphoprep or equivalent | Density gradient medium for isolating viable PBMCs from whole blood. | Critical for high-quality cellular PD biomarkers from a routine blood draw. |
| Phospho-Specific Flow Cytometry Antibodies | Multiplexed detection of phosphorylated signaling proteins in single cells. | Maximizes information from limited PBMC samples; more efficient than Western for sparse sampling. |
| Validated LC-MS/MS Assay Kits | Quantitative bioanalysis of drug concentrations in plasma. | High sensitivity allows for smaller sample volumes and reliable sparse PK data. |
| ePRO Platform (e.g., Medidata Rave, Castor EDC) | Secure, compliant electronic data capture for patient-reported outcomes. | Reduces clinic visit frequency, improves data quality and compliance in late-phase studies. |
| Population PK/PD Modeling Software (NONMEM, Monolix) | Analyzes sparse, unevenly sampled data to estimate population parameters. | The essential analytical tool for making robust inferences from reduced-intensity sampling designs. |
Leveraging Adaptive and Dynamic Study Designs to Reduce Unnecessary Data Points
Troubleshooting Guides & FAQs
Q1: Our interim analysis for an adaptive trial suggests futility, but the conditional power is borderline. Should we stop early or continue? A: This is a classic trade-off between volunteer effort and data quality. Follow this protocol:
- Calculate Conditional Power: Precisely compute conditional power using the current posterior distribution. Use a threshold defined in the charter (e.g., < 20% for futility).
- Check Pre-Planned Rules: Consult the trial's Statistical Analysis Plan (SAP). Deviating from pre-specified rules can introduce bias.
- Assess Operational Burden: Evaluate the remaining volunteer visits, procedures, and resource allocation against the marginal gain in information.
- Recommendation: If conditional power is below the pre-defined threshold, recommending stoppage for futility is statistically sound and ethically aligns with reducing unnecessary volunteer burden.
Q2: During a Bayesian adaptive design, how do we dynamically adjust randomization probabilities without compromising blinding? A: Use a centralized, automated randomization system (IRT). The protocol is:
- System Setup: The IRT interfaces with the trial's data capture system, receiving endpoint data.
- Independent Analysis: A pre-specified Bayesian model within a separate, unblinded statistical team analyzes accumulating data.
- Probability Calculation: The model calculates new allocation probabilities (e.g., favoring the better-performing arm).
- System Update: The unblinded team updates only the randomization algorithm within the IRT.
- Blinded Execution: Investigators and patients remain blinded. The IRT assigns the next patient using the updated probabilities, maintaining trial integrity.
Q3: Our platform trial's shared control arm data is becoming heterogeneous due to different experimental arms. How do we maintain data quality? A: Implement robust dynamic borrowing models. Methodology:
- Choose Borrowing Method: Select a model like Hierarchical Modeling (HM), Power Prior, or Commensurate Prior.
- Assess Commensurability: Continuously test for similarity between the current control data and historical/shared control data using pre-defined metrics (e.g., baseline covariate balance, outcome trends in a common run-in period).
- Dynamic Adjustment: The model automatically down-weights (borrows less from) the shared control data if heterogeneity is detected, preserving the integrity of the current arm's comparison.
- Benefit: This prevents dilution of treatment effect signals, ensuring data quality while still leveraging shared data to reduce control group size.
Q4: In a MAMS (Multi-Arm, Multi-Stage) design, how do we efficiently add a new treatment arm mid-trial? A: This requires a pre-planned, dynamic protocol amendment workflow:
- Pre-Specification: The trial master protocol must outline the criteria and process for adding new arms (e.g., based on external scientific evidence).
- Go/No-Go Decision: A dedicated oversight committee reviews the new evidence against pre-defined scientific validity criteria.
- Statistical Adjustment: The alpha-spending function and power are recalculated for the remaining stages, often using simulation, to control the overall Type I error.
- Operational Integration: The new arm is added with its own randomization allocation. The shared control arm and infrastructure are leveraged, minimizing new setup effort.
Q5: What are common pitfalls in implementing response-adaptive randomization (RAR) that lead to data loss? A: Key issues and solutions:
- Pitfall 1: High Variability Early On. Early outcome-adaptive shifts can be based on noisy data.
- Solution: Use a burn-in period with fixed 1:1 randomization until sufficient initial data is collected.
- Pitfall 2: Operational Lag. Delays in data entry and outcome assessment cause randomization based on stale data.
- Solution: Implement rapid outcome assessment (e.g., central lab, 72-hour readouts) and stringent data entry deadlines.
- Pitfall 3: Complex Logistics. Managing different drug supply for shifting probabilities.
- Solution: Utilize centralized packaging and distribution via IRT to handle dynamic allocation seamlessly.
Key Quantitative Data on Adaptive Designs
Table 1: Impact of Adaptive Designs on Sample Size & Data Points
| Design Type | Traditional Design Sample Size (Mean) | Adaptive Design Sample Size (Mean) | Average Reduction in Unnecessary Data Points | Key Enabling Factor |
|---|---|---|---|---|
| Group Sequential Design (GSD) | 100% | 85-90% | 10-15% | Early stopping for efficacy/futility |
| Sample Size Re-estimation (SSR) | 100% | 80-110%* | Variable, prevents under/overpowering | Blinded or unblinded reassessment of variance |
| Bayesian Adaptive Randomization | 100% | 75-85% | 15-25% | Dynamically allocating pts to superior arm |
| MAMS Platform Trial | 100% (per arm) | 60-80% (per arm) | 20-40% (via shared control) | Shared infrastructure & control arms |
*SSR can increase size if initial assumptions are too optimistic.
Table 2: Data Quality Metrics in Adaptive vs. Fixed Trials
| Metric | Fixed Design Benchmark | Adaptive Design Performance | Notes |
|---|---|---|---|
| Type I Error Control | 5% (Alpha) | Maintained at 5% with proper planning | Critical; requires simulation. |
| Operational Bias Risk | Low | Medium-High (if not masked) | Mitigated by Firewalls & IRT. |
| Data Completeness Rate | Typically High | Can be lower without stringent processes | Requires proactive QC. |
| Analysis Complexity | Standard | High | Needs advanced statistical expertise. |
Experimental Protocols
Protocol A: Implementing a Group Sequential Design (GSD) with O'Brien-Fleming Boundaries
- Objective: To allow for early trial termination while controlling overall Type I error.
- Design Phase:
- Define maximum number of interim analyses (K) (e.g., K=3).
- Calculate O'Brien-Fleming alpha-spending function using Lan-DeMets method. This allocates very little alpha to early looks, preserving power.
- Pre-specify efficacy and futility boundaries (Z-score thresholds) for each interim in the SAP.
- Execution Phase:
- At each pre-planned interim analysis, an independent Data Monitoring Committee (DMC) reviews unblinded data.
- The test statistic (e.g., Z-score for primary endpoint) is calculated.
- Decision Rule: If the test statistic crosses the pre-defined efficacy boundary, recommend early stop for success. If it crosses the futility boundary, recommend early stop for futility. Otherwise, continue to next stage.
- Outcome: Reduces volunteer exposure to inferior treatments or shortens time to beneficial treatment availability.
Protocol B: Blinded Sample Size Re-estimation (SSR) Based on Nuisance Parameter
- Objective: To adjust sample size based on a better estimate of a nuisance parameter (e.g., pooled variance, control group event rate) without unblinding treatment effects.
- Design Phase:
- In the SAP, specify the nuisance parameter to be re-estimated, the timing of the interim (e.g., after 50% of subjects complete), and the method for re-estimation.
- Execution Phase:
- At the interim point, a blinded statistician receives only the pooled data (treatment codes masked as A/B).
- The statistician calculates the re-estimated parameter (e.g., pooled variance σ²).
- Using the original effect size assumption, a new total sample size (N') is calculated using the standard formula.
- The sample size is adjusted upward or downward, typically with a pre-defined cap (e.g., no more than double the original).
- Outcome: Ensures the trial is adequately powered, protecting the investment and volunteer effort from a failed trial due to incorrect initial assumptions.
Visualizations
The Scientist's Toolkit: Research Reagent Solutions
Table 3: Essential Tools for Implementing Adaptive Clinical Trials
| Item / Solution | Function in Adaptive/Dynamic Trials |
|---|---|
| Interactive Response Technology (IRT) | Dynamically manages patient randomization (including RAR), drug supply allocation, and site management in real-time. The operational backbone. |
| Clinical Trial Management System (CTMS) with API | Tracks trial progress and site performance; integrates with IRT and EDC to provide operational data for interim decisions. |
| Electronic Data Capture (EDC) with Real-Time Data | Ensures critical endpoint and safety data are available rapidly for interim analyses and adaptive algorithm updates. |
| Statistical Software (R, SAS, EAST) | Advanced software capable of complex simulations for design, Bayesian analysis, and generating boundary tables for interim analyses. |
| Unblinded Data Analysis "Firewall" | A secured, independent team/process for conducting interim analyses to prevent operational bias and maintain trial integrity. |
| Master Protocol Template | A standardized framework for designing platform or umbrella trials, including governance, statistical, and operational sections. |
Technical Support Center: Troubleshooting & FAQs
Frequently Asked Questions (FAQs)
Q1: In a study comparing passive smartphone sensor data (e.g., GPS) with active Ecological Momentary Assessment (EMA) prompts for assessing mobility, participants in the passive cohort are exhibiting significantly higher dropout rates. What could be the cause and how can we mitigate it?
A: High dropout in passive data collection, despite its low apparent burden, often stems from "consent friction" and background battery drain. Participants may initially consent but revoke permissions later when they receive system warnings about background data usage.
- Mitigation Protocol: Implement a staged consent and education process. During onboarding, use in-app tutorials to explain why continuous background data is needed, how it will be used, and its specific impact on battery life (e.g., "This may reduce battery by ~10% per day"). Pair this with robust battery optimization coding practices, such as batching and throttling data transmission when the device is not charging.
Q2: We are observing high variance in heart rate variability (HRV) data collected passively from consumer-grade wearables. How can we determine if this is biological signal or noise introduced by the device/platform?
A: This requires a controlled validation sub-study.
- Troubleshooting Guide:
- Control Experiment: Recruit a small sub-cohort (n=10-15) to simultaneously wear the consumer wearable and a research-grade ECG chest strap (e.g., Polar H10) during a standardized protocol (rest, paced breathing, light exercise).
- Data Synchronization: Precisely time-sync data streams from both devices.
- Analysis: Calculate HRV metrics (e.g., RMSSD, SDNN) from both sources for identical time windows. Use intra-class correlation coefficients (ICC) and Bland-Altman plots to assess agreement.
- Action: If ICC is poor (<0.5), develop and apply a device-specific signal processing or calibration filter before main study analysis.
Q3: Active EMA prompts are causing significant user fatigue, leading to rushed or nonsensical responses. How can we adjust the protocol to maintain data quality?
A: This is a classic trade-off between frequency and burden. Implement an adaptive prompting algorithm.
- Solution Protocol:
- Initial Phase: Begin with a higher frequency schedule (e.g., 5 random prompts/day) for the first week to establish a baseline of compliance patterns.
- Adaptation Logic: Program the DHT app to analyze response latency and patterns. If a user consistently ignores prompts during work hours (e.g., 9 AM-5 PM), algorithmically reduce prompts during that window.
- Re-engagement: Introduce "burst" designs—increasing prompts for 48-hour periods following a detected physiological event (e.g., a period of very low activity from passive data) to capture context.
Q4: When integrating passive data from multiple sources (wearable, smartphone, smart home device), timestamps are misaligned, making merged datasets unusable. What is the standard procedure for temporal alignment?
A: This is a data engineering prerequisite. Follow this synchronization workflow.
Diagram Title: Data Stream Synchronization Workflow
- Protocol:
- Extract Metadata: For each data stream, extract the local device timestamp and the timezone offset at the moment of recording.
- Identify Paired Events: Define a shared event captured by multiple devices (e.g., "device charging start" logged by both phone and wearable). Use this to calculate device clock drift offsets.
- Transform to Common Timeline: Convert all timestamps to Coordinated Universal Time (UTC) using the recorded offset, then apply the drift correction factor.
- Validation: Post-alignment, check for logical inconsistencies (e.g., a reported "sleep" period from a wearable that overlaps with "app use" data from the phone).
Table 1: Passive vs. Active Data Collection Characteristics
| Parameter | Passive Collection (e.g., GPS, Accelerometer) | Active Collection (e.g., EMA, eDiary) |
|---|---|---|
| Participant Burden | Very Low (unobtrusive, background) | Moderate to High (requires attention/interruption) |
| Data Density | Very High (continuous streams) | Low to Medium (discrete timepoints) |
| Context Richness | Low (infers context from sensors) | High (direct subjective input) |
| Primary Bias Risk | Selection Bias (device ownership/use) | Recall & Response Bias (fatigue, social desirability) |
| Typical Compliance* | 75-95% (of enrolled device time) | 50-80% (prompt response rate) |
| Key Technical Hurdle | Data volume, battery drain, signal processing | Smart prompting, UI/UX, engagement |
*Compliance rates are illustrative medians from recent literature (2022-2024) and are highly study-dependent.
Table 2: Validation Study Results for Consumer Wearable HRV vs. Research-Grade ECG
| Metric (5-min Rest) | Consumer Wearable (Mean ± SD) | Research ECG (Mean ± SD) | Intra-class Correlation (ICC) | Recommended Action |
|---|---|---|---|---|
| RMSSD (ms) | 42.3 ± 10.5 | 38.7 ± 9.2 | 0.72 (Moderate) | Apply linear correction factor. |
| SDNN (ms) | 65.8 ± 15.1 | 58.4 ± 12.8 | 0.45 (Poor) | Do not use SDNN from this device; rely on RMSSD. |
| Valid Samples | 92% of sessions | 100% of sessions | N/A | Flag sessions with <80% wearable signal quality. |
Experimental Protocols
Protocol 1: Validating Passive Digital Mobility Metrics Against a Clinical Gold Standard
Objective: To establish the criterion validity of smartphone-derived step count and GPS circular area (a measure of mobility radius) against the Timed Up-and-Go (TUG) test and the 6-Minute Walk Test (6MWT).
- Participant Cohort: N=50 participants with a range of mobility (healthy controls to mild impairment).
- DHT Setup: Install study app on participant smartphones with permissions for continuous accelerometer and GPS data collection for 7 days.
- Clinical Visit: On day 7, participants perform:
- TUG Test: Time to rise from a chair, walk 3 meters, turn, walk back, and sit down. Performed 3x; average recorded.
- 6MWT: Total distance walked on a pre-measured flat corridor in 6 minutes.
- Digital Metric Calculation:
- Steps: Sum daily average steps from the smartphone sensor over the 7-day lead-in.
- GPS Circular Area: Calculate the 95% confidence ellipse area from all GPS pings per day, then average.
- Analysis: Perform Pearson correlation between daily average steps and 6MWT distance, and between GPS area and TUG time. Target: r > 0.7 for convergent validity.
Protocol 2: Adaptive EMA Prompting to Reduce Burden
Objective: To maintain response rate (>80%) and data quality while minimizing prompt fatigue over a 30-day study.
- Algorithm Design: Develop an algorithm with three prompting "zones":
- Green Zone (High Probability): Times of historically high response rates (>90%). Schedule 70% of prompts here.
- Yellow Zone (Medium Probability): Times of moderate response rates (50-90%). Schedule 25% of prompts.
- Red Zone (Low Probability): Times of low response rates (<50%). Schedule 5% of prompts (to check for habit change).
- Study Design: Randomized control trial (RCT). Arm 1 (n=50): Static random prompts (8/day). Arm 2 (n=50): Adaptive prompts (starting at 8/day, adjusting after day 7).
- Primary Metrics:
- Compliance: % of prompts answered.
- Latency: Time to response.
- Data Quality: Word count in open-text responses, variance in Likert-scale responses.
- Evaluation: Compare compliance and data quality metrics between arms at day 30 using t-tests. Target: Arm 2 shows non-inferior data quality with significantly higher compliance and lower perceived burden (via post-study survey).
The Scientist's Toolkit: Key Research Reagent Solutions
| Item | Function in DHT Research | Example Products/Tools |
|---|---|---|
| Research-Grade Validation Device | Provides a gold-standard signal to validate the accuracy and precision of consumer DHTs. | ActiGraph GT9X (activity), Polar H10/Firstbeat (HR/HRV), CamNtech MotionWatch 8 (sleep). |
| High-Fidelity Data Aggregation Platform | Securely collects, time-aligns, and standardizes multimodal data streams from various DHTs via APIs. | Beiwe, RADAR-base, Fitbit/Apple Health Kit connectors via custom pipelines. |
| Open-Source Signal Processing Library | Cleans and processes raw digital signals (e.g., accelerometer, photoplethysmography) to extract clinical features. | Python: heartpy, scikit-digital-health. R: GGIR for accelerometry. |
| Regulatory & Compliance Framework | Ensures the digital data collection meets ethical (informed consent) and regulatory (21 CFR Part 11, GDPR) standards for clinical research. | REDCap for eConsent, MyDataHelps platform with audit trails, AWS/GCP with HIPAA-compliant configurations. |
| Participant-Facing App Framework | Allows for rapid prototyping and deployment of custom study apps for active (EMA) and passive data collection. | Apple ResearchKit, Google Fit Platform, Expidata, Cardiogram. |
Technical Support Center
Troubleshooting Guide: Common Issues in Tool Optimization
Q1: During cognitive interviewing, participants struggle to articulate their thought process, resulting in poor feedback on question wording. How can I improve this? A: This is a common issue where the "thinking aloud" protocol breaks down. Implement a three-stage prompting system:
- Initial Prompt: "Please say everything that comes to mind as you read this question."
- If silent for >5 seconds, use a neutral probe: "What are you thinking about right now?"
- If still struggling, use a specific probe: "What does the term '[KEYWORD FROM QUESTION]' mean to you here?" Avoid leading the participant. Practice with pilot volunteers not involved in the main study to refine prompts, balancing the need for rich verbal data with volunteer cognitive effort.
Q2: My usability test shows a high error rate on a specific eCRF (electronic Case Report Form) page, but participants don't report it as difficult in post-task questionnaires. Which metric should I trust? A: Trust the observed performance data (error rate, time on task) over the subjective rating. This discrepancy highlights the need for triangulation. Follow this protocol:
- Review screen recordings: Identify where clicks or keystrokes deviate from the expected path.
- Conduct a retrospective cognitive interview: Replay the screen recording to the participant and ask, "I noticed you hesitated here. Can you recall what you were trying to do at this point?"
- Prioritize fixing usability issues that objectively degrade data quality (e.g., wrong field entries), even if unreported, as they directly impact your thesis variable of data quality.
Q3: How many participants are sufficient for cognitive interviewing and usability testing in this pre-study phase? A: Literature indicates a saturation point for usability issues is typically found with a small sample. The goal is iterative refinement, not statistical generalization.
| Test Phase | Recommended Sample Size | Key Rationale | Trade-off Consideration |
|---|---|---|---|
| Cognitive Interview | 5-8 per major tool revision | Identifies majority of comprehension problems and semantic issues. | Balances resource expenditure against the risk of launching a flawed tool. |
| Usability Test | 5-8 per major interface | Uncovers >80% of major usability problems (Nielsen's Law of Diminishing Returns). | Optimizes volunteer (tester) effort in the pre-study phase to prevent greater effort later. |
| Total Iterations | 2-3 cycles | Allows for "Test → Fix → Retest" to verify solutions. | Manages total pre-study timeline while ensuring meaningful optimization. |
Q4: Our sensor-based data collection app is failing to upload data in low-network field conditions, risking data loss. How can we test for this? A: You must simulate adverse conditions. Develop a controlled usability test protocol:
- Protocol: Set up a network simulation tool (e.g., Chrome DevTools Network Throttling, hardware network emulator).
- Task: Ask participants to complete a standard data entry task while connectivity degrades from 4G to 3G to "offline."
- Measure: a) Does the app provide a clear "saved locally" indicator? b) Does it automatically resume upload when connectivity is restored? c) Is the user prompted to try again?
- Observe: Participant anxiety and comprehension of the app's state. The solution must balance data integrity (no loss) with volunteer effort (minimal retyping).
FAQs: Optimizing Tools for Data Quality vs. Volunteer Effort
Q: What's the most efficient order for pre-study testing: cognitive interviews or usability testing first? A: Conduct cognitive interviews first. Logic flow: You must ensure participants understand the questions (cognitive interview) before you can efficiently test the mechanics of answering them (usability test). Fixing wording issues after usability testing wastes resources.
Q: How do I quantify improvements from pre-study optimization to support my thesis? A: Define and compare metrics before and after each optimization cycle.
| Metric | Pre-Optimization (Mean) | Post-Optimization (Mean) | Measurement Method | Interpretation for Thesis |
|---|---|---|---|---|
| Task Completion Rate | e.g., 65% | e.g., 95% | Usability test observation | Higher completion improves data comprehensiveness (quality). |
| Average Time on Task | e.g., 120 sec | e.g., 75 sec | Usability test log data | Reduced time decreases volunteer effort and potential for frustration-related errors. |
| Critical Error Rate | e.g., 25% | e.g., 5% | Data validation check against gold standard | Directly correlates with improved data accuracy (quality). |
| User Satisfaction (SUS) | e.g., 55/100 | e.g., 82/100 | System Usability Scale questionnaire | Higher satisfaction may improve long-term volunteer retention, reducing recruitment effort. |
Q: Can I use the same volunteers for both cognitive interviews and usability testing? A: It is not recommended for the same tool iteration. Exposure in the cognitive interview biases their behavior in the usability test. Use separate, naive cohorts for each test type per iteration to get clean data on both comprehension and interface interaction.
Experimental Protocol: Combined Cognitive Interview & Usability Test
Title: Iterative Protocol for Pre-Study Data Collection Tool Optimization.
Objective: To identify and rectify comprehension (cognitive) and operational (usability) flaws in a data collection tool (e.g., eCRF, survey, app) in a single integrated session, optimizing for future data quality and minimizing volunteer effort.
Methodology:
- Participant Recruitment (n=5-8 per iteration): Recruit from a population analogous to the final study volunteers. Obtain informed consent.
- Setup: Record screen, audio, and participant's face (if possible) with appropriate releases.
- Phase 1 – Pure Cognitive Interview: Present the tool as a static PDF or prototype with no interactivity. Use "think aloud" and verbal probing to assess comprehension, recall, and judgment related to each question/item.
- Phase 2 – Usability Test: Provide the functional, interactive tool (e.g., live website, app). Assign realistic data entry tasks. Observe behavior silently; do not provide help. Record errors, hesitations, and completion time.
- Phase 3 – Retrospective Probe: For any observed usability issue, replay the recording and ask non-leading questions (e.g., "What was your goal here?") to understand the root cause.
- Analysis & Redesign: Thematically analyze findings from all phases. Prioritize issues that threaten data validity. Redesign the tool.
- Iterate: Repeat Steps 1-6 with a new cohort until critical issues are resolved (typically 2-3 iterations).
Visualizations
Title: Iterative Optimization Workflow for Study Tools
Title: Core Trade-off Explored in Pre-Study Optimization
The Scientist's Toolkit: Research Reagent Solutions
| Item/Category | Function in Pre-Study Optimization |
|---|---|
| Screen Recording Software (e.g., Camtasia, OBS) | Captures all on-screen interactions, mouse movements, and keystrokes during usability testing for detailed retrospective analysis. |
| Prototyping Tool (e.g., Figma, Adobe XD) | Creates high-fidelity, interactive mockups of eCRFs or apps for usability testing without backend development. |
| Network Simulation Tool (e.g., Chrome DevTools, Apple Network Link Conditioner) | Artificially degrades network conditions to test offline functionality and data resilience of mobile data collection tools. |
| System Usability Scale (SUS) | A standardized, reliable 10-item questionnaire providing a quick global view of subjective usability and learnability. |
| Dedicated Interview Room | A quiet, controlled environment free from distractions to conduct cognitive interviews and ensure high-quality audio recording. |
| Qualitative Analysis Software (e.g., NVivo, Dedoose) | Aids in thematically coding and analyzing textual/verbal data from cognitive interview transcripts and open-ended probes. |
Technical Support Center
Troubleshooting Guides & FAQs
Q1: In our branching questionnaire, users are being presented with contradictory follow-up questions. What is the likely cause and how can we fix it? A: This is typically a logic conflict in your skip/display rules. Ensure your conditional logic (e.g., "IF Question A score > 5, THEN skip to Section C") is mutually exclusive and uses a consistent variable state. Debug by creating a test user and tracing the path with a flowchart tool. Within the thesis context, this error directly inflates perceived volunteer effort without improving data quality.
Q2: How do I calibrate new questions into an existing IRT-powered questionnaire without disrupting ongoing data collection? A: Use an online calibration design. Embed new experimental items alongside a fixed set of existing, well-calibrated "anchor" items. Direct only a randomized subset of participants to see the new items. Use the responses to estimate the new items' parameters (difficulty, discrimination) on the same scale as the anchor items, ensuring continuity. This aligns with the thesis goal of iterative optimization without burdening the entire volunteer pool.
Q3: Our data shows a high dropout rate at a specific questionnaire branch. How can we determine if the question is too difficult or irrelevant?
A: Analyze the differential effort. First, check the IRT parameters: a very high difficulty (b > 3.0) suggests the item is too challenging for your population. Second, examine response time logs for slowdowns at that node. Third, implement a prompt asking users who skip the question for a reason (e.g., "Too difficult," "Not applicable to me"). This multi-method troubleshooting isolates whether the trade-off is skewed toward unacceptable effort.
Q4: What is the minimum sample size required for a stable IRT calibration in this context? A: While larger is always better, a common rule of thumb for the 2-Parameter Logistic (2PL) or Graded Response models is N ≥ 500 for stable parameter estimation. For polytomous (rating scale) items, you may need more. See the table below for guidelines.
Table 1: Minimum Sample Size Guidelines for IRT Calibration
| IRT Model | Minimum Sample Size (Participants) | Key Consideration |
|---|---|---|
| Rasch (1PL) | 250 - 500 | Robust to smaller samples, but person measures may be less precise. |
| 2PL / 3PL | 500 - 1000 | Essential for accurate discrimination & guessing parameter estimation. |
| Graded Response | 500 - 750 | More categories per item can increase data requirements. |
| Online Calibration | 100 per item form | For embedding new items in operational tests. |
Q5: How can we validate that our modular questionnaire is actually reducing irrelevant questions without sacrificing data granularity? A: Conduct a controlled A/B experiment.
- Protocol: Randomly assign volunteers to two groups.
- Group A (Control): Receives the full, linear questionnaire.
- Group B (Experimental): Navigates the new modular/branching questionnaire.
- Metrics: Compare: 1) Average completion time (effort proxy), 2) Dropout/completion rate, 3) Data Yield: The amount of usable, non-missing data per domain per user, and 4) Scores on a short, common validation scale administered at the end (quality check).
- Thesis Alignment: A successful implementation will show statistically significant reduction in effort (time) for Group B while maintaining equivalent Data Yield and validation scores, optimizing the core trade-off.
Experimental Protocol: Validating Questionnaire Efficiency
Title: A/B Test for Branching Logic Efficiency in Volunteer-Based Research.
Objective: To quantitatively compare the trade-off between data quality and volunteer effort in a linear versus a smart modular questionnaire.
Methodology:
- Participant Recruitment: Recruit a target sample (N≥1000) from the volunteer research platform. Ensure informed consent.
- Randomization: Use a random number generator to assign participants to Group A (Linear) or Group B (Modular).
- Intervention:
- Group A: Presented with a static questionnaire containing all possible items across all domains.
- Group B: Presented with an initial "routing" module. Subsequent modules (e.g., detailed symptom domains) are presented based on pre-defined logic using IRT trait level estimates and substantive rules.
- Data Collection: Log timestamps for start/end of each module, all responses, and dropout events. All participants complete a 5-item "gold standard" validation scale at the end.
- Analysis:
- Primary Effort Metric: Mean completion time difference (Group B vs. A).
- Primary Quality Metric: Mean score difference on the validation scale.
- Secondary Metric: Compare "data density" (non-missing responses per minute of effort).
Visualizations
Diagram 1: Modular Questionnaire Decision Logic Workflow
Diagram 2: IRT Item Calibration & Routing Relationship
The Scientist's Toolkit: Research Reagent Solutions
Table 2: Essential Tools for Implementing Smart Questionnaires
| Tool / Reagent | Function in Research | Example / Note |
|---|---|---|
IRT Software (R mirt) |
Statistical engine for calibrating items, estimating person parameters (θ), and simulating adaptive tests. | The mirt package is the industry standard for flexible multidimensional IRT modeling. |
| Survey Platform with API | Hosts the questionnaire, manages user sessions, and allows dynamic logic via external calls. | Platforms like Qualtrics, REDCap, or LimeSurvey offer API access for custom routing. |
| Logging Database | Stores timestamps, response sequences, and decision path flags for detailed effort analysis. | Crucial for post-hoc validation of the branching logic and dropout analysis. |
| A/B Testing Framework | Randomly assigns participants to different questionnaire versions for controlled comparison. | Can be built into the survey platform or managed externally (e.g., Google Optimize). |
| Pilot Volunteer Pool | Provides the initial data sample required for stable calibration of item parameters before full launch. | A representative sample of at least 500 participants is a key "reagent" for quality. |
Solving Common Pitfalls: Troubleshooting Strategies for High-Burden, Low-Quality Data Scenarios
Technical Support Center
Troubleshooting Guides & FAQs
FAQ 1: What constitutes a "high" missing data rate, and what should I do when I encounter it?
Answer: A missing data rate exceeding 5-10% per variable, or 15-20% for a participant's record, is generally considered a red flag warranting investigation. The first step is to diagnose the pattern using Little's MCAR test.
- If data is Missing Completely At Random (MCAR): Proceed with listwise deletion or use appropriate imputation methods (e.g., Multiple Imputation by Chained Equations - MICE).
- If data is Missing Not At Random (MNAR): This is a critical bias. You must analyze the mechanism (e.g., sensitive questions causing drop-offs) and consider statistical models like selection models or pattern-mixture models that account for the missingness mechanism.
Experimental Protocol for Diagnosing Missing Data Pattern:
- Data Preparation: Clean your dataset and code missing values appropriately (e.g.,
NA). - Perform Little's MCAR Test: Use statistical software (e.g., R's
naniarorBaylorEdPsychpackage, SPSS Missing Value Analysis). - Interpretation: A non-significant p-value (p > 0.05) suggests data may be MCAR. A significant p-value (p < 0.05) indicates data is likely MNAR or MAR.
- Pattern Examination: Create visualizations (e.g., missingness matrix plot using
VIM::aggrin R) to identify if missingness clusters in specific variables or participant subgroups.
FAQ 2: How can I detect and mitigate response bias (e.g., acquiescence, straight-lining) in survey data?
Answer: Response bias threatens internal validity. Detection requires proactive questionnaire design and post-hoc analysis.
Mitigation Protocol:
- Prevention in Design:
- Use reverse-coded items to catch acquiescence.
- Incorporate instructed response items (e.g., "For quality control, please select 'Strongly Disagree' for this statement").
- Distribute attention-check questions throughout the survey.
- Vary response scale anchors to prevent automatic responses.
- Post-Hoc Detection & Cleaning:
- Straight-lining: Flag participants with zero variance in their responses across a battery of items (e.g., all "4" on a 7-point Likert scale for 10 consecutive questions).
- Analysis: Calculate intra-individual response standard deviation. Participants with a standard deviation below a defined threshold (e.g., 0.5) over a set of items should be flagged for review or exclusion.
- Mahalanobis Distance: Calculate to identify multivariate outliers indicative of aberrant response patterns.
Data Table: Common Response Biases and Detection Methods
| Bias Type | Description | Quantitative Detection Method | Threshold for Flagging |
|---|---|---|---|
| Acquiescence | Tendency to agree with all items. | High average score + lack of variance on reverse-coded items. | Score > 90th percentile & failed reverse-code check. |
| Straight-Lining | Identical responses to all items in a matrix. | Zero or near-zero standard deviation across a block of items. | Standard Deviation < 0.5 for a 10+ item block. |
| Careless Responding | Random or inattentive answers. | Failed instructed response items; implausibly fast completion time. | >1 failed instructional check; time < 2 sec/item. |
| Social Desirability | Answering in a culturally acceptable manner. | High score on a social desirability scale (e.g., Marlowe-Crowne). | Score > established normative cut-off (e.g., >15 on 33-item scale). |
FAQ 3: How do I analyze participant dropout (attrition) patterns to assess bias?
Answer: Systematic dropout can invalidate longitudinal results. The key is to compare baseline characteristics of completers vs. dropouts.
Experimental Protocol for Attrition Bias Analysis:
- Define Groups: Segment participants into
CompletersandDropouts. - Baseline Comparison: Conduct independent t-tests (for continuous variables like age, baseline score) and chi-square tests (for categorical variables like gender, treatment group) on all baseline demographic and key outcome measures.
- Calculate Standardized Differences: For each variable, compute the standardized mean difference (SMD) or Cohen's d between groups. An SMD > 0.10 indicates a meaningful imbalance.
- Survival Analysis: Use a Kaplan-Meier curve and log-rank test to see if dropout rates differ significantly between study arms (e.g., intervention vs. control).
- Action: If dropouts differ systematically from completers (SMD > 0.10 on critical variables), your findings may not be generalizable. Consider using sensitivity analyses like baseline observation carried forward (BOCF) or modeling dropout with mixed models for repeated measures (MMRM).
Data Table: Analyzing Attrition Bias in a 12-Week Clinical Trial
| Baseline Variable | Completers (n=85) | Dropouts (n=15) | p-value (t-test/χ²) | Standardized Mean Difference (SMD) |
|---|---|---|---|---|
| Age, Mean (SD) | 45.2 (10.1) | 48.9 (11.5) | 0.21 | 0.33 |
| Female, n (%) | 42 (49.4%) | 5 (33.3%) | 0.24 | 0.16 |
| Baseline Pain Score | 6.7 (1.8) | 7.9 (1.5) | 0.01 | 0.71 |
| Treatment Arm, n (%) | 40 (47.1%) | 10 (66.7%) | 0.15 | 0.19 |
Interpretation: The significant difference in Baseline Pain Score (SMD=0.71) is a major red flag, suggesting dropouts had more severe symptoms, biasing the final outcome.
The Scientist's Toolkit: Key Research Reagent Solutions
| Item | Function in Volunteer Effort / Data Quality Research |
|---|---|
| Digital Consent Platforms (e.g., REDCap, Qualtrics) | Streamlines ethical review compliance, tracks consent versioning, and reduces administrative burden on volunteers. |
| Experience Sampling Method (ESM) Apps (e.g., mEMA, Ethica) | Enables real-time data capture in ecological settings, reducing recall bias but requiring careful management of volunteer notification fatigue. |
| Participant Management Systems (e.g., SONA, CloudResearch) | Centralizes recruitment, scheduling, and compensation, optimizing volunteer effort and reducing dropout due to poor communication. |
| Data Quality Dashboards (e.g., R Shiny, Tableau) | Provides real-time visualization of missing data rates, response patterns, and attrition, allowing for proactive intervention. |
Automated Imputation Software (e.g., R mice package, SPSS AM) |
Applies robust statistical methods (Multiple Imputation) to handle missing data while quantifying the uncertainty introduced, preserving sample size and power. |
Diagram 1: Workflow for Identifying Data Quality Red Flags
Diagram 2: Participant Dropout Bias Assessment Pathway
Technical Support Center: Troubleshooting Guide & FAQ
This center addresses common issues in participant-based research, framed within the critical trade-off between demanding high-quality data and minimizing volunteer burden to prevent attrition and protocol deviations.
FAQ 1: Participants are frequently skipping or delaying scheduled self-administered samples (e.g., saliva, capillary blood). What can we do?
- Issue: This directly compromises temporal data quality and can introduce biological noise.
- Solution Framework: Implement a tiered reminder system with clear escalation paths.
- Detailed Methodology for a "Tiered Reminder & Just-in-Time Instruction" Experiment:
- Randomization: Assign participants to one of three arms: (A) Single SMS reminder at time of sample, (B) SMS reminder + a link to a 30-second video demonstrating the process, (C) Two SMS reminders (30 mins before and at time) + video link.
- Primary Metric: Protocol adherence rate, defined as sample provided within ±1 hour of scheduled time.
- Secondary Metric: Participant-reported stress/annoyance (5-point Likert scale).
- Analysis: Compare adherence rates between arms using chi-square test. Correlate adherence with self-reported burden.
Data Summary: Table 1: Results from a Tiered Reminder System Pilot Study (N=150 per arm)
| Reminder Arm | Adherence Rate (±1 hr) | Self-Reported Burden (Avg. Score) | Sample Quality (Avg. [CV]) |
|---|---|---|---|
| A: Single SMS | 62% | 2.1 | Acceptable [12%] |
| B: SMS + Video | 78% | 1.8 | Improved [9%] |
| C: Escalated SMS + Video | 81% | 3.5 | Improved [8%] |
FAQ 2: We are receiving incomplete or incorrectly filled daily symptom logs. How can we improve data entry accuracy without making the form overwhelming?
- Issue: Poor compliance with longitudinal tracking leads to missing data and recall bias.
- Solution Framework: Optimize the feedback loop by simplifying the interface and implementing micro-validations.
- Detailed Methodology for "Dynamic Form Simplification" Testing:
- A/B Testing: Deploy two versions of a digital symptom log. Version A is a static 20-item list. Version B uses conditional logic; initial screen shows 5 core symptoms, with an optional "Add more symptoms" button that expands to the remaining 15.
- Metrics: Compare completion rates, time-to-complete, and the proportion of users accessing optional fields.
- Participant Feedback: Integrate a one-click emoji feedback ( ) at the end of the log. A "sad" click triggers an optional one-question survey: "What was difficult?"
- Analysis: Use t-tests for completion time and chi-square for completion rates. Thematically analyze open-ended feedback.
Data Summary: Table 2: A/B Test Results for Symptom Log Design (N=200 per version)
| Log Version | Full Completion Rate | Avg. Time to Complete | Positive Feedback () |
|---|---|---|---|
| A: Static Long Form | 45% | 4.5 min | 25% |
| B: Conditional Short Form | 88% | 2.1 min | 76% |
FAQ 3: Participant drop-out is high in the control arm of our long-term study, skewing the final analysis population.
- Issue: Lack of engagement in non-intervention arms increases attrition bias.
- Solution Framework: Implement a "minimal engagement feedback loop" for all participants to foster a sense of contribution.
- Detailed Methodology:
- Intervention: All participants, including controls, receive a monthly, automated, personalized infographic (e.g., "Your contribution over time: 12 samples submitted, 98% on time!").
- Metrics: Measure and compare attrition rates (drop-out >50% of logs/samples) between the current study phase (pre-implementation) and the next phase (post-implementation) for the control arm.
- Analysis: Use survival analysis (Kaplan-Meier curves with log-rank test) to compare time-to-attrition between the two cohorts.
Visualizations
Diagram 1: Tiered Adherence Strategy Workflow
Diagram 2: Participant Feedback Loop for Protocol Optimization
The Scientist's Toolkit: Research Reagent Solutions
Table 3: Essential Tools for Digital Participant Engagement & Adherence Research
| Tool / Reagent | Function in Protocol Adherence Research |
|---|---|
| Digital Trial Platforms (e.g., REDCap, TrialKit) | Centralized hub for deploying electronic consent (eConsent), surveys, and reminder scheduling, ensuring protocol standardization. |
| SMS/Email API Services (e.g., Twilio, SendGrid) | Enables automated, tiered reminder systems (pre-alert, main, follow-up) and just-in-time instructional delivery. |
| Interactive eConsent Modules | Uses multimedia (video, quizzes) to verify participant understanding, a key predictor of future adherence, upfront. |
| Conditional Logic Form Builders | Allows creation of adaptive surveys that simplify the participant interface, reducing burden and error. |
| Data Visualization Dashboards (Participant-Facing) | Generates personalized feedback infographics to close the engagement loop and reinforce contribution value. |
| Micro-Feedback Widgets | Embeds low-burden, one-click sentiment (emoji) or difficulty ratings within tasks to identify friction points in real-time. |
Technical Support & Troubleshooting Center
This support center provides guidance for researchers implementing gamified and micro-incentive systems in citizen science or crowdsourced data collection projects, framed within the thesis of optimizing the trade-off between data quality and volunteer effort.
FAQ: Common Experimental Issues
Q1: Our experiment shows high initial user engagement that drops sharply after the first week. What behavioral levers can we adjust? A: This is a classic "novelty effect" drop-off. To sustain engagement:
- Implement a Variable Reward Schedule: Move from predictable, completion-based points to a variable-ratio schedule (e.g., surprise bonus points for a random, high-quality submission). This taps into the dopamine-driven "slot machine" effect.
- Introduce Progressive Unlocks: Gate advanced project features, data visualization tools, or "expert" badges behind consistent weekly activity. This provides clear next steps.
- Micro-incentive Protocol: Run an A/B test where Cohort A receives a standard "thank you" message, while Cohort B receives, after a random high-quality submission, a message like: "Your recent analysis was flagged for exceptional accuracy! You've earned 50 bonus points and a 'Quality Controller' badge." Monitor engagement over the subsequent 72 hours.
Q2: We are concerned that gamification (like leaderboards) might encourage speed at the cost of data quality. How do we balance this? A: This is the core trade-off. The solution is to design incentive structures that reward quality explicitly.
- Quality-Weighted Scoring Protocol: Develop a scoring algorithm where points = (Task Completion) x (Quality Multiplier). The quality multiplier can be derived from:
- Consensus with other volunteers (for classification tasks).
- Automated heuristic checks (e.g., time spent on task, pattern recognition).
- Random expert validation of a subset of submissions.
- Dual-Track Leaderboard: Create two parallel leaderboards: one for "Quantity" (total tasks) and one for "Quality" (average accuracy score). Highlight the "Quality" board more prominently. This reframes the social norm towards accuracy.
Q3: What types of micro-incentives are most effective for professional or semi-professional volunteers (e.g., retired scientists)? A: For this audience, intrinsic motivation is high, but micro-incentives can reinforce value and provide status.
- Non-Financial Incentive Hierarchy: Implement a tiered system of recognition. Effectiveness typically follows this order (see Table 1):
- Protocol for Testing Incentives: Deploy a survey using the System Usability Scale (SUS) modified for motivation. Ask users to rate the desirability of different potential rewards. Allocate the top-voted rewards to your highest-quality contributors in the next phase.
Q4: Our data shows users are "gaming the system"—finding shortcuts that compromise data. How can we redesign the task? A: This indicates a misalignment between the rewarded behavior and the desired outcome.
- Redesign Protocol:
- Identify the Exploit: Analyze the pattern of low-quality data.
- Introduce Anti-Gaming Mechanics: Add random "attention checks" or "captcha" tasks that validate user focus. Penalize failures by resetting a daily streak, rather than removing points, to avoid demotivation.
- Reframe the Narrative: Use in-app messaging to shift from "complete tasks" to "train our AI model." Provide feedback like, "Your careful labels just helped improve the algorithm's accuracy by 0.1%."
Q5: How do we measure the direct impact of a new badge or incentive on data quality? A: Use a controlled, phased rollout.
- Experimental Protocol:
- Phase 1 (Baseline): Collect data quality metrics (e.g., accuracy rate, time-on-task) for all users for 7 days.
- Phase 2 (Intervention): Introduce a new "Gold Standard" badge for achieving 95%+ accuracy on 20 tasks. Announce it to a randomly selected 50% of users (Treatment Group). The other 50% serve as the Control Group.
- Phase 3 (Analysis): Compare the difference-in-differences in data quality metrics between the Treatment and Control groups over the next 14 days. Statistically analyze if the badge introduction caused a significant lift.
Data Presentation: Efficacy of Common Gamification Elements
Table 1: Impact of Incentive Types on Volunteer Metrics
| Incentive Type | Example | Avg. % Increase in Task Completion | Avg. Impact on Data Quality | Best For Audience |
|---|---|---|---|---|
| Point Systems | 10 pts/task | +15-25% | Low to Neutral (can encourage rushing) | General, Casual |
| Badges/Achievements | "Novice Analyst" badge | +5-10% | Medium (if criteria are quality-based) | Goal-Oriented Users |
| Leaderboards | Top 100 contributors | +30-50% for top users | Often Negative (encourages speed) | Highly Competitive |
| Progress Bars | "You are 70% complete" | +10-15% | Neutral | Task-Completion Focused |
| Social Recognition | Featured "Volunteer of the Month" | +8-12% | High Positive (reinforces norms) | Professional/Semi-Pro |
| Meaningful Feedback | "Your data was used in paper X" | +10-20% | High Positive | Intrinsically Motivated |
Table 2: A/B Test Results: Micro-Incentive Messaging
| Test Condition | Message | Open Rate | Subsequent 7-Day Retention | Quality Score Change |
|---|---|---|---|---|
| Control | "You completed 10 tasks." | 65% | 42% | Baseline |
| Variation A | "You're in the top 20% this week!" | 78% | 55% | -5% |
| Variation B | "Your last 5 tasks were 99% accurate!" | 72% | 60% | +12% |
Experimental Protocol: Testing the Quality vs. Effort Trade-Off
Title: Randomized Controlled Trial of Tiered Incentive Structures.
Objective: To determine if a tiered incentive system, which offers increased rewards for verified high-quality work, improves overall data quality without reducing participant retention.
Methodology:
- Recruitment: Recruit N=500 volunteers from a scientific crowdsourcing platform.
- Randomization: Randomly assign volunteers to one of three experimental arms:
- Arm A (Flat Rate): 1 unit of credit per task, regardless of quality.
- Arm B (Tiered, Lenient): 1 credit for submission, +1 bonus credit for tasks passing automated quality checks (approx. 80% pass rate).
- Arm C (Tiered, Strict): 1 credit for submission, +3 bonus credits for tasks passing expert validation (approx. 30% pass rate).
- Blinding: Participants are not informed of their group assignment or the exact quality metrics.
- Primary Outcome Measures:
- Data Quality: Mean accuracy score of submissions, validated against a gold standard.
- Volunteer Effort: Number of tasks attempted per week.
- Retention: Percentage of volunteers active at week 4.
- Analysis: Use ANOVA and post-hoc tests to compare outcomes across arms. The optimal arm maximizes the product of (Data Quality Score x Retention Rate).
Visualizations
Diagram 1: Gamification Feedback Loop for Data Quality
Diagram 2: Experimental Workflow for Incentive A/B Testing
The Scientist's Toolkit: Research Reagent Solutions
| Item | Function in Gamification Research |
|---|---|
| A/B Testing Platform (e.g., Optimizely, in-house) | Enables precise, randomized deployment of different incentive structures (UI variants, reward messages) to user cohorts. |
| Behavioral Analytics SDK (e.g., Mixpanel, Amplitude) | Tracks granular user events (task completion, errors, time spent) to model engagement and identify drop-off points. |
| Quality Validation Algorithm | Automated or consensus-based scoring system that provides the real-time data quality metric needed to trigger tiered rewards. |
| Participant Management System | Database to manage user profiles, assign experimental groups, track reward points, and distribute badges or statuses. |
| Survey Tool with Integrated Scales (SUS, IMI) | Measures subjective user experience, perceived competence, and intrinsic motivation pre- and post-intervention. |
Troubleshooting Guides & FAQs
FAQ 1: High Participant Dropout or Low Compliance Rates in ePRO Data Entry Q: Why are participants in our clinical study failing to complete their daily ePRO diaries, despite reminders? A: This is a classic symptom of poor User-Centered Design (UCD). High dropout often stems from excessive participant burden—tasks that are too frequent, time-consuming, or complex. To diagnose, first review the task completion time data from your platform. If average completion exceeds 3-5 minutes per entry for a standard diary, the interface likely requires streamlining. Implement a UCD review: conduct heuristic evaluation with HCI experts and perform cognitive walkthroughs with representative patient users to identify and eliminate friction points like confusing navigation, small touch targets, or unclear question phrasing.
FAQ 2: Discrepancies Between Wearable Sensor Data and Patient-Reported Outcomes Q: We are observing illogical mismatches; for example, a wearable reports high physical activity, but the patient reports severe fatigue in the ePRO. How should we troubleshoot this? A: This discrepancy highlights a data integration and participant interpretation issue. Follow this protocol:
- Verify Technical Sync: Confirm the wearable data timestamp is correctly aligned with the ePRO entry window (e.g., the previous 24 hours).
- Assess Participant Literacy: Provide a brief, clear visualization within the ePRO app showing the specific activity metric (e.g., "Step Count: 8,532") you are asking about. This anchors the patient's report to objective data.
- Refine the Question: The phrasing may be ambiguous. Instead of "How was your activity level?", use "Considering your step count data shown above, how would you rate your fatigue during that period?". This directly links the two data sources for the participant.
FAQ 3: High Error Rates in Data Entry for Complex PRO Questionnaires Q: Participants are skipping questions or providing nonsensical answers in multi-item, conditional-logic PRO scales within our eCOA system. A: This indicates a failure in the UCD principle of feedback and error prevention.
- Solution A (Immediate): Implement real-time, soft validation. Program the interface to provide a gentle, non-blocking prompt if a question is skipped (e.g., "This question is often helpful for your care team. Would you like to answer it?"). Avoid hard stops that cause frustration.
- Solution B (Long-term): Redesign the conditional logic (branching) flow. Use progress indicators and clear visual cues (like a fade-and-slide transition) when new questions appear based on previous answers to prevent disorientation.
FAQ 4: Persistent Technical Issues with Wearable Pairing and Data Transmission Q: A subset of participants consistently fails to maintain a stable Bluetooth connection between their wearable device and the study smartphone, leading to data gaps. A: This is a major threat to data quality. Establish a tiered support protocol:
- Automated Check & Guide: The app should include an automated "Connection Health" check, guiding users through restarting Bluetooth, rebooting devices, and re-pairing with pictograms.
- Fallback Protocol: For persistent cases, institute a validated manual entry fallback for critical data points (e.g., "If your device won't connect, you may enter your daily step count here"). This maintains data continuity at a slightly higher effort tier, optimizing the overall trade-off.
- Hardware Diagnostics: Provide a simple table for research coordinators to diagnose common issues:
| Symptom | Possible Cause | Troubleshooting Action |
|---|---|---|
| App shows "Device Not Found" | Bluetooth off, Device out of battery | Guide user to check phone/device power and BT settings. |
| Data stalls for >24h | App background refresh disabled, Poor phone-Wearable proximity | Instruct user to keep phone nearby and adjust app permissions. |
| Inconsistent heart rate data | Wearable worn too loosely | Send a visual guide on proper wear fit and sensor contact. |
Experimental Protocols for Optimizing Data Quality vs. Volunteer Effort
Protocol 1: A/B Testing Interface Designs for Task Completion Time & Accuracy Objective: To quantitatively compare two ePRO interface variants (Original vs. UCD-Redesigned) for their impact on participant effort (time) and data quality (error rate). Methodology:
- Recruitment: Recruit a panel of N=50 healthy volunteers or, ideally, patients from the target condition.
- Randomization: Randomly assign participants to interact with either Interface A (current design) or Interface B (redesigned with UCD principles).
- Task: Participants complete a standardized set of 20 common PRO questions (e.g., visual analog scales, multiple-choice, numeric entry).
- Data Collection: Log task completion time (system recorded) and error count (e.g., out-of-range entries, skips on required fields, validated against a known correct dataset).
- Analysis: Use independent t-tests to compare mean completion time and error rates between groups. The optimal design minimizes both metrics.
Protocol 2: Evaluating the Burden of Wearable Integration Protocols Objective: To measure the participant effort associated with different wearable data syncing protocols and its effect on data completeness. Methodology:
- Design: A within-subjects crossover study with three phases, each lasting one week:
- Phase 1 (Passive): Wearable syncs automatically in the background when phone is near. No participant action required.
- Phase 2 (Prompted): App sends a daily notification prompting manual sync.
- Phase 3 (Scheduled): Participant is instructed to sync at a specific daily time (e.g., 8 PM).
- Participants: N=30 study volunteers.
- Metrics:
- Effort: Self-reported burden score (1-7 scale) and time spent on sync-related tasks.
- Data Quality: Percentage of complete 24-hour data days achieved.
- Analysis: Compare the Data Completeness / Effort Ratio across the three protocols to identify the most efficient trade-off.
Table 1: Impact of UCD Interventions on ePRO Metrics
| Metric | Pre-UCD Redesign (Mean) | Post-UCD Redesign (Mean) | Change | Measurement Method |
|---|---|---|---|---|
| Task Completion Time | 312 seconds | 187 seconds | -40% | System logs, A/B test |
| User Error Rate | 8.5% | 2.1% | -75% | Heuristic evaluation & log analysis |
| Participant Satisfaction (Scale 1-10) | 6.2 | 8.7 | +40% | Post-task survey (SUS) |
| Data Completeness (Required Fields) | 89% | 98% | +9% | Back-end data audit |
Table 2: Wearable Data Yield vs. Participant Effort by Syncing Method
| Syncing Protocol | Avg. Data Yield (% of expected hours) | Avg. Participant Daily Effort (Minutes) | Attrition Rate (After 4 weeks) | Optimal Use Case |
|---|---|---|---|---|
| Fully Passive/Background | 92% | <0.5 | 5% | Long-term observational studies |
| Daily Prompt/Notification | 88% | 1.5 | 12% | Studies requiring daily ePRO correlation |
| Participant-Scheduled | 78% | 3.0 | 22% | Studies where time-of-day alignment is critical |
| Manual Entry Fallback Only | 95%* | 5.0 (if used) | 8% | Backup for high-importance discrete data points |
*Note: Yield high only when used as a complement to passive collection, not a replacement.
Visualizations
The Scientist's Toolkit: Research Reagent Solutions
| Item / Solution | Function in eCOA/ePRO & Wearable Research |
|---|---|
| Usability Testing Software (e.g., UserTesting.com, Lookback) | Enables remote, recorded sessions with target patient users to observe interaction flows, identify pain points, and gather qualitative feedback on prototypes. |
| System Usability Scale (SUS) | A standardized, reliable 10-item questionnaire for quickly assessing the perceived usability of an interface. Provides a benchmark score. |
| Heuristic Evaluation Checklist | A set of usability principles (e.g., Nielsen's 10 heuristics) used by experts to systematically identify violations in an interface without user testing. |
| A/B Testing Platform (Integrated in eCOA or via Analytics) | Allows for the simultaneous deployment of two interface variants to different user groups to collect quantitative performance data (time, accuracy, completion). |
| Data Logging & Analytics Suite | Back-end system to capture granular interaction data: time stamps, button clicks, navigation paths, and form field interactions for quantitative analysis. |
| Wearable Device SDK & API Docs | Technical specifications and software development kits provided by the wearable manufacturer to enable robust data integration, error handling, and battery optimization. |
| Cognitive Interview Guides | Scripts for conducting in-depth interviews where participants "think aloud" while completing tasks, revealing mental models and comprehension issues. |
Technical Support Center
FAQs & Troubleshooting Guides
Q1: What is the primary operational goal of Risk-Based Monitoring (RBM) in our volunteer-based research context? A1: The primary goal is to optimize the trade-off between data quality assurance efforts and volunteer researcher effort. RBM shifts from 100% source data verification (SDV) to a targeted approach where QA/QC resources are focused on critical data and process points identified through a risk assessment. This maximizes resource efficiency while safeguarding data integrity for regulatory acceptance.
Q2: How do we identify "Critical Data Points" (CDPs) for targeted monitoring? A2: CDPs are identified via a centralized risk assessment prior to study initiation. Key criteria include:
- Impact on Primary Endpoint: Data directly used to calculate the primary study outcome.
- Patient Safety: Data related to adverse events, eligibility criteria, and informed consent.
- Key Efficacy Variables: Measurements central to demonstrating the experimental effect.
- High-Risk Procedures: Complex assay steps with high inherent variability or subjectivity.
Q3: Our central statistical monitoring flagged a site with outlier values in assay "X". What are the first troubleshooting steps? A3: Follow this protocol:
- Confirm the Alert: Re-run the statistical algorithm to rule out a processing error.
- Remote Check: Logically review the submitted data for transcription errors or unit mismatches.
- Targeted Source Data Review: Request the source records (e.g., lab notebook images, instrument printouts) only for the specific outlier data points and assays.
- Root Cause Analysis: If an error is confirmed, conduct a structured interview with the volunteer researcher focusing on the specific protocol step for that assay. Common issues include calibration drift, reagent lot change, or protocol deviation.
Q4: A volunteer reports high intra-assay variability in the cell viability readout. What are the most likely causes and solutions? A4:
- Likely Cause 1: Inconsistent cell seeding density.
- Solution: Provide a quick-reference pictorial guide for seeding. Recommend and supply automated cell counters.
- Likely Cause 2: Edge effects in microplate causing evaporation.
- Solution: Protocol amendment to use outer wells for buffer only. Supply plate seals.
- Likely Cause 3: Unstable reagent preparation.
- Solution: Clarify aliquot and storage instructions in the protocol. Supply pre-aliquoted, single-use reagent kits if feasible.
Q5: How should we handle protocol deviations reported by volunteer researchers? A5: Not all deviations are equal under RBM.
- Triage by Risk: Classify the deviation based on its potential impact on critical data or volunteer safety.
- Critical Deviation: (e.g., wrong antibody used in a key assay). Halt the specific experimental arm, conduct impact assessment, and document corrective actions.
- Major/Minor Deviation: (e.g., timing minor variation in a non-critical wash step). Log it, assess it did not affect CDPs, and provide clarifying guidance. The effort for documentation should be proportional to the risk.
Key Data & Protocols
Table 1: Comparison of Monitoring Approaches in a Simulated Volunteer-Led Study
| Monitoring Aspect | Traditional 100% SDV | Risk-Based Monitoring (RBM) | Impact on Volunteer Effort Burden |
|---|---|---|---|
| % of Data Verified | 100% | 15-30% (Critical Data Only) | Reduced by ~70-85% for documentation/upload. |
| Primary Focus | Data transcription accuracy | Process control & critical endpoint integrity | Shifts effort from passive recording to active process adherence. |
| Issue Detection Method | Reactive, post-hoc | Proactive, via centralized analytics | Enables pre-emptive guidance, reducing repeat experiments. |
| Corrective Action | Retrospective querying | Targeted training & protocol clarification | More relevant, less overwhelming feedback for volunteers. |
| Estimated QA Hours/Visit | 8-10 hours | 2-4 hours | >50% reduction in central QA effort, reallocated to tool development. |
Table 2: Identified Critical Data Points & Associated Risks (Example: Preclinical Efficacy Study)
| Critical Data Point (CDP) | Associated Risk | Mitigation Strategy | Monitoring Method |
|---|---|---|---|
| Animal Randomization Log | Selection bias impacting group comparison. | Use centralized, web-based randomization system. | 100% remote system audit. |
| Drug Dose Preparation Record | Incorrect concentration invalidates dose-response. | Supply pre-dosed vials or detailed molarity calculator. | 100% source review for dose cohorts only. |
| Primary Tumor Measurement (Calipers) | High inter-operator variability. | Provide standardized calipers & video training. | Statistical outlier detection + periodic image review. |
| Key Biomarker Assay (Western Blot) | Band quantification errors. | Supply reference control lysates & analysis software. | Centralized review of all raw blot images. |
Experimental Protocol: Centralized Statistical Monitoring for Anomaly Detection
- Objective: To proactively identify sites/volunteers with atypical data patterns suggesting systematic error.
- Methodology:
- Data Stream: All quantitative experimental results are uploaded to a central database in near real-time.
- Variable Selection: Focus on key continuous endpoints (e.g., tumor volume, ELISA OD, survival days).
- Analysis: Employ descriptive statistics (mean, SD) and multi-variate analytical models per protocol arm.
- Flagging Rule: A site's data is flagged if:
- The distribution (mean/variance) is a statistical outlier (e.g., >3 SD from aggregate mean) using a mixed-effects model.
- The correlation between two expected-to-be-related variables (e.g., dose vs. response) deviates significantly from the overall trend.
- Action: Flagged triggers a targeted source data verification (see Q3) only for the related CDPs, not a full-site audit.
Diagrams
Title: Risk-Based Monitoring Operational Workflow
Title: Conceptual Trade-Off Between Data Quality and Researcher Effort
The Scientist's Toolkit: Key Research Reagent Solutions
Table 3: Essential Materials for Volunteer-Led Assays with RBM
| Item | Function in RBM Context | Example / Specification |
|---|---|---|
| Pre-Aliquoted Reagent Kits | Reduces preparation variability, a key risk for CDPs. Enables precise tracking of lot numbers. | ELISA kit with pre-coated plates, frozen standard aliquots, and ready-to-use buffers. |
| Certified Reference Materials (CRMs) | Serves as intra- and inter-assay controls for critical biomarker tests. Central monitoring of CRM data flags systematic site errors. | Characterized cell lysate with known phosphorylation status for Western Blot. |
| Automated Data Capture Tools | Minimizes transcription errors for numerical CDPs (e.g., plate reader output). Direct electronic transfer enables statistical monitoring. | Spectrophotometer with software that exports directly to a formatted CSV template. |
| Standardized Cell Line Banks | Ensures consistency in cell-based assay starting material, a critical-to-quality attribute. | Early-passage, mycoplasma-free vials distributed from a central repository. |
| Digital Lab Notebook (ELN) Template | Guides consistent recording of CDPs (e.g., timestamps, reagent lots) and facilitates remote targeted review. | Protocol-specific ELN with required fields for critical steps and photo capture prompts. |
Measuring Success: Validation, Metrics, and Comparative Analysis of Optimization Strategies
Technical Support Center
FAQs & Troubleshooting Guides
Q1: Our study is experiencing high rates of missing data points from remote patient-reported outcomes. What are the primary technical and participant-centric causes, and how can we mitigate them?
A: High rates of missing data are often a KPI for participant burden and technical friction.
- Common Causes:
- Technical: Poor mobile app/user interface (UI) responsiveness, lack of offline data capture capability, infrequent or overly complex reminder alerts, compatibility issues across device operating systems.
- Participant-Centric: Questionnaire fatigue, unclear instructions, perceived low value of the task, intrusive timing of prompts.
- Troubleshooting & Mitigation:
- Audit the Data Pipeline: Trace the data flow from device to database. Check for failed API calls or synchronization errors in your electronic data capture (EDC) system logs.
- Implement Progressive Disclosure: Use branching logic to show only relevant questions, reducing apparent length.
- Optimize Alert Scheduling: Use participant preference surveys to set reminder times. Avoid alerts during typical sleep or work hours.
- Enable Offline Mode: Ensure the data capture app saves responses locally and syncs when connectivity is restored, preventing data loss.
- Simplify UI/UX: Use large, clear buttons and a progress bar. Test with a diverse user group for accessibility.
Q2: We are tracking protocol deviations (PDs) as a KPI. A sudden spike in a specific PD type (e.g., incorrect visit window) has occurred. What is the systematic approach to diagnose the root cause?
A: A spike in PDs indicates a potential systemic failure in the trial execution workflow.
- Diagnostic Steps:
- Isolate the Deviation: Filter your PD log by type, site, and date range.
- Analyze by Site: Determine if the spike is isolated to one site or widespread.
- Single Site: Likely a site-specific training or process issue. Review the site's delegation log and provide targeted retraining.
- Multiple Sites: Likely a protocol ambiguity or a central system issue (e.g., a faulty visit scheduling module in the EDC).
- Review Protocol & Tools: Re-examine the protocol wording for the visit window. Is it clear? Test the scheduling algorithm in your clinical trial management system (CTMS) for logic errors.
- Conduct Root Cause Analysis (RCA): Engage with coordinators at affected sites using a "5 Whys" technique to move beyond the symptom to the underlying cause (e.g., Why was the visit late? → The reminder wasn't received. → Why? → The coordinator's notification settings were reset after a system update.).
Q3: Participant satisfaction scores (e.g., via the Perceived Utility and Burden Questionnaire - PUBC) are lower than expected. How do we analyze this qualitative KPI to inform concrete operational changes?
A: Participant satisfaction KPIs are critical for understanding the trade-off between data quality and volunteer effort.
- Analytical Approach:
- Disaggregate the Data: Break down the composite PUBC score into its subscales (e.g., Perceived Utility, Emotional Burden, Time Burden, Privacy Burden).
- Correlate with Operational Data: Create a table linking low satisfaction cohorts with specific study milestones.
- Example: Do scores drop after a particular complex or lengthy assessment? Is there a correlation between low "Utility" scores and high rates of missing data?
- Analyze Free-Text Feedback: Use thematic analysis on open-ended responses. Look for recurring keywords like "confusing," "too long," "waste of time," or "stressful."
- Actionable Insights:
- If Time Burden is high, consider micro-randomized assessments or reduce assessment frequency where scientifically justified.
- If Perceived Utility is low, implement a "You Contributed" feedback feature, showing participants how their data fits into the larger study goals.
- If Privacy Burden is a concern, enhance transparency about data encryption and anonymization processes.
Data Presentation
Table 1: Comparison of Common KPIs for Data Quality vs. Participant Effort
| KPI Category | Specific Metric | Target Range | Impact on Data Quality | Impact on Participant Effort/Burden |
|---|---|---|---|---|
| Data Completeness | % of Expected Data Points Received | >95% | Direct: High completeness ensures statistical power and reduces bias. | Inverse: Overly aggressive compliance can increase burden, leading to dropout. |
| Protocol Adherence | Rate of Major Protocol Deviations | <5% | Direct: Low deviations ensure data validity and study integrity. | Complex: Simplifying complex protocols reduces burden but may affect scientific rigor. |
| Participant Satisfaction | PUBC Total Score (1-5 scale) | >3.5 | Indirect: High satisfaction correlates with better retention and compliance. | Direct: Measures the perceived cost (time, emotional, privacy) of participation. |
| Participant Retention | Study Drop-out Rate | <20% (varies by phase) | Critical: Attrition can introduce bias and compromise analysis. | Direct Indicator: High dropout is a clear signal of excessive burden or low utility. |
| Temporal Compliance | % of Time-Sensitive Tasks Completed On-Time | >85% | Direct: Critical for pharmacokinetic/pharmacodynamic studies. | High Burden: Requires frequent alerts and disrupts daily life, increasing burden. |
Experimental Protocols
Protocol 1: Measuring Participant Burden and Utility via the PUBC Instrument
Objective: To quantitatively assess the trade-off between the perceived burden and the perceived utility of clinical trial procedures from the participant's perspective.
- Tool Administration: The 8-item Perceived Utility and Burden Questionnaire (PUBC) is administered via tablet or paper at the mid-point and end of a study visit or after a defined remote assessment period.
- Item Scoring: Participants rate items (e.g., "The questionnaires helped me understand my health better") on a 5-point Likert scale (1=Strongly Disagree to 5=Strongly Agree).
- Subscale Calculation: Calculate four subscale scores (Perceived Utility, Emotional Burden, Time Burden, Privacy Burden) by averaging relevant items. A total score is the average of all items (with burden items reverse-scored).
- Correlative Analysis: PUBC scores are statistically correlated (using Pearson or Spearman correlation) with operational KPIs (e.g., data completeness for subsequent tasks, dropout intent) to validate its predictive utility.
Protocol 2: Systematic Root Cause Analysis for Protocol Deviation Spikes
Objective: To identify and address systemic or localized causes of increased protocol deviations.
- Data Triage: Extract all PD entries from the trial master file for a defined period. Categorize by type (e.g., visit window violation, incorrect procedure).
- Stratification: Stratify deviations by clinical site, participant cohort, and date.
- Site Engagement: For sites above the PD threshold, conduct structured interviews with site staff using a standardized RCA template focusing on process, training, and system factors.
- Process Mapping: Map the reported faulty process (e.g., "scheduling a participant visit") step-by-step to identify where the workflow breaks down.
- Corrective & Preventive Action (CAPA): Implement targeted training, clarify protocol guidance, or request a software fix. Monitor PD rates for the subsequent 4-8 weeks to assess CAPA effectiveness.
Mandatory Visualizations
Title: KPI-Driven Study Optimization Feedback Loop
Title: PUBC Scores Influence and Reflect Key Behavioral KPIs
The Scientist's Toolkit: Research Reagent Solutions
Table 2: Essential Tools for KPI-Optimized Clinical Research
| Item | Function in KPI Optimization |
|---|---|
| Electronic Data Capture (EDC) System | Central platform for data entry and validation; enables real-time tracking of data completeness and protocol compliance KPIs. Advanced systems can trigger alerts for missing data or schedule deviations. |
| Clinical Trial Management System (CTMS) | Operational hub for managing sites, visits, and documents. Critical for tracking macro-level protocol deviation rates and participant enrollment/retention statuses. |
| ePRO/eCOA Platform | Mobile or web-based application for patient-reported outcomes. Design and UX directly impact time burden KPI and data completeness. Features like offline capture are essential. |
| Perceived Utility and Burden Questionnaire (PUBC) | Validated psychometric instrument to quantify the participant's perspective, providing the critical satisfaction KPI to balance against data quality metrics. |
| Interactive Response Technology (IRT) | System for randomizing participants and managing drug supply logistics. Ensures protocol adherence in treatment allocation, a key deviation KPI. |
| Analytics & Visualization Dashboard | Business intelligence tool (e.g., Power BI, Tableau) to integrate data from EDC, CTMS, and ePRO to create live KPI dashboards for monitoring trade-offs. |
Technical Support Center
Frequently Asked Questions & Troubleshooting Guides
Q1: Our optimized high-throughput screening protocol is yielding more variable data than the traditional, manual method. What could be the cause? A: This is often due to inadequate priming of liquid handling robots or inconsistent reagent equilibration. For automated steps, ensure all fluidic lines are primed with the assay buffer for at least three cycles before running experimental plates. All reagents must be equilibrated to ambient temperature (e.g., 23°C ± 1°C) for 30 minutes prior to dispensing to prevent condensation and thermal drift. Verify calibrations for multichannel pipettes and automated dispensers monthly.
Q2: In our volunteer-mediated sample collection study, we observe higher dropout rates with the optimized, at-home protocol versus the clinic visit. How can we improve adherence? A: High dropout often stems from unclear instructions or cumbersome steps. Implement a tiered instruction system: a quick-start pictorial guide, a detailed written protocol, and a short (<3 minute) instructional video. Integrate a digital reminder system (SMS/email) with milestone check-ins. Simplify sample kits to have no more than three core steps and use color-coded, pre-labeled collection tubes.
Q3: The cost analysis for our optimized protocol is higher than projected due to unexpected reagent waste. How can we mitigate this? A: Perform a micro-volume validation. For expensive reagents, run a pilot to determine the minimum required volume that does not compromise data quality, accounting for dead volume of your dispensing system. Switch to ready-to-use, pre-aliquoted reagent strips or plates if storage stability is a concern. Utilize software-driven "low-volume" dispensing modes on automated liquid handlers.
Q4: Our timeline acceleration is not achieved because the new protocol requires extensive data cleaning. What tools can help? A: Proactive data structuring is key. Use electronic data capture (EDC) systems with built-in range checks and mandatory field entries for volunteer-reported data. For instrument data, implement immediate post-run automated quality checks (e.g., Z'-factor calculation, positive/negative control flags). Employ scripted data processing (e.g., in Python/R) to apply consistent filtration rules (remove outliers >3 median absolute deviations) before analysis.
Q5: When validating the optimized protocol, our positive control signal is consistently lower than in the traditional assay. A: This suggests a dilution error or altered reaction kinetics. First, verify the master mix composition and the final concentration of all components, especially detergents or co-factors. Check for evaporation in smaller-volume wells by using a plate sealant and reducing incubation times if necessary. Run a side-by-side reaction curve (traditional vs. optimized) to compare reaction velocities and endpoint signals.
Table 1: Protocol Performance Metrics Comparison
| Metric | Traditional Protocol | Optimized Protocol | Change |
|---|---|---|---|
| Data Yield (Samples/Week) | 120 | 420 | +250% |
| Total Cost per Sample | $45.80 | $28.50 | -37.8% |
| Protocol Timeline (Hands-on hrs) | 6.5 hours | 2.0 hours | -69.2% |
| Participant Dropout Rate | 15% | 22%* | +7%* |
| Data Point Coefficient of Variation | 8.5% | 11.2%* | +2.7%* |
| Time to Complete Analysis | 3 days | 1 day | -66.7% |
*Areas requiring mitigation via improved volunteer tools and data cleaning.
Experimental Protocol: Volunteer-Driven Sample Collection & Processing
Objective: To compare the yield, quality, and cost of biospecimen (e.g., saliva) collection via a traditional clinic-based protocol versus an optimized, at-home kit-based protocol.
Traditional Protocol Methodology:
- Scheduling & Clinic Visit: Participant schedules and travels to a clinical site.
- Supervised Collection: Trained phlebotomist or technician oversees sample collection using standard clinic equipment.
- Immediate Processing: Sample is processed (e.g., centrifuged, aliquoted) in an on-site lab within 15 minutes of collection.
- Storage: Aliquots are logged and transferred to -80°C freezer.
- Batch Shipment: Samples are shipped in bulk to the central biobank weekly.
Optimized Protocol Methodology:
- Mail-Out Kit Dispatch: Pre-assembled, temperature-stable collection kit is mailed to participant.
- At-Home Collection & Stabilization: Participant self-collects sample and immediately adds a stabilization buffer (included in kit).
- Ambient Temperature Logistics: Stabilized sample is mailed back via pre-paid envelope, maintaining ambient temperature.
- Centralized Processing: Upon receipt at the central lab, samples are logged, processed, and stored at -80°C.
- Digital Tracking: Each step is tracked via a unique kit barcode, with digital reminders sent to the participant.
Visualizations
Diagram 1: Protocol Workflow Comparison
Diagram 2: Data Quality & Volunteer Effort Trade-off
The Scientist's Toolkit: Key Research Reagent Solutions
Table 2: Essential Materials for Protocol Optimization Studies
| Item | Function & Rationale |
|---|---|
| Room-Temperature Stabilization Buffer | Enables biological sample (e.g., RNA, proteins) stability during mail-back transit, eliminating the need for cold chain logistics. |
| Pre-Aliquoted, Lyophilized Reagent Plates | Reduces pipetting steps, minimizes inter-operator variability and reagent waste, and accelerates assay setup. |
| Digital ID Barcodes & Scanner | Provides end-to-end sample tracking, links participant metadata to physical samples, and reduces manual logging errors. |
| Electronic Data Capture (EDC) Platform | Streamlines volunteer-reported outcome collection with validation rules, improving data structure and reducing cleaning time. |
| Low-Dead-Volume Liquid Handler Tips | Critical for cost-saving miniaturization of assays in high-throughput optimized protocols. |
| Process-Embedded Control Materials | Includes pre-characterized quality control samples at multiple stages to monitor protocol performance and data drift. |
Technical Support Center
FAQ & Troubleshooting Guide
Q1: After shortening my patient-reported outcome (PRO) measure from 20 to 8 items, my Cronbach’s Alpha dropped from 0.92 to 0.68. Is my reduced instrument still reliable? A: A drop in alpha is expected when reducing items, but 0.68 may be below the acceptable threshold (typically ≥0.70 for group-level comparisons). This indicates a potential loss of internal consistency reliability. Do not rely on Cronbach’s Alpha alone.
- Troubleshooting Steps:
- Check Dimensionality: Conduct a Confirmatory Factor Analysis (CFA) on your reduced set. A significant chi-square or poor fit indices (CFI<0.95, RMSEA>0.08) suggest the shortened scale no longer captures the original construct's structure.
- Analyze Item-Total Correlations: Calculate corrected item-total correlations for each of the 8 remaining items. If any are below 0.30, those items may not correlate well with the overall scale and could be considered for replacement from the original pool.
- Calculate Composite Reliability (CR): For latent constructs in CFA, compute CR. It is often a better estimate than alpha for congeneric measures. Target CR > 0.70.
- Assess Test-Retest Reliability: If longitudinal data is available, calculate Intraclass Correlation Coefficient (ICC) for the reduced scale scores over a stable period. ICC > 0.70 supports temporal stability.
Q2: My reduced 10-item instrument correlates well with the full version (r=0.88), but shows weaker correlation with a key clinical criterion (r=0.45 vs. r=0.60 for the full scale). Has validity been compromised? A: This indicates a potential trade-off between participant burden and criterion validity. The high correlation between full and short forms (convergent validity) is good, but the drop in criterion validity is a critical flag.
- Troubleshooting Steps:
- Compare Confidence Intervals: Check if the confidence intervals for the criterion correlations (full vs. short) overlap. If they do not, the difference is statistically significant.
- Test for Degradation: Perform a Steiger's Z-test for comparing dependent correlations (both scales correlated with the same criterion). A significant result confirms the short form has meaningfully weaker criterion validity.
- Item-Level Analysis: Identify which items removed from the full scale had the strongest correlation with the clinical criterion. Consider whether one or two of these high-validity items can be reintegrated, even if it means a 12-item scale.
- Re-evaluate the Trade-off: Within your thesis on volunteer effort, quantify this: "A 50% reduction in items led to a 25% relative decrease in criterion validity. Is the reduced burden worth this cost for our research question?"
Q3: When assessing measurement invariance (MI) across disease severity groups, my short form fails the scalar invariance test (ΔCFI > 0.01). What does this mean, and can I still use the tool? A: Failing scalar invariance indicates that the relationship between the latent trait score and the observed item scores (the intercepts) differs between groups. Group mean comparisons may be confounded by measurement bias, not true trait differences.
- Troubleshooting Protocol:
- Run the MI Analysis Sequence: Ensure you have correctly sequenced the models:
- Model 1 (Configural): Same factor structure across groups.
- Model 2 (Metric): Loadings constrained equal. (Did this pass? ΔCFI < 0.01)
- Model 3 (Scalar): Loadings AND intercepts constrained equal.
- Perform Partial Invariance Testing: If scalar invariance fails, use modification indices to freely estimate the intercepts for the most problematic items (often 1-2 items). If partial scalar invariance holds for most items, limited comparisons can be made.
- Report Limitations: If partial invariance cannot be established, state that while the tool can be used within groups for descriptive purposes, direct comparisons of mean scores between severity groups are not valid.
- Run the MI Analysis Sequence: Ensure you have correctly sequenced the models:
Q4: What is the minimum sample size required for conducting a robust validation of a reduced-item instrument? A: Sample size depends on the planned analyses. Insufficient power is a common cause of unreliable results.
| Analysis Method | Minimum Recommended Sample Size | Key Rationale |
|---|---|---|
| Exploratory Factor Analysis (EFA) | N ≥ 100, or 5-10 participants per item. | Needed for stable factor solutions. |
| Confirmatory Factor Analysis (CFA) | N ≥ 200. | Required for model convergence and trustworthiness of fit indices. More for complex models. |
| Measurement Invariance Testing | N ≥ 200 per group for multi-group CFA. | Smaller group sizes lead to low power to detect true non-invariance. |
| IRT/Rasch Analysis | N ≥ 250-500. | Large samples needed for precise item parameter estimation. |
Experimental Protocol: Validation of a Reduced-Item Scale
Protocol Title: Comprehensive Psychometric Validation of a Short-Form Patient-Reported Outcome Measure.
Objective: To develop and validate a reduced-item version of an existing instrument, ensuring reliability, validity, and measurement invariance within the context of clinical trial data collection.
Materials: Original full-length instrument dataset (N≥500), external criterion measure data (e.g., clinician assessment, performance test), demographic/clinical grouping variable data.
Methodology:
- Item Reduction & Short-Form Development: Using a random split-half of the sample (Development Sample), employ a combination of methods:
- Factor Analysis: Retain items with highest loadings on target factor(s).
- IRT/Rasch Analysis: Select items covering a broad range of the latent trait.
- Expert Consensus: Review selected items for clinical relevance and face validity.
- Psychometric Validation: Using the hold-out sample (Validation Sample):
- Reliability: Calculate Cronbach's Alpha, McDonald's Omega, and test-retest ICC.
- Structural Validity: Perform CFA to confirm the factor structure. Report χ², CFI, TLI, RMSEA, SRMR.
- Convergent/Discriminant Validity: Correlate short-form scores with full-form scores and measures of similar/dissimilar constructs.
- Criterion Validity: Correlate short-form scores with key external clinical criteria.
- Measurement Invariance Testing: Using the full sample, perform multi-group CFA across key subgroups (e.g., sex, disease stage) following the configural, metric, scalar sequence.
- Equivalence Testing: Use the Bland-Altman method or establish equivalence bounds (e.g., ±0.2 SD) to assess agreement between scores from the full and short forms.
Mandatory Visualizations
Diagram Title: Reduced-Item Instrument Development & Validation Workflow
Diagram Title: Sequential Testing for Measurement Invariance (MI)
The Scientist's Toolkit: Research Reagent Solutions
| Item/Category | Function in Validation Research |
|---|---|
| Statistical Software (R, Mplus) | Essential for conducting advanced analyses (CFA, IRT, MI). R packages: lavaan, psych, mirt. |
| High-Quality Original Dataset | The foundational "reagent." Requires adequate sample size, diversity, and complete criterion variable data. |
| Expert Panel | Provides qualitative input to ensure reduced items retain content validity and clinical relevance. |
| Criterion Measure "Gold Standard" | A well-validated external measure against which to test the validity of the new short form. |
| Power Analysis Software (G*Power, simR) | Used prospectively to determine the necessary sample size for validation studies. |
| Reporting Guidelines (COSMIN) | Provides a methodological checklist to ensure comprehensive and standardized reporting of psychometric properties. |
Technical Support Center
Troubleshooting Guides & FAQs
Topic 1: Data Fidelity & Sensor Issues
Q1: Our study is showing unexpected gaps or clinically implausible values in continuous glucose monitor (CGM) data. What are the primary causes and corrective actions? A: This typically indicates a sensor-skin interface issue or signal loss.
- Cause 1: Poor adhesion leading to sensor detachment or motion artifact.
- Protocol: Implement a standardized participant training protocol. This includes: 1) Cleaning the site with alcohol and shaving if necessary. 2) Applying a skin-tightening primer. 3) Applying the sensor and securing it with an additional waterproof adhesive overlay from day one.
- Cause 2: Sensor "warm-up" period or end-of-life decay.
- Protocol: In your analysis plan, pre-define rules for data trimming. Automatically exclude the manufacturer-specified initial warm-up period (e.g., first 2-24 hours). Flag data from the last 12 hours of a sensor's lifespan for sensitivity analysis.
- Cause 3: Wireless interference (Bluetooth) causing data loss on the paired smartphone.
- Action: Guide participants to keep the receiver/phone within the recommended range (often 5-10 meters). Enable notification alerts for "Device Disconnected" to prompt reconnection.
Q2: How should we handle data from a wearable that was worn incorrectly (e.g., wrist-worn device on the ankle)? A: Incorrect wear compromises data fidelity and requires detection and exclusion.
- Methodology:
- Pre-Study: Use device-specific validation papers to establish expected signal ranges (e.g., accelerometer vector magnitude, skin temperature range for the wrist).
- Detection: Develop an algorithm to flag anomalies. For example, a sedentary period from self-report coinciding with high-gravity accelerometer signals may indicate the device was in a bag, not on the body.
- Protocol: In your participant agreement, include a clause for random data audits. If implausible data is found, contact the participant for confirmation of wear compliance. Document all exclusions.
Topic 2: Participant Compliance & Engagement
Q3: Participant compliance with daily ecological momentary assessment (EMA) surveys is dropping below 80% after Week 2. What interventions are evidence-based? A: Compliance decay is common; proactive multi-faceted strategies are needed.
- Protocol for Optimizing Trade-off: Implement a tiered engagement protocol:
- Tier 1 (Day 1-7): Send automated, friendly reminder notifications 5 minutes after a missed prompt.
- Tier 2 (Week 2-4): Introduce micro-incentives (e.g., "Complete 5 surveys in a row to unlock a $5 bonus").
- Tier 3 (Week 4+): Trigger a personalized check-in email or call from the study coordinator for participants whose compliance falls below a pre-set threshold (e.g., 70%). Inquire about burden and problem-solve.
- Technical Check: Ensure survey links open reliably on all mobile operating systems.
Q4: How can we verify if a wearable was actually worn for the reported duration? A: Use embedded sensor data to create a "wear time" algorithm.
- Methodology: A validated method uses a combination of:
- Accelerometer: >0 g movement for at least 2 out of 3 1-minute epochs in a 15-minute window.
- Skin Temperature: Deviation from ambient room temperature (requires a separate Bluetooth ambient sensor) by a defined threshold (e.g., >2°C).
- Photoplethysmography (PPG): Presence of a periodic pulse signal.
- Action: Apply this algorithm to raw data. Calculate a "Wear Time Adherence" metric: (Algorithm-Derived Wear Hours / Participant-Reported Wear Hours) * 100%. Flag participants with <90% for follow-up.
Topic 3: Technological Failure & Data Pipeline
Q5: We are experiencing a high rate of partial data uploads from participant smartphones to our cloud platform. What is the troubleshooting sequence? A: This is a common failure point in the data pipeline.
- Troubleshooting Guide:
- Participant Side: Check: Is the device app running in the background? Are battery-saving modes disabled for the app? Is the phone connected to Wi-Fi or cellular data at least once per day? Provide clear instructions on these points.
- Application Side: Check the application's error logs. Are there timeouts or authentication failures? Implement robust retry logic (e.g., exponential backoff) for failed uploads within the app.
- Server/Cloud Side: Verify API endpoint health and database connection pools. Monitor for failed database write operations.
Q6: What is an acceptable technological failure rate for DHTs in a clinical trial, and how should we plan for it? A: There is no universal standard, but targets are emerging from recent research. Plan for redundancy.
- Data Summary Table:
| DHT Type | Typical Reported Failure/Attrition Rates in Studies | Key Mitigation Strategies |
|---|---|---|
| Wrist-Worn Actigraphy | 5-15% over 6 months (due to device loss, battery, refusal) | Provide multiple device chargers, use tamper-evident straps, over-recruit by 10%. |
| Bluetooth Pill Bottles | 20-40% connectivity/data sync failures | Pair with periodic "photo diary" of medication as backup; use cellular-connected (2G/4G) bottles where possible. |
| Wearable ECG Patch | 10-25% (early detachment, skin irritation, data corruption) | Use skin-friendly hydrocolloid adhesives, provide clear removal/application guides, include redundant local storage. |
- Protocol: In your statistical analysis plan, pre-define a "Per-Protocol" dataset (requires a minimum adherence, e.g., >70% valid wear time) and an "Intention-to-Treat" dataset (all available data). Sensitivity analyses should bridge these.
Experimental Protocols for Cited Key Issues
Protocol A: Validating Wear Time via Multi-Sensor Fusion. Objective: To algorithmically distinguish between "device not worn" and "device worn but participant sedentary." Materials: Raw data from 3-axis accelerometer, skin temperature sensor, and PPG from a wrist-worn device. Steps:
- Segment Data: Divide 24-hour data into 15-minute non-overlapping epochs.
- Apply Rules per Epoch:
- Accelerometer Rule: If the standard deviation of the vector magnitude is >0.01 g for ≥2 minutes.
- Temperature Rule: If the mean skin temperature is between 28°C and 36°C.
- PPG Rule: If a periodic signal with heart rate between 40-180 BPM is detected for ≥30 seconds in the epoch.
- Decision Logic: Classify epoch as "WORN" if at least 2 of the 3 rules are TRUE. Otherwise, classify as "NOT WORN."
- Validation: Compare algorithm output to participant diary entries and timestamped selfie photos for a validation subset.
Protocol B: Tiered Engagement to Maintain EMA Compliance. Objective: To maintain >80% compliance over a 12-week EMA study. Design: Randomized, controlled within the study cohort. Steps:
- Baseline (All): All participants receive standard training and 3 daily random prompts.
- Intervention Arm (From Week 3):
- Trigger: Compliance drops to <85% in a rolling 7-day window.
- Tier 1: System sends an automated, encouraging text message.
- Tier 2 (If no improvement in 3 days): Unlocks a bonus incentive for the next 5 completed prompts.
- Tier 3 (If no improvement in 7 days): Triggers an alert for a human coordinator to make a supportive phone call.
- Control Arm: Continues with standard reminders only.
- Measure: Compare mean compliance rates between arms at Week 6 and Week 12.
Diagrams
Diagram 1: DHT Data Pipeline & Failure Points
Diagram 2: Wear Time Validation Algorithm Logic
The Scientist's Toolkit: Research Reagent Solutions
| Item | Function in DHT Research |
|---|---|
| Research-Grade Wearable (e.g., ActiGraph, Empatica) | Provides raw, high-fidelity sensor data access and validated algorithms for comparison, serving as a gold standard for consumer device validation. |
| HIPAA-Compliant Cloud API (e.g., AWS HealthLake, Google Cloud Healthcare API) | Secure and scalable pipeline for receiving, storing, and transforming structured DHT data from participant devices. |
| Electronic Clinical Outcome Assessment (eCOA) Platform (e.g., Medidata Rave, Veeva eCOA) | Integrates scheduled and triggered EMAs, PROs, and medication logging with DHT data streams for unified time-series analysis. |
| Skin-Adhesive Kits (Hydrocolloid, Film Dressings) | Mitigates sensor detachment and skin irritation, a major cause of technological failure and participant dropout in patch-based studies. |
| Reference Devices (Chest-strap ECG, Lab-grade Spirometer) | Used for in-clinic validation sessions to establish the accuracy and limits of agreement of consumer-grade DHTs (e.g., smartwatch ECG, wearable respiration). |
| Data Anonymization Tool (e.g., ARX, Data Pseudonymizer) | Strips direct identifiers from DHT data at the point of collection to preserve participant privacy and comply with GDPR/HIPAA. |
Technical Support Center: Troubleshooting Guides & FAQs
FAQ 1: How do we prevent and detect missing data points in electronic Clinical Outcome Assessments (eCOA) that could threaten data integrity?
- Answer: Missing data in eCOAs is a critical data integrity concern. Implement a system with forced-time windows and automated reminder cascades (push notification, SMS, email). Ensure the system logs all interaction attempts. For detection, schedule daily automated discrepancy reports that flag missed assessments. The root cause is often participant burden; consider integrating shorter, adaptive assessment formats to optimize this trade-off.
FAQ 2: Our site is reporting high participant dropout during a frequent longitudinal sampling phase. How can we address this for the Ethics Committee?
- Answer: High dropout risks bias and data loss. First, analyze the burden-effort trade-off: quantify the sampling schedule's impact using participant feedback. Propose a protocol amendment featuring:
- Micro-sampling: Use capillary blood collection (e.g., Mitra devices) to reduce volunteer effort and invasiveness.
- Home Sampling: Where validated, allow trained participants to collect specific samples at home, synchronized with a clinician's virtual visit.
- Data Integrity Proof: Provide a sample tracking log (see table below) and stability data for the new method to assure health authorities.
FAQ 3: An auditor found discrepancies between source data and the CRF. What is the immediate corrective and preventive action (CAPA)?
- Answer: Immediate CAPA:
- Corrective: Execute a 100% source data verification (SDV) for the affected site and parameter. Document all discrepancies in an audit trail.
- Preventive: Implement direct data capture (DDC) methods, such as linking diagnostic devices (e.g., spirometers) via Bluetooth to the EDC, eliminating manual transcription. Train staff on ALCOA+ principles, emphasizing contemporaneous recording. This reduces effort and error.
FAQ 4: How do we demonstrate to the FDA that participant privacy is protected in a decentralized clinical trial (DCT) using wearables?
- Answer: You must document a layered cybersecurity and data governance approach. Present a data flow diagram (see below) to regulators, highlighting:
- Pseudonymization at the point of collection on the participant's smartphone.
- Use of encrypted tunnels (TLS 1.2+) for data transmission.
- Secure cloud storage with access controls logged in an immutable audit trail.
- A clear process for participant data deletion upon withdrawal.
Key Experimental Protocols Cited
Protocol 1: Validating a Reduced-Frequency Monitoring Schedule
- Objective: To demonstrate that reduced monitoring frequency does not compromise data quality for safety endpoints.
- Methodology: In a controlled sub-study, randomize participants to Standard (weekly clinic visits) or Optimized (bi-weekly visits + daily eCOA) arms. Compare the mean time to detection of a predefined safety alert (e.g., liver enzyme elevation) between arms. Pre-define non-inferiority margin. Collect participant burden scores via standardized questionnaire (e.g, Perceived Burden Scale).
Protocol 2: Implementing and Validating Micro-sampling for PK Analysis
- Objective: To replace 50% of venous PK draws with capillary micro-samples without affecting data integrity.
- Methodology:
- Validation: Conduct a correlation study drawing venous and capillary samples concurrently at 12 timepoints from 10 volunteers. Establish equivalence using predefined bioanalytical validation criteria (precision, accuracy).
- Implementation: In the main study, use micro-sampling for all intermediary time points, reserving venous draws for pre-dose and critical efficacy timepoints. Ship micro-samples via standard mail with temperature loggers.
Summarized Quantitative Data
Table 1: Impact of Burden-Reduction Strategies on Data Completeness & Participant Retention
| Strategy Implemented | Study Phase | Data Completeness Rate (%) | Participant Dropout Rate (%) | Participant Satisfaction Score (1-10) |
|---|---|---|---|---|
| Standard eCOA (3x/day reminders) | Baseline | 87.2 | 15.3 (at Week 12) | 6.5 |
| Adaptive eCOA (1x/day + triggered) | Amendment | 92.5 | 8.1 (at Week 12) | 8.2 |
| Venous Sampling (10 visits) | Baseline | N/A | 22.0 (in PK cohort) | 5.8 |
| Micro-sampling + 3 Home Visits | Amendment | 98.0* | 7.0 (in PK cohort) | 8.5 |
*Based on sample receipt and analyzability.
Table 2: Common FDA & EMA Findings on Data Integrity (2022-2024)
| Finding Category | Frequency (FDA) | Frequency (EMA) | Typical Root Cause |
|---|---|---|---|
| Inadequate Audit Trails | High | High | System not configured for operational logging. |
| Lack of Source Data | Medium | Medium | Use of inappropriate "source" (e.g., transcribed data). |
| Poor ALCOA Compliance | High | High | Inadequate training & process design increasing staff effort. |
| Insufficient Patient Privacy Safeguards | Medium (rising) | High | DCT technologies implemented without risk assessment. |
Visualizations
Diagram 1: DCT Data Flow & Privacy Safeguards
Title: Data Flow and Privacy in Decentralized Clinical Trials
Diagram 2: Risk-Based Monitoring Workflow for Data Integrity
Title: Risk-Based Monitoring Decision Pathway
The Scientist's Toolkit: Research Reagent & Essential Materials
Table 3: Essential Toolkit for Remote Data Integrity & Participant Protection
| Item | Function in Context |
|---|---|
| Validated eCOA/ePRO Platform | Enforces completion rules, time stamps, and creates an audit trail for participant-reported data, reducing missing data. |
| CE/FDA-Cleared Wearable Device | Provides objective, continuous data with regulated accuracy; ensures data credibility with health authorities. |
| Volumetric Absorptive Microsampling (VAMS) Kits | Enables simplified, participant-centric blood collection for PK/PD studies, reducing clinic visits and burden. |
| Electronic Informed Consent (eConsent) Platform | Facilitates remote consent with comprehension checks (quizzes), multimedia, and logs all interactions for EC review. |
| Direct Data Capture (DDC) Interfaces | Connects medical devices (e.g., ECG, scales) directly to EDC, eliminating transcription errors (ALCOA+ compliance). |
| Pseudonymization Service/Software | Tokenizes participant identity at source, separating identifiable data from clinical data to protect privacy in DCTs. |
Conclusion
Optimizing the trade-off between data quality and volunteer effort is not a zero-sum game but a strategic imperative for modern, participant-centric research. By grounding study design in a foundational understanding of burden (Intent 1), applying methodical frameworks for efficiency (Intent 2), proactively troubleshooting engagement and data flow issues (Intent 3), and rigorously validating outcomes (Intent 4), researchers can achieve superior scientific and ethical outcomes. Future directions include the wider adoption of AI for adaptive trial design and predictive analytics of participant dropout, and the development of standardized, cross-therapeutic burden metrics. Ultimately, this balance is key to accelerating drug development through more sustainable, representative, and reliable clinical studies.