Building Trust in Citizen Science: A Hierarchical Verification Framework for Biomedical Data Quality
This article presents a comprehensive framework for implementing hierarchical verification systems to ensure the quality and reliability of citizen science data, with a specific focus on applications in biomedical and...
Building Trust in Citizen Science: A Hierarchical Verification Framework for Biomedical Data Quality
Abstract
This article presents a comprehensive framework for implementing hierarchical verification systems to ensure the quality and reliability of citizen science data, with a specific focus on applications in biomedical and clinical research. As the volume of data collected through public participation grows, traditional expert-only verification becomes unsustainable. We explore the foundational principles of data verification, detail methodological approaches including automated validation and community consensus models, address common troubleshooting scenarios, and provide comparative analysis of validation techniques. For researchers and drug development professionals, this framework offers practical strategies to enhance data trustworthiness, enabling the effective utilization of citizen-generated data while maintaining scientific rigor required for research and regulatory purposes.
The Critical Need for Hierarchical Verification in Citizen Science
Data verification is the systematic process of checking data for accuracy, completeness, and consistency after collection and before use, ensuring it reflects real-world facts and is fit for its intended scientific purpose [1] [2] [3]. This process serves as a critical quality control mechanism, identifying and correcting errors or inconsistencies to ensure that data is reliable and can be used for valid analysis [1]. In the specific context of citizen science, verification often focuses on confirming species identity in biological records, a fundamental step for ensuring the dataset's trustworthiness for ecological research and policy development [4].
The integrity of scientific research is built upon a foundation of reliable data. Data verification acts as a cornerstone for this foundation, ensuring that subsequent analyses, conclusions, and scientific claims are valid and trustworthy [1]. Without rigorous verification, research findings are vulnerable to errors that can misdirect scientific understanding, resource allocation, and policy decisions.
Verification in Practice: Approaches for Citizen Science Data
Ecological citizen science projects, which collect vast amounts of data over large spatial and temporal scales, employ a variety of verification approaches. These methods ensure the data is of sufficient quality for pure and applied research. A systematic review of 259 published citizen science schemes identified three primary verification methods [4].
Table 1: Primary Data Verification Approaches in Citizen Science
| Verification Approach | Description | Prevalence | Key Characteristics |
|---|---|---|---|
| Expert Verification | Records are checked post-submission by a domain expert (e.g., an ecologist) for correctness [4]. | Most widely used, especially among longer-running schemes [4]. | Considered the traditional "gold standard," but can be time-consuming and resource-intensive, creating bottlenecks for large datasets [4]. |
| Community Consensus | Records are assessed by the community of participants themselves, often through a voting or peer-review system [4]. | A commonly used alternative to expert verification [4]. | Leverages the "wisdom of the crowd;" scalable but may require mechanisms to manage consensus and ensure accuracy. |
| Automated Approaches | Uses algorithms, such as deep learning classifiers, to verify data automatically [4] [5]. | A growing field, often used in conjunction with other methods in a semi-automated framework [4] [5]. | Offers a high-confidence, scalable solution for large data volumes; can rapidly validate the bulk of records, freeing experts for complex cases [5]. |
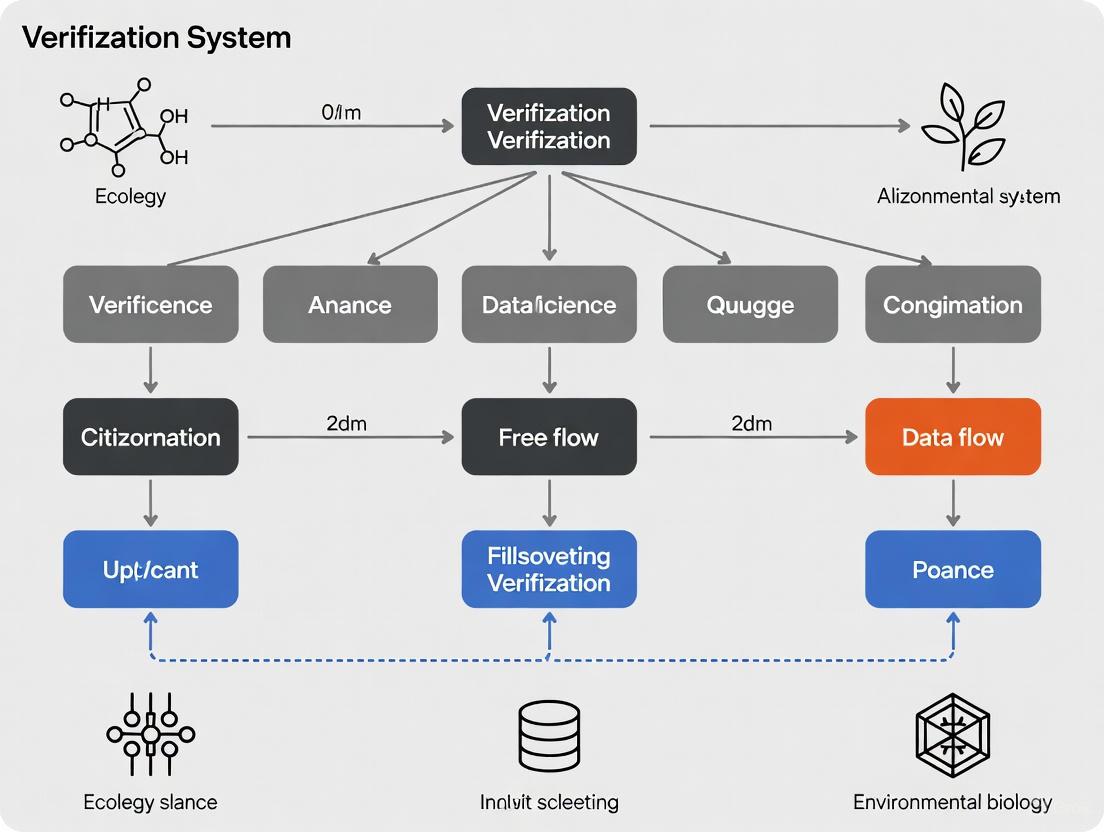
A Hierarchical Verification System: Protocol and Workflow
A proposed hierarchical verification system combines the strengths of automated, community, and expert methods to create an efficient and robust workflow [4]. This system is designed to handle large data volumes without sacrificing accuracy.
Diagram 1: Hierarchical Verification Workflow
Experimental Protocol: Semi-Automated Validation with Conformal Prediction
This protocol details a modern, scalable method for verifying citizen science records, integrating deep learning with statistical confidence control [5].
I. Objective: To establish a semi-automated validation framework for citizen science biodiversity records that provides rigorous statistical guarantees on prediction confidence, enabling high-throughput data verification.
II. Research Reagent Solutions
Table 2: Essential Materials for Semi-Automated Validation
| Item | Function / Description | Example / Specification |
|---|---|---|
| Deep Learning Classifier | A convolutional neural network (CNN) or similar model for image-based species identification. | Trained on a dataset of pre-validated species images (e.g., 25,000 jellyfish records) [5]. |
| Conformal Prediction Framework | A statistical method that produces prediction sets with guaranteed coverage, adding a measure of confidence to each classification [5]. | Generates sets of plausible taxonomic labels; a singleton set indicates high confidence for automatic acceptance [5]. |
| Calibration Dataset | A held-out set of labeled data used to calibrate the conformal predictor to ensure its confidence levels are accurate [5]. | A subset of the main dataset not used during the initial classifier training. |
| Expert-Validated Gold Standard | A smaller dataset (e.g., 800 records) verified by domain experts to evaluate the framework's performance against the traditional standard [5]. | Used for final accuracy assessment and benchmarking. |
III. Methodology:
Data Preparation and Partitioning:
- Source a large dataset of citizen science records, ideally with associated images and metadata.
- Partition the data into three subsets: a training set (~70%) for model development, a calibration set (~15%) for the conformal prediction, and a test set (~15%) for final evaluation [5].
Model Training and Calibration:
- Training: Train the deep learning classifier on the training set to perform hierarchical taxonomic classification (e.g., from genus to species) [5].
- Calibration: Using the calibration set, run the trained classifier and apply the conformal prediction algorithm. This step calculates non-conformity scores, which determine how to set prediction thresholds to achieve a desired confidence level (e.g., 95%) [5].
Hierarchical Verification and Output:
- Automated Acceptance: Process new, unverified records through the calibrated framework. Records for which the framework outputs a singleton prediction set (only one plausible label) at the desired confidence level are automatically accepted into the verified dataset [5].
- Escalation: Records that result in larger prediction sets (multiple plausible labels) or fall below the confidence threshold are flagged and escalated to the next level of the hierarchy for community or expert verification [4] [5].
The Critical Role of Verification in Scientific Research
Data verification is not a mere technical step but a fundamental component of research integrity. Its importance is multifaceted:
Ensuring Data Integrity and Research Validity: Verification is a critical process for ensuring the data quality and trust necessary for scientific datasets to be used reliably in environmental research, management, and policy development [4]. It confirms that the data accurately reflects the phenomena being studied, thereby supporting sound, evidence-based conclusions [1] [2].
Enabling Robust Analysis: The initial steps of data verification, including checking for duplications, missing data, and anomalies, form the bedrock of quantitative data quality assurance [6]. Clean, verified data is a prerequisite for applying statistical methods correctly, from descriptive statistics to complex inferential models [7] [6].
Building Trust and Supporting Policy: Verified data enhances the credibility of research findings among the scientific community, policymakers, and the public [2]. In citizen science, verification is specifically cited as a key factor in increasing trust in datasets, which is essential for their adoption in formal scientific and policy contexts [4].
The explosion of citizen science initiatives has enabled ecological data collection over unprecedented spatial and temporal scales, producing datasets of immense value for pure and applied research [4]. The utility of this data, however, is governed by the fundamental challenges of the Three V's—Volume, Variety, and Velocity—which constitute the core framework of Big Data [8]. Effectively managing these characteristics is critical for ensuring data quality and building trust in citizen-generated datasets.
Volume refers to the sheer amount of data generated by participants, which can range from terabytes to petabytes. Variety encompasses the diverse types and formats of data encountered, from simple species occurrence records to multimedia content like images and audio. Velocity represents the speed at which data is generated, collected, and processed, often in real-time streams [8]. Within citizen science, these challenges are exacerbated by the decentralized nature of data collection and varying levels of participant expertise, creating an urgent need for robust validation frameworks.
Quantitative Analysis of Citizen Science Data Verification
Current Verification Approaches in Ecological Citizen Science
A systematic review of 259 published citizen science schemes revealed how existing programs manage data quality through verification, the critical process of checking records for correctness (typically species identification) [4]. The distribution of primary verification approaches among 142 schemes with available information is quantified below:
Table 1: Primary Verification Methods in Ecological Citizen Science Schemes
| Verification Method | Prevalence (%) | Typical Application Context |
|---|---|---|
| Expert Verification | Most widely used | Longer-running schemes; critical conservation data |
| Community Consensus | Intermediate | Platforms with active participant communities |
| Automated Approaches | Least widely used | Schemes with standardized digital data inputs |
This analysis indicates that expert verification remains the default approach, particularly among established schemes. However, as data volumes grow, this method becomes increasingly unsustainable, creating bottlenecks that delay data availability for research and decision-making [4].
Performance Metrics for Validation Techniques
Recent research has developed more sophisticated, semi-automated validation frameworks to address the Three V's challenge. One such method, Conformal Taxonomic Validation, uses probabilistic classification to provide reliable confidence measures for species identification [5]. Experimental results demonstrate key performance improvements:
Table 2: Performance Metrics for Hierarchical Validation Techniques
| Performance Metric | Traditional Approach | Conformal Taxonomic Validation |
|---|---|---|
| Validation Speed | Slow (manual processing) | Rapid (algorithmic processing) |
| Scalability | Low (human-expert dependent) | High (computational) |
| Uncertainty Quantification | Qualitative/Implicit | Explicit confidence measures |
| Error Rate Control | Variable | User-set targets (e.g., 5%) |
| Resource Requirements | High (specialist time) | Lower (computational infrastructure) |
This hierarchical approach allows the bulk of records to be verified efficiently through automation or community consensus, with only flagged records undergoing expert review, thus optimizing resource allocation [4].
Application Notes & Protocols
Hierarchical Verification System Protocol
The following workflow implements a tiered verification strategy to manage high-volume, high-velocity citizen science data streams without compromising quality.
Figure 1: A hierarchical workflow for citizen science data verification.
Protocol Steps:
- Automated Pre-validation: Implement initial automated checks for data completeness, format compliance, and geographical plausibility. Records failing these checks are flagged for immediate review.
- Community Consensus Voting: Direct records that pass pre-validation to a community platform where experienced participants vote on identification accuracy. Records achieving a pre-defined consensus threshold (e.g., 95% agreement) advance.
- AI-Powered Identification: Process records using machine learning models (e.g., Conformal Taxonomic Validation) that generate species predictions with confidence scores [5]. Records with high confidence scores are automatically validated.
- Expert Verification: Route records that failed previous stages—due to low community consensus, ambiguous automated identification, or rarity/value of the observation—to domain experts for definitive verification.
- Quality Feedback Loop: Aggregate validation outcomes and performance metrics to continuously refine automated systems and provide targeted training to community participants.
Protocol for Conformal Taxonomic Validation Experiment
This protocol details the implementation of a conformal prediction framework for automated species identification, a core component of the hierarchical system [5].
Figure 2: Experimental workflow for conformal taxonomic validation.
Experimental Procedure:
Data Curation and Preprocessing:
- Source: Obtain citizen science species observation records with images from platforms like iNaturalist or GBIF (Global Biodiversity Information Facility).
- Criteria: Filter records to include only those research-grade observations with expert-verified identifications.
- Split: Randomly partition data into training (60%), calibration (20%), and test sets (20%), ensuring stratified sampling across taxonomic groups.
Model Training and Calibration:
- Architecture: Utilize a deep convolutional neural network (e.g., ResNet-50) pre-trained on ImageNet, with the final layer adapted for the specific number of taxonomic classes.
- Training: Train the model on the training set using standard cross-entropy loss and data augmentation techniques (random flipping, rotation, color jitter).
- Calibration: On the calibration set, compute non-conformity scores for each example. Use these scores to determine the threshold for generating prediction sets that achieve a user-defined coverage rate (e.g., 90% confidence that the true label is included).
Validation and Integration:
- Testing: Apply the calibrated model to the held-out test set. Evaluate based on (a) classification accuracy and (b) efficiency (average size of prediction sets).
- Integration: Deploy the model within the hierarchical framework. Records where the model's prediction set contains only one species (high confidence) are automatically verified. Records with multiple species in the prediction set (low confidence) are flagged for community or expert review.
The Scientist's Toolkit: Research Reagent Solutions
Table 3: Essential Tools and Platforms for Citizen Science Data Management
| Tool Category | Example Solutions | Function in Addressing the 3 V's |
|---|---|---|
| Data Integration & Platforms | Zooniverse, iNaturalist, GBIF | Centralizes data ingestion; manages Variety through standardized formats and Volume via scalable databases [4]. |
| Automated Validation Engines | Conformal Taxonomic Validation Framework [5] | Provides confidence-scored species identification; increases Velocity by automating bulk record processing. |
| Quality Assurance & Documentation | EPA Quality Assurance Handbook & Toolkit [9] | Provides templates and protocols for data quality management, ensuring Veracity across diverse data sources. |
| Cloud & Distributed Computing | Kubernetes, Cloud Services (AWS, GCP) | Enables horizontal scaling to handle data Volume and Velocity via elastic computational resources [8]. |
| Data Governance & Security | Atempo Miria, Data Classification Tools | Ensures regulatory compliance, implements data retention policies, and secures sensitive information [10]. |
The Limitations of Traditional Expert-Only Verification Systems
In artificial intelligence, an expert system is a computer system emulating the decision-making ability of a human expert, designed to solve complex problems by reasoning through bodies of knowledge represented mainly as if–then rules [11]. Verification and Validation (VV&E) are critical processes for ensuring these systems function correctly. Verification is the task of determining that the system is built according to its specifications (building the system right), while validation is the process of determining that the system actually fulfills its intended purpose (building the right system) [12].
The complexity and uncertainty associated with these tasks has led to a situation where most expert systems are not adequately tested, potentially resulting in system failures and limited adoption [12]. This application note examines the inherent limitations of traditional expert-only verification approaches and proposes structured methodologies to enhance verification protocols, with particular relevance to hierarchical systems for citizen science data quality.
Core Limitations of Expert-Only Verification Approaches
Traditional verification systems that rely exclusively on domain experts face several significant challenges that compromise their effectiveness and reliability.
Table 1: Key Limitations of Traditional Expert-Only Verification Systems
| Limitation Category | Specific Challenge | Impact on System Reliability |
|---|---|---|
| Knowledge Base Issues | Limited knowledge concentration in carefully defined areas | Today's expert systems have no common sense knowledge; they only "know" exactly what has been input into their knowledge bases [12]. |
| Incomplete or uncertain information | Expert systems will be wrong some of the time even if they contain no errors because the knowledge on which they are based does not completely predict outcomes [12]. | |
| Specification Problems | Inherent vagueness in specifications | If precise specifications exist, it may be more effective to design systems using conventional programming languages instead of expert systems [12]. |
| Methodological Deficiencies | Lack of standardized testing procedures | There is little agreement among experts on how to accomplish VV&E of expert systems, leading to inadequate testing [12]. |
| Inability to detect interactions | Traditional one-factor-at-a-time methods will always miss interactions between factors [13]. | |
| Expert Dependency | Knowledge acquisition bottleneck | Reliance on limited expert availability for system development and verification [12]. |
| Human expert fallibility | Like human experts, expert systems will be wrong some of the time [12]. |
Structured Methodologies for Enhanced Verification
Knowledge Base Partitioning and Analysis
Partitioning large knowledge bases into manageable components is essential for effective verification. This methodology enables systematic analysis of complex rule-based systems.
Table 2: Knowledge Base Partitioning Methodologies
| Methodology | Procedure | Application Context |
|---|---|---|
| Expert-Driven Partitioning | Partition knowledge base using expert domain knowledge | Results in a knowledge base that reflects the expert's conception of the knowledge domain, facilitating communication and maintenance [12]. |
| Function and Incidence Matrix Partitioning | Extract functions and incidence matrices from the knowledge base when expert insight is unavailable | Uses mathematical relationships within the knowledge base to identify logical partitions [12]. |
| Formal Proofs for Small Systems | Apply direct proof of completeness, consistency and specification satisfaction without partitioning | Suitable for small expert systems with limited rule sets [12]. |
| Knowledge Models | Implement high-level templates for expert knowledge (decision trees, flowcharts, state diagrams) | Organizes knowledge to suggest strategies for proofs and partitions; some models have mathematical properties that help establish completeness [12]. |
Experimental Protocol: Knowledge Base Partitioning Verification
- Extract Rule Dependencies: Map all rules and their relationships within the knowledge base using incidence matrices [12].
- Identify Logical Groupings: Apply clustering algorithms to identify naturally occurring rule groupings based on shared variables and dependencies.
- Validate Partition Logic: Present partitioned groups to domain experts for validation of logical consistency.
- Verify Inter-Partition Relationships: Ensure component systems agree among themselves through formal relationship checking [12].
- Execute Component-Level Testing: Verify each partition independently for completeness and consistency.
- Perform Integrated System Testing: Validate the fully integrated system against expected outcomes.
Design of Experiments (DoE) for Validation
DoE provides a statistics-based method for running robustness trials that efficiently identifies factors affecting system performance and detects interactions between variables.
Figure 1: DoE validation workflow for systematic factor testing.
Experimental Protocol: Taguchi DoE for Expert System Validation
- Factor Identification: Identify all factors that could affect system performance (typically 20-30 factors) [13].
- Factor Level Assignment: Assign high and low values for quantitative factors; identify options for qualitative factors.
- Array Selection: Select appropriate Taguchi array (e.g., L12 for efficient testing) to minimize trials while maintaining coverage [13].
- Trial Execution: Execute trials according to the array combinations, recording all performance metrics.
- Interaction Analysis: Analyze results to identify significant main effects and two-factor interactions.
- Robustness Assessment: Determine operating windows where system meets all specifications despite factor variations.
Table 3: Taguchi L12 Array Structure for Efficient Validation
| Trial Number | Factor 1 | Factor 2 | Factor 3 | Factor 4 | Factor 5 | Factor 6 | Factor 7 | Factor 8 | Factor 9 | Factor 10 | Factor 11 |
|---|---|---|---|---|---|---|---|---|---|---|---|
| 1 | 1 | 1 | 1 | 1 | 1 | 1 | 1 | 1 | 1 | 1 | 1 |
| 2 | 1 | 1 | 1 | 1 | 1 | 2 | 2 | 2 | 2 | 2 | 2 |
| 3 | 1 | 1 | 2 | 2 | 2 | 1 | 1 | 1 | 2 | 2 | 2 |
| 4 | 1 | 2 | 1 | 2 | 2 | 1 | 2 | 2 | 1 | 1 | 2 |
| 5 | 1 | 2 | 2 | 1 | 2 | 2 | 1 | 2 | 1 | 2 | 1 |
| 6 | 1 | 2 | 2 | 2 | 1 | 2 | 2 | 1 | 2 | 1 | 1 |
| 7 | 2 | 1 | 2 | 2 | 1 | 1 | 2 | 2 | 1 | 2 | 1 |
| 8 | 2 | 1 | 2 | 1 | 2 | 2 | 2 | 1 | 1 | 1 | 2 |
| 9 | 2 | 1 | 1 | 2 | 2 | 2 | 1 | 2 | 2 | 1 | 1 |
| 10 | 2 | 2 | 2 | 1 | 1 | 1 | 1 | 2 | 2 | 1 | 2 |
| 11 | 2 | 2 | 1 | 2 | 1 | 2 | 1 | 1 | 1 | 2 | 2 |
| 12 | 2 | 2 | 1 | 1 | 2 | 1 | 2 | 1 | 2 | 2 | 1 |
Formal Verification Methods for Rule-Based Systems
Formal methods provide mathematical rigor to the verification process, enabling proof of correctness for critical system components.
Experimental Protocol: Formal Proofs for Knowledge Base Verification
- Rule Transformation: Convert if-then rules into formal logical representations.
- Completeness Checking: Verify that all possible scenarios are addressed by the rule set.
- Consistency Checking: Ensure no contradictory conclusions can be derived from the rule set.
- Termination Verification: Confirm that inference chains will complete in finite time.
- Specification Compliance: Mathematically verify that system behavior matches formal specifications.
The Scientist's Toolkit: Research Reagent Solutions
Table 4: Essential Research Reagents and Solutions for Expert System Verification
| Reagent/Solution | Function/Application | Usage Context |
|---|---|---|
| Knowledge Base Shells | Provides framework for knowledge representation and inference engine implementation [11]. | Development environments for creating and modifying expert systems. |
| Rule Extraction Tools | Automates the process of converting expert knowledge into formal rule structures. | Initial knowledge acquisition and ongoing knowledge base maintenance. |
| Incidence Matrix Generators | Creates mathematical representations of rule dependencies for partitioning analysis [12]. | Knowledge base partitioning and dependency analysis. |
| Statistical Analysis Software | Enables Design of Experiments (DoE) and analysis of factor effects and interactions [13]. | Validation experimental design and results analysis. |
| Formal Verification Tools | Provides automated checking of logical consistency and completeness properties. | Critical system verification where mathematical proof of correctness is required. |
| Visualization Platforms | Creates diagrams for signaling pathways, experimental workflows, and logical relationships. | Communication of complex system structures and processes. |
Hierarchical Verification Framework for Citizen Science Applications
Citizen science data quality presents unique challenges that benefit from a hierarchical verification approach, moving beyond traditional expert-only methods.
Figure 2: Hierarchical verification framework for citizen science data.
Experimental Protocol: Implementing Hierarchical Verification
- Define Quality Tiers: Establish multiple tiers of data quality requirements based on intended use.
- Implement Automated Checks: Develop rule-based systems for initial data validation.
- Design Community Verification: Create protocols for peer review within citizen scientist communities.
- Establish Expert Sampling: Define statistical sampling approaches for targeted expert verification.
- Implement Feedback Loops: Create mechanisms for knowledge transfer between tiers.
- Validate System Effectiveness: Measure quality outcomes against traditional expert-only approaches.
Traditional expert-only verification systems present significant limitations in completeness, efficiency, and reliability for complex expert systems. By implementing structured methodologies including knowledge base partitioning, Design of Experiments, formal verification methods, and hierarchical approaches, researchers can overcome these limitations and create more robust, reliable systems. For citizen science data quality research specifically, a hierarchical verification framework that appropriately distributes verification tasks across automated systems, community participants, and targeted expert review provides a more scalable and effective approach than exclusive reliance on expert verification.
Application Notes: Hierarchical Verification for Data Quality
Conceptual Framework and Rationale
The foundation of a hierarchical verification system is to maximize data quality assurance while optimizing the use of expert resources. This approach processes the majority of records through efficient, scalable methods, reserving intensive expert review for complex or uncertain cases [4]. In ecological citizen science, this model has proven essential for managing large-scale datasets collected by volunteers, where traditional expert-only verification becomes a bottleneck [4]. For biomedical applications, this framework offers a robust methodology for validating diverse data types—from community health observations to protein folding solutions—while maintaining scientific rigor and public trust [14].
Verification Approaches: Ecological Evidence and Biomedical Potential
Table 1: Citizen Science Data Verification Approaches
| Verification Method | Implementation in Ecology | Potential Biomedical Application | Relative Resource Intensity |
|---|---|---|---|
| Expert Verification | Traditional default; human experts validate species identification [4]. | NIH peer-review of citizen science grant proposals; validation of complex protein structures in Foldit [14]. | High |
| Community Consensus | Multiple volunteers independently identify specimens; aggregated decisions establish validity [4]. | Peer-validation of environmental health data in the Our Voice initiative; community-based review of patient-reported outcomes [14]. | Medium |
| Automated & Semi-Automated Approaches | Conformal taxonomic validation uses AI and statistical confidence measures for species identification [5]. | Automated validation of data from wearable sensors; AI-assisted analysis of community-submitted health imagery; semi-automated quality checks for Foldit solutions [14]. | Low |
Quantitative Analysis of Verification Methods
Table 2: Portfolio Analysis of NIH-Supported Citizen Science (2008-2022)
| Project Category | Number of Grants | Primary Verification Methods | Key Outcomes |
|---|---|---|---|
| Citizen Science Practice | 71 | Community engagement, bidirectional feedback, participant-directed learning [14]. | Direct public involvement in research process; tools for health equity (Our Voice); protein structure solutions (Foldit) [14]. |
| Citizen Science Theory | 25 | Development of guiding principles, ethical frameworks, and methodological standards [14]. | Established three core principles for public participation; defined criteria for meaningful partnerships in biomedical research [14]. |
Protocols
Protocol: Implementation of a Hierarchical Verification Workflow
Purpose and Scope
This protocol outlines a three-tiered hierarchical system for verifying citizen science data, adaptable for both ecological records and biomedical observations. The procedure ensures efficient, scalable data quality control.
Experimental Workflow
The following diagram illustrates the sequential and iterative process for hierarchical data verification.
Materials and Reagents
Table 3: Research Reagent Solutions for Citizen Science Verification
| Item Name | Function/Application | Specifications/Alternatives |
|---|---|---|
| Mobile Data Collection App | Enables standardized data capture by citizen scientists; ensures consistent metadata collection. | e.g., Stanford Healthy Neighborhood Discovery Tool; must include geo-tagging, timestamp, and data validation prompts [14]. |
| Conformal Prediction Framework | Provides statistical confidence measures for automated data validation; calculates probability of correct classification [5]. | Implementation in Python/R; requires a pre-trained model and calibration dataset; key for Tier 1 automated screening [5]. |
| Community Consensus Platform | Facilitates peer-validation through independent multiple reviews; aggregates ratings for confidence scoring. | Can be built into existing platforms (e.g., Zooniverse) or as standalone web interfaces; requires clear rating criteria [4]. |
| Expert Review Interface | Presents flagged data with context for efficient specialist assessment; integrates automated and community feedback. | Should display original submission, automated scores, and community comments in a unified dashboard to expedite Tier 3 review [4]. |
Protocol: The Our Voice Citizen Science Method for Community Health
Purpose and Scope
This protocol details the Our Voice initiative method for engaging community members in identifying and addressing local health determinants. It demonstrates a successful biomedical application of citizen science with built-in community verification [14].
Experimental Workflow
The following diagram maps the iterative, community-driven process of the Our Voice model.
Materials and Reagents
Table 4: Essential Materials for Our Voice Implementation
| Item Name | Function/Application | Specifications/Alternatives |
|---|---|---|
| Stanford Healthy Neighborhood Discovery Tool | Mobile application for citizens to collect geo-tagged data, photos, and audio notes about community features affecting health [14]. | Required features: GPS tagging, multimedia capture, structured data entry; available on iOS and Android platforms [14]. |
| Community Facilitation Guide | Structured protocol for trained facilitators to lead community discussions about collected data and prioritize issues [14]. | Includes discussion prompts, prioritization exercises, and action planning templates; should be culturally and contextually adapted. |
| Data Integration & Visualization Platform | System for aggregating individual submissions into collective community maps and summaries for discussion [14]. | Can range from simple data dashboards to interactive maps; must present data clearly for community interpretation and decision-making. |
Hierarchical verification systems represent a critical framework for managing data quality in large-scale citizen science projects. These systems strategically allocate verification resources across multiple taxonomic or confidence levels to optimize the balance between operational efficiency and data accuracy. In citizen science, where volunteer-contributed data can scale to hundreds of millions of observations (e.g., 113 million records in iNaturalist, 1.1 billion in eBird), implementing efficient hierarchical validation is essential for maintaining scientific credibility while managing computational and human resource constraints [15]. The core principle involves structuring validation workflows that apply increasingly rigorous verification methods only where needed, creating an optimal trade-off between comprehensive validation and practical feasibility.
The conformal taxonomic validation framework exemplifies this approach through machine learning systems that provide confidence measures for species identifications, allowing automated acceptance of high-confidence records while flagging uncertain classifications for expert review [5]. This hierarchical approach addresses fundamental challenges in citizen science data quality by creating structured pathways for data validation that maximize both throughput and reliability. For conservation planning applications, incorporating hierarchically-verified citizen science data has demonstrated potential to significantly enhance the perceived credibility of conservation prioritizations with only minor cost increases, highlighting the practical value of robust verification systems [16].
Quantitative Framework and Performance Metrics
Hierarchical verification systems require precise quantitative frameworks to evaluate their performance at balancing efficiency and accuracy. The following tables summarize key metrics and standards essential for designing and implementing these systems in citizen science contexts.
Table 1: Key Performance Metrics for Hierarchical Verification Systems
| Metric | Definition | Calculation | Target Range |
|---|---|---|---|
| Automation Rate | Percentage of records resolved without human expert review | (Auto-validated records / Total records) × 100 | 60-80% for optimal efficiency [5] |
| Expert Validation Efficiency | Records processed per expert hour | Total expert-validated records / Expert hours | Project-dependent; should show increasing trend with system refinement |
| Accuracy Preservation | Final accuracy compared to full manual verification | (Hierarchical system accuracy / Full manual accuracy) × 100 | ≥95% for scientific applications [16] |
| Cost-Credibility Trade-off | Increased credibility per unit cost | ΔCredibility / ΔCost | Positive slope; optimal when minor cost increases yield significant credibility gains [16] |
| Uncertainty Resolution Rate | Percentage of uncertain classifications successfully resolved | (Resolved uncertain records / Total uncertain records) × 100 | ≥90% for high-quality datasets |
Table 2: WCAG 2 Contrast Standards for Visualization Components (Applied to Hierarchical System Interfaces)
| Component Type | Minimum Ratio (AA) | Enhanced Ratio (AAA) | Application in Hierarchical Systems |
|---|---|---|---|
| Standard Text | 4.5:1 | 7:1 | Interface labels, instructions, data displays [17] |
| Large Text | 3:1 | 4.5:1 | Headers, titles, emphasized classification results [18] |
| UI Components | 3:1 | Not defined | Interactive controls, buttons, verification status indicators [19] |
| Graphical Objects | 3:1 | Not defined | Data visualizations, confidence indicators, taxonomic pathways [17] |
The metrics in Table 1 enable systematic evaluation of how effectively hierarchical systems balance automation with accuracy, while the visual accessibility standards in Table 2 ensure that system interfaces and visualizations remain usable across diverse researcher and contributor populations. The cost-credibility trade-off metric is particularly significant for conservation applications, where research indicates that incorporating citizen science data with proper validation can enhance stakeholder confidence in conservation prioritizations with only minimal cost implications [16].
Experimental Protocols for System Validation
Protocol: Conformal Prediction for Automated Taxonomic Validation
This protocol outlines the implementation of conformal prediction for hierarchical taxonomic classification, creating confidence measures that enable automated validation of citizen science observations [5].
Materials and Reagents
- Citizen science data records with image and metadata components
- Pre-trained deep learning models for species identification (e.g., hierarchical classification networks)
- Calibration dataset with expert-verified ground truth labels
- Computational infrastructure for model inference and confidence calibration
Procedure
- Data Preparation and Hierarchical Structuring
- Organize taxonomic classes into hierarchical tree structure reflecting biological classification
- Partition dataset into training (60%), calibration (20%), and test (20%) subsets
- Apply data augmentation techniques to address class imbalance in training data
Model Training and Calibration
- Train deep learning models using hierarchical loss functions that incorporate taxonomic relationships
- Compute non-conformity scores using calibration set to measure prediction strangeness
- Set confidence thresholds for each taxonomic level based on desired error rate (typically α=0.05 for 95% confidence)
Hierarchical Prediction and Validation
- For each new observation, generate confidence measures across taxonomic hierarchy
- Automatically accept predictions exceeding confidence thresholds at appropriate taxonomic levels
- Route low-confidence predictions to human experts for verification with uncertainty reason codes
- Implement adaptive threshold adjustment based on expert feedback and error patterns
Validation and Quality Control
- Calculate coverage guarantees to ensure proportion of correct predictions meets confidence levels
- Monitor automation rates and expert workload weekly to optimize threshold settings
- Conduct periodic accuracy audits comparing hierarchical system results against full manual verification
Protocol: Systematic Performance Evaluation of Hierarchical Verification
This protocol provides a standardized methodology for evaluating the efficiency-accuracy trade-offs in hierarchical verification systems, enabling comparative analysis across different implementation approaches.
Materials and Reagents
- Fully verified reference dataset (gold standard)
- Candidate hierarchical verification system implementation
- Computational resources for performance benchmarking
- Statistical analysis software (R, Python with scikit-learn, or equivalent)
Procedure
- Baseline Establishment
- Process entire dataset through full manual verification to establish accuracy baseline
- Calculate resource requirements (time, cost, expert hours) for full verification approach
- Document error patterns and uncertainty distribution across taxonomic groups
Hierarchical System Implementation
- Configure confidence thresholds based on conformal prediction or alternative methods
- Process dataset through hierarchical system, recording automation decisions
- Route uncertain cases to expert verification following system protocols
- Record processing time, resource allocation, and verification outcomes
Comparative Analysis
- Calculate performance metrics from Table 1 for both hierarchical and full verification
- Construct precision-recall curves for automated classification components
- Perform statistical significance testing on accuracy differences (paired t-tests, α=0.05)
- Compute cost-benefit ratios comparing resource requirements against accuracy preservation
Quality Assurance
- Implement blind verification procedures where experts are unaware of automated classifications
- Ensure inter-expert reliability scores exceed 0.8 Cohen's kappa for subjective classifications
- Validate statistical power for detection of practically significant accuracy differences (>2%)
Visualization and Workflow Design
Effective hierarchical verification systems require clear visual representations of their workflows and decision pathways. The following diagrams illustrate core structural and procedural components using the specified color palette while maintaining accessibility compliance.
Diagram 1: Hierarchical Taxonomic Classification Structure
Diagram 2: Hierarchical Verification Decision Workflow
Research Reagent Solutions
The implementation of hierarchical verification systems requires specific computational tools and platforms that enable efficient data processing, model training, and validation workflows. The following table details essential research reagents for establishing citizen science data quality frameworks.
Table 3: Essential Research Reagents for Hierarchical Verification Systems
| Reagent/Platform | Type | Primary Function | Application in Hierarchical Systems |
|---|---|---|---|
| Conformal Prediction Framework | Software Library | Generate confidence measures for predictions | Provides probabilistic confidence scores for automated taxonomic classifications [5] |
| Citizen Science Platform (CSP) | Research Infrastructure | Data collection and volunteer engagement | Serves as data source and implementation environment for hierarchical verification [15] |
| Global Biodiversity Information Facility (GBIF) | Data Repository | Biodiversity data aggregation and sharing | Provides reference data for model training and validation [15] |
| Hierarchical Classification Models | Machine Learning Algorithm | Multi-level taxonomic identification | Core component for automated identification across taxonomic ranks [5] |
| Color Contrast Validator | Accessibility Tool | Verify visual interface compliance | Ensures accessibility of system interfaces and visualizations [19] [17] |
| Species Distribution Models | Statistical Model | Predict species occurrence probabilities | Supports data validation through environmental and spatial consistency checks [16] |
These research reagents collectively enable the implementation of complete hierarchical verification pipelines, from data collection through automated classification to expert review and final publication. The conformal prediction framework is particularly crucial as it provides the mathematical foundation for confidence-based automation decisions, while citizen science platforms offer the technological infrastructure for deployment at scale [5] [15].
Implementing a Multi-Layered Verification Framework: From Theory to Practice
In the context of a hierarchical verification system for citizen science data quality, Tier 1 represents the foundational layer of automated, high-throughput data validation. This tier is designed to handle the enormous volume of data generated by citizen scientists, which often presents challenges related to variable participant expertise and data quality [4]. The core function of Tier 1 is to provide rapid, automated filtering and qualification of species identification records, flagging records with high confidence for immediate use and referring ambiguous cases to higher tiers (e.g., community consensus or expert review) for further verification.
The Conformal Prediction (CP) framework is particularly suited for this task because it provides a statistically rigorous method for quantifying the uncertainty of predictions made by deep learning models. Unlike standard classification models that output a single prediction, conformal prediction generates a prediction set—a collection of plausible labels guaranteed to contain the true label with a user-defined probability (e.g., 90% or 95%) [20] [21]. This property, known as validity, is maintained under the common assumption that the data are exchangeable [20]. For citizen science, this means that an automated system can be calibrated to control the rate of incorrect verifications, providing a measurable and trustworthy level of data quality from the outset.
Theoretical Foundations of Conformal Prediction
Conformal prediction is a framework that can be built on top of any existing machine learning model (termed the "underlying algorithm") to endow it with calibrated uncertainty metrics. The fundamental output is a prediction set, ( C(X{new}) \subseteq \mathbf{Y} ), for a new example ( X{new} ), which satisfies the coverage guarantee: ( P(Y{new} \in C(X{new})) \geq 1 - \alpha ) where ( 1 - \alpha ) is the pre-specified confidence level (e.g., 0.95) [20]. This is achieved through a three-step process:
- Non-Conformity Measure: A function ( A(x, y) ) that quantifies how "strange" or non-conforming a data point ( (x, y) ) is relative to a set of other examples. For a classification model, a common non-conformity measure is ( 1 - fy(x) ), where ( fy(x) ) is the model's predicted probability for the true class ( y ) [20].
- Calibration: The model is applied to a held-out calibration set, generating a non-conformity score for each example in this set.
- Quantile Calculation: The ( (1-\alpha) )-quantile of the non-conformity scores from the calibration set, denoted ( \hat{q} ), is computed.
- Prediction Set Formation: For a new test example ( X{new} ), the prediction set contains all labels ( y ) for which the non-conformity score ( A(X{new}, y) ) is less than or equal to ( \hat{q} ) [20].
This process ensures that the prediction set will contain the true label with probability ( 1-\alpha ). In the context of citizen science, an empty prediction set indicates that the model is too uncertain to make any plausible suggestion, which is a clear signal for the record to be escalated to a higher tier in the verification hierarchy. A prediction set with a single label indicates high-confidence prediction suitable for automated verification, while a set with multiple labels flags the record as ambiguous.
Implementation Protocols
Model and Algorithm Selection
The following table summarizes the core components required for implementing a conformal prediction system for species identification.
Table 1: Core Components for a Conformal Prediction System
| Component | Description | Example Methods & Tools |
|---|---|---|
| Deep Learning Model | A pre-trained model for image-based species classification. | CNN (e.g., ResNet, EfficientNet) fine-tuned on a target taxa dataset [5]. |
| Non-Conformity Score | Measures how dissimilar a new example is from the calibration data. | Least Ambiguous Set Selector (LAPS) [22], Adaptive Prediction Sets (APS) [22], or a simple score like ( 1 - f_y(x) ) [20]. |
| Conformal Library | Software to handle calibration and prediction set formation. | TorchCP (PyTorch-based) [22], MAPIE, or nonconformist. |
| Calibration Dataset | A held-out set of labeled data, representative of the target domain, used to calibrate the coverage. | A curated subset of verified citizen science records from platforms like iNaturalist or GBIF [5] [15]. |
Detailed Experimental Workflow
The workflow for Tier 1 verification can be broken down into a training/calibration phase and a deployment phase. The following diagram illustrates the end-to-end process.
Figure 1: Workflow for Tier 1 Automated Verification. The system is first calibrated on a labeled dataset to establish a statistical threshold (q̂). During deployment, each new record is processed to generate a conformal prediction set, the size of which determines its routing within the hierarchical verification system.
Protocol Steps:
Data Preparation and Model Training
- Source a labeled dataset of species occurrences, such as those available from the Global Biodiversity Information Facility (GBIF) [5].
- Split the data into three parts: a training set, a calibration set, and a test set. A typical split is 70%/15%/15%.
- Train or fine-tune a deep learning model (e.g., a Convolutional Neural Network) on the training set for the task of species classification.
Calibration Phase (One-Time Setup)
- Using the calibration dataset, compute the non-conformity score for each example. For instance, using the APS score: ( A(xi, yi) ) for each calibration example ( (xi, yi) ) [22].
- Sort these scores in ascending order: ( A1, A2, ..., A_n ).
- Compute the calibrated threshold ( \hat{q} ) as the ( \lceil (n+1)(1-\alpha) \rceil / n )-th quantile of these scores [20]. This threshold is saved for the deployment phase.
Deployment and Hierarchical Routing
- For a new citizen science image ( X_{new} ), the deep learning model extracts features and computes probabilities.
- The conformal predictor generates the prediction set ( C(X{new}) ) by including all labels ( y ) for which the non-conformity score ( A(X{new}, y) \leq \hat{q} ) [20].
- The routing decision is made automatically based on the prediction set:
- |C(Xnew)| = 1 (Single species): The record is automatically verified and accepted at Tier 1.
- |C(Xnew)| > 1 (Multiple species): The record is flagged as ambiguous and escalated to Tier 2 for resolution via community consensus [4].
- |C(X_new)| = 0 (Empty set): The record is highly atypical or represents a potential outlier. It is escalated to Tier 3 for review by a domain expert [20].
The Scientist's Toolkit: Research Reagent Solutions
Table 2: Essential Tools and Libraries for Implementation
| Item | Function / Purpose | Specifications / Examples |
|---|---|---|
| TorchCP Library | A PyTorch-native library providing state-of-the-art conformal prediction algorithms for classification, regression, and other deep learning tasks. | Offers predictors (e.g., Split CP), score functions (e.g., APS, RAPS), and trainers (e.g., ConfTr). Features GPU acceleration [22]. |
| GBIF Datasets | Provides access to a massive, global collection of species occurrence records, which can be used for training and calibrating models. | Datasets can be accessed via DOI; example datasets are listed in the conformal taxonomic validation study [5]. |
| Pre-trained CNN Models | Serves as a robust starting point for feature extraction and transfer learning, reducing training time and computational cost. | Architectures such as ResNet-50 or EfficientNet pre-trained on ImageNet, fine-tuned on a specific taxonomic group. |
| CloudResearch Sentry | A fraud-prevention tool that can be used in a layered QC system to block bots and inauthentic respondents before data enters the system [23]. | Part of a layered quality control approach to ensure the integrity of the data source before algorithmic verification. |
Validation and Performance Metrics
To evaluate the performance of the Tier 1 verification system, both the statistical guarantees of conformal prediction and standard machine learning metrics should be assessed.
Table 3: Key Performance Metrics for System Validation
| Metric | Definition | Target Value for Tier 1 |
|---|---|---|
| Coverage | The empirical fraction of times the true label is contained in the prediction set. Should be approximately ( 1-\alpha ) [20]. | ≥ 0.95 (for α=0.05) |
| Efficiency (Set Size) | The average size of the prediction sets. Smaller sets indicate more precise and informative predictions [20]. | As close to 1.0 as possible |
| Tier 1 Throughput | The percentage of records automatically verified at Tier 1 (i.e., prediction set size = 1). | Maximize without sacrificing coverage |
| Expert Workload Reduction | The percentage of records that do not require Tier 3 expert review (i.e., prediction set size > 0). | Maximize (e.g., >85%) |
Validation Protocol:
- Use the held-out test set to compute all metrics listed in Table 3.
- Run an ablation study to compare the conformal model against the base deep learning model, demonstrating the improvement in uncertainty quantification.
- Report the distribution of records across the three tiers of the hierarchical system to demonstrate the reduction in workload for human experts. A well-calibrated system should automatically verify a large majority of records, as seen in studies where a hierarchical approach is proposed to manage data volume [4].
Integration within a Hierarchical Verification System
Tier 1 is not designed to operate in isolation. Its effectiveness is maximized when integrated with the broader hierarchical verification framework proposed for citizen science data quality [4]. The core principle is that the conformal prediction framework provides a statistically sound, tunable filter. A higher confidence level ( (1-\alpha) ) will result in larger prediction sets on average, increasing coverage but also increasing the number of records escalated to Tiers 2 and 3. Conversely, a lower confidence level will make Tier 1 more aggressive, automating more verifications but risking a higher rate of misclassification. This trade-off can be adjusted based on the criticality of the data and the resources available for human-in-the-loop verification. This hierarchical approach, where the bulk of records are verified by automation or community consensus and only flagged records undergo expert verification, is considered an ideal system for managing large-scale citizen science data [4].
Within a hierarchical verification system for citizen science data, Tier 2 represents a crucial intermediary layer that leverages the collective intelligence of a community of contributors. This tier sits above fully automated checks (Tier 1) and below expert-led audits (Tier 3), providing a scalable method for improving data trustworthiness [24]. Community consensus techniques are defined as processes where multiple independent contributors review, discuss, and validate individual data records or contributions, leading to a collective judgment on their accuracy and reliability [24] [4]. The core strength of this approach lies in its ability to harness diverse knowledge and perspectives, facilitating the identification of errors, misinformation, or unusual observations that automated systems might miss [24]. In ecological citizen science, for instance, community consensus has been identified as a established and growing method for verifying species identification records [4]. These techniques are vital for enhancing the perceived credibility of both the data and the contributors, forming a reinforcing loop where high-quality contributions build user reputation, which in turn increases the trust placed in their future submissions [24].
Current Approaches and Methodologies
Community consensus manifests differently across various crowdsourcing platforms and disciplines. A systematic review of 259 ecological citizen science schemes revealed that community consensus is a recognized verification method, employed by numerous projects to confirm species identities after data submission [4]. The foundational principle across all implementations is the use of multi-source independent observations to establish reliability through convergence [24].
Common Implementation Models
- Wiki Ecosystems (e.g., Wikipedia, Wikidata): These platforms operationalize community consensus through collaborative editorial processes. Key features include "talk page" discussions where contributors debate the verifiability and neutrality of information, and revision histories that allow the community to revert questionable edits. A core policy supporting this is "no original research," which requires all information to be corroborated by reliable, published sources, forcing consensus around citable evidence [24].
- Specialized Ecological Platforms (e.g., Zooniverse projects, iNaturalist): On these platforms, consensus often emerges from multiple users independently identifying the same species in an uploaded image or dataset. Records that receive consistent identifications from different users are automatically upgraded to a "research-grade" status, indicating a high level of community validation [4].
- Social Media and Review Platforms (e.g., X, Yelp, TripAdvisor): While more susceptible to misinformation, these platforms employ community-driven flags and moderation. Users can report inaccurate content, and the volume of reports or the consensus emerging from user reviews can trigger automated or human review processes [24].
A systematic review of ecological citizen science schemes provides insight into the adoption rate of community consensus relative to other verification methods [4].
Table 1: Verification Approaches in Published Ecological Citizen Science Schemes
| Verification Approach | Prevalence Among Schemes | Key Characteristics |
|---|---|---|
| Expert Verification | Most widely used, especially among longer-running schemes | Traditional default; relies on a single or small number of authoritative figures. |
| Community Consensus | Established and growing use | Scalable; leverages collective knowledge of a contributor community. |
| Automated Approaches | Emerging, with potential for growth | Efficient for high-volume data; often relies on machine learning models. |
Experimental Protocols for Community Consensus
This section provides a detailed, actionable protocol for implementing a community consensus validation system, suitable for research and application in citizen science projects.
Protocol: Multi-Stage Consensus for Ecological Data Validation
1. Objective: To establish a standardized workflow for validating species identification records through community consensus, ensuring data quality for research use.
2. Experimental Workflow:
The following diagram illustrates the hierarchical data verification process, positioning community consensus within a larger framework.
3. Materials and Reagents: Table 2: Research Reagent Solutions for Consensus Validation
| Item | Function/Description |
|---|---|
| Community Engagement Platform (e.g., iNaturalist, Zooniverse, custom web portal) | A web-based platform that allows for the upload of records (images, audio, GPS points) and enables multiple users to view and annotate them. |
| Data Submission Interface | A user-friendly form for contributors to submit observations, including fields for media upload, location, date/time, and initial identification. |
| Consensus Algorithm | A software script (e.g., Python, R) that calculates agreement metrics, such as the percentage of users agreeing on a species ID, and applies a pre-defined threshold (e.g., ≥ 67% agreement) for consensus. |
| User Reputation System Database | A backend database that tracks user history, including the proportion of a user's past identifications that were later confirmed by consensus or experts, generating a credibility score [24]. |
| Communication Module | Integrated email or notification system to alert users when their records are reviewed or when they are asked to review records from others. |
4. Step-by-Step Procedure: 1. Data Ingestion: A participant submits a species observation record via the platform's interface. The record includes a photograph, GPS coordinates, timestamp, and the participant's proposed species identification. 2. Initial Triage (Tier 1): Automated checks verify that all required fields are populated, the media file is not corrupt, and the GPS coordinates are within a plausible range. 3. Community Exposure: The record, now labeled as "Needs ID," is made available in a dedicated queue on the platform for other registered users to examine. 4. Independent Identification: A minimum of three other users (the number can be adjusted based on project size and activity) must provide an independent identification for the record without seeing others' identifications first. 5. Consensus Calculation: The consensus algorithm continuously monitors the record. It compares all proposed identifications. - If ≥ 67% of identifiers (including the original submitter) agree on a species, the record is automatically promoted to "Research Grade" [4]. - If identifications are conflicting or a rare/sensitive species is reported, the algorithm flags the record for Tier 3 expert review. 6. Feedback and Reputation Update: The outcome is communicated to all involved users. The reputation score of each user who provided an identification is updated based on whether their ID aligned with the final consensus or expert decision [24].
5. Analysis and Validation: - Quantitative Metrics: Calculate the percentage of records resolved by community consensus versus those escalated to experts. Monitor the time-to-consensus for records. - Quality Control: Periodically, take a random sample of "Research Grade" records and have an expert blindly validate them to measure the error rate of the community consensus process. - Data Output: The final, validated dataset should include the agreed-upon identification and a confidence metric derived from the level of consensus (e.g., 70% vs. 100% agreement).
Advanced and Emerging Protocols
As data volumes grow, purely manual community consensus can become inefficient. Emerging solutions integrate automation to create hierarchical or semi-automated systems.
Protocol: Semi-Automated Conformal Taxonomic Validation
This protocol is adapted from recent research on using machine learning to support the validation of taxonomic records, representing a cutting-edge fusion of Tiers 1 and 2 [5].
1. Objective: To create a scalable, semi-automated validation pipeline that uses a deep-learning model to suggest identifications and conformal prediction to quantify the uncertainty of each suggestion, flagging only low-certainty records for community or expert review.
2. Experimental Workflow:
3. Materials and Reagents: Table 3: Research Reagent Solutions for Semi-Automated Validation
| Item | Function/Description |
|---|---|
| Pre-Trained Deep Learning Model (e.g., CNN for image classification) | A model trained on a large, verified dataset of species images (e.g., from GBIF) capable of generating a probability distribution over possible species. |
| Conformal Prediction Framework | A statistical software package (e.g., in Python) that uses a "calibration set" of known data to output prediction sets—a set of plausible labels for a new data point—with a guaranteed confidence level (e.g., 90%) [5]. |
| Calibration Dataset | A curated hold-out set of data with known, correct identifications, used to calibrate the conformal predictor and ensure its confidence measures are accurate. |
| Uncertainty Threshold Configurator | A project-defined setting that determines what constitutes a "certain" prediction (e.g., a prediction set containing only one species) versus an "uncertain" one (a prediction set with multiple species). |
4. Step-by-Step Procedure: 1. Model Training and Calibration: A deep-learning model is trained on a vast corpus of validated species images. A separate, held-aside calibration dataset is used to configure the conformal prediction framework [5]. 2. Record Processing: A new, unvalidated species image is submitted to the platform. 3. Model Prediction and Uncertainty Quantification: The image is processed by the deep-learning model. Instead of just taking the top prediction, the conformal prediction framework generates a prediction set—a list of all species the model considers plausible for the image at a pre-defined confidence level (e.g., 90%) [5]. 4. Automated Decision Gate: - If the prediction set contains only a single species, the record is automatically validated and marked with a high-confidence flag. This may account for a large majority of common species. - If the prediction set is empty or contains multiple species, the model is uncertain. The record is automatically flagged and routed to the community consensus queue (Tier 2) for human intervention. 5. Community Refinement: The community of users works on the flagged records, using the model's uncertain prediction set as a starting point for their discussion and identification. 5. Feedback Loop: Records resolved by the community can be fed back into the model's training data to iteratively improve its performance and reduce the number of records requiring manual review over time.
This hierarchical approach, where the bulk of common records are verified by automation and only uncertain records undergo community consensus, maximizes verification efficiency [4] [5].
Within a hierarchical verification system for citizen science data, Tier 3 represents the most advanced level of scrutiny, designed to resolve ambiguous cases and ensure the highest possible data quality. This tier leverages expert knowledge, advanced statistical methods, and rigorous protocols to adjudicate records that automated processes (Tier 1) and community consensus (Tier 2) have failed to verify with high confidence. The implementation of this tier is critical for research domains where data accuracy is paramount, such as in biodiversity monitoring for drug discovery from natural compounds or in tracking epidemiological patterns. This document outlines the application notes and detailed experimental protocols for establishing and operating a Tier-3 expert review system.
Quantitative Framework for Expert Review
A Tier-3 system relies on a quantitative foundation to identify candidate records for expert review and to calibrate the confidence of its decisions. The following metrics and statistical methods are central to this process.
Key Quantitative Metrics for Flagging Complex Cases
Records are escalated to Tier 3 based on specific, measurable criteria that indicate uncertainty or high stakes. The table below summarizes the primary quantitative triggers for expert review.
Table 1: Quantitative Triggers for Tier 3 Expert Review Escalation
| Trigger Category | Metric | Calculation / Threshold | Interpretation |
|---|---|---|---|
| Consensus Failure | Low Consensus Score | < 60% agreement among Tier 2 validators | Indicates high ambiguity that cannot be resolved by community input alone [5]. |
| Predictive Uncertainty | High Conformal Prediction P-value | P-value > 0.80 for top candidate species | Machine learning model is highly uncertain; multiple species are almost equally probable [5]. |
| Data Rarity / Impact | Novelty Score | Record is > 3 standard deviations from the norm for a given region/season | Potential for a rare, invasive, or range-shifting species that requires expert confirmation [15]. |
| Conflict Indicator | High Expert Disagreement Index | >30% disagreement rate among a panel of 3+ experts on a given record | Flags records that are inherently difficult and require a formalized arbitration process [15]. |
Statistical Validation of Expert Performance
The reliability of the Tier 3 system itself must be quantitatively monitored. Conformal prediction offers a robust framework for providing valid confidence measures for each expert's classifications, ensuring the quality assurance process is itself assured [5].
Table 2: Performance Benchmarks for Tier 3 Expert Review System
| Performance Indicator | Target Benchmark | Measurement Frequency | Corrective Action if Target Not Met |
|---|---|---|---|
| Expert Agreement Rate (Cohen's Kappa) | κ > 0.85 | Quarterly | Provide additional training on taxonomic keys for problematic groups [5]. |
| Average Review Time per Complex Case | < 15 minutes | Monthly | Optimize decision support tools and user interface for expert portal. |
| Rate of Data Publication to GBIF | > 95% of resolved cases within 48 hours | Weekly | Automate data export workflows and streamline API integrations [15]. |
| Predictive Calibration Error | < 5% difference between predicted and empirical confidence levels | Biannually | Recalibrate the underlying conformal prediction model with new expert-validated data [5]. |
Experimental Protocols
Protocol 1: Conformal Prediction for Expert Calibration and Uncertainty Quantification
This protocol details the use of conformal prediction to generate predictive sets with guaranteed coverage for species identification, providing experts with a calibrated measure of machine-generated uncertainty.
1. Purpose: To quantify the uncertainty of automated species identifications from Tier 1 and present this information to Tier 3 experts in a statistically valid way, thereby focusing expert attention on the most plausible candidate species.
2. Methodology:
- Input: An image and/or metadata for an observation flagged for expert review.
- Pre-processing: The input data is transformed into a feature vector using a pre-trained deep neural network (e.g., ResNet-50) [5].
- Model & Calibration: A pre-calibrated conformal predictor is used. This predictor is trained and calibrated on a large, historical dataset of expert-verified citizen science records (e.g., from iNaturalist or GBIF) [5].
- Prediction Set Generation: For a new observation, the conformal predictor outputs a set of possible species classifications (not a single guess) with a pre-defined confidence level (e.g., 90%). This set contains the true species with a probability of 90%. A large set indicates high model uncertainty.
- Output: The prediction set, along with the p-values for each candidate species, is presented to the expert reviewer. A small, high-confidence set allows the expert to quickly confirm. A large set clearly signals the need for careful discrimination between several options.
Protocol 2: Blinded Expert Adjudication for Conflict Resolution
This protocol establishes a formal process for resolving cases where initial expert reviews are in conflict, ensuring an unbiased and definitive outcome.
1. Purpose: To resolve discrepancies in species identification from multiple Tier 3 experts, thereby producing a single, authoritative validation decision for high-stakes records.
2. Methodology:
- Case Identification: A record is entered into this protocol when the Expert Disagreement Index (see Table 1) exceeds a predefined threshold.
- Expert Panel Selection: A panel of at least two additional experts, who were not involved in the initial review, is assembled. These experts are blinded to the identities and rationales of the initial reviewers.
- Independent Review: Each panelist independently reviews the record using the standard Tier 3 decision support tools.
- Arbitration Meeting: If the panelists agree with each other, their consensus decision is final. If the panelists disagree, a moderated arbitration meeting is held where each expert presents evidence for their classification. The goal is to reach a consensus.
- Final Decision: If consensus is reached, the record is validated accordingly. If not, the record is marked as "Unresolvable" and may be flagged for future research or collection of additional evidence. The entire process is documented for system improvement.
Visualization of Tier 3 Workflow
The following diagram illustrates the logical flow and decision points within the Tier 3 expert review system.
The Scientist's Toolkit: Research Reagent Solutions
This section details the essential computational and data resources required to implement and operate a Tier 3 expert review system.
Table 3: Essential Research Reagents for a Tier 3 Expert Review System
| Tool / Resource | Type | Function in Tier 3 Process | Example / Note |
|---|---|---|---|
| Conformal Prediction Framework | Software Library | Provides statistically valid confidence measures for machine learning classifications, quantifying uncertainty for experts [5]. | Custom Python code as described in [5]; can be built upon libraries like nonconformist. |
| Global Biodiversity Information Facility (GBIF) | Data Infrastructure | Provides the reference dataset for calibrating models and serves as the ultimate repository for validated records [15]. | Use DOIs: 10.15468/dl.5arth9, 10.15468/dl.mp5338 for specific record collections [5]. |
| Quantum Annealing-based Graph Coloring | Advanced Algorithm | Can be used to optimize expert workload assignment, ensuring no expert is assigned conflicting cases or is over-burdened [25]. | Implementation as documented in the graph_coloring algorithm; can be used for task scheduling [25]. |
| High-Contrast Visualization Palette | Design Standard | Ensures accessibility and clarity in decision-support tools and dashboards used by experts, reducing cognitive load and error [26]. | Use shades of blue for primary data (nodes) and complementary colors (e.g., orange) for highlighting links/actions [26]. |
| Citizen Science Platform (CSP) API | Software Interface | Enables seamless data exchange between the Tier 3 review interface and the broader citizen science platform (e.g., for escalation and final publication) [15]. | iNaturalist API or custom-built APIs for proprietary platforms. |
Leveraging Hierarchical Classification for Taxonomic Validation
This application note presents a structured framework for implementing hierarchical classification to enhance taxonomic validation in citizen science. With data quality remaining a significant barrier to the scientific acceptance of citizen-generated observations, we detail a protocol that integrates deep-learning models with conformal prediction to provide reliable, scalable species identification. The methodologies and validation techniques described herein are designed to be integrated into a broader hierarchical verification system for citizen science data quality, ensuring robust datasets for ecological research and monitoring.
Citizen science enables ecological data collection over immense spatial and temporal scales, producing datasets of tremendous value for pure and applied research [4]. However, the accuracy of citizen science data is often questioned due to issues surrounding data quality and verification—the process of checking records for correctness, typically by confirming species identity [4]. In ecological contexts, taxonomic validation is this critical verification process that ensures species identification accuracy.
As the volume of data collected through citizen science grows, traditional approaches like expert verification, while valuable, become increasingly impractical [4]. Hierarchical classification offers a sophisticated solution by mirroring biological taxonomies, where identifications are made through a structured tree of decisions from broad categories (e.g., family) to specific ones (e.g., species). This approach enhances accuracy and computational efficiency. When combined with modern probabilistic deep-learning techniques, it creates a powerful framework for scalable data validation suitable for integration into automated and semi-automated verification systems [5].
Core Methodological Framework
Hierarchical Classification with Conformal Prediction
The proposed framework integrates hierarchical classification with conformal prediction to provide statistically calibrated confidence measures for taxonomic identifications [5].
- Deep Taxonomic Networks: Utilize deep latent variable models to automatically discover taxonomic structures and prototype clusters directly from unlabeled data. These networks optimize a complete binary tree-structured mixture-of-Gaussian prior within a variational inference framework, learning rich and interpretable hierarchical taxonomies that capture both coarse-grained semantic categories and fine-grained visual distinctions [27].
- Conformal Prediction: This method provides a statistical framework for quantifying the uncertainty of model predictions. For any new specimen observation, the conformal predictor calculates a p-value for each potential class label, representing the credibility of that classification. Labels with p-values below a chosen significance level (e.g., 0.05) are excluded, creating a prediction set with guaranteed coverage probability [5].
- Hierarchical Calibration: Model calibration is performed separately at different taxonomic levels (e.g., genus, family, order). This level-specific calibration accounts for varying model performance and uncertainty patterns across the biological hierarchy, ensuring more reliable confidence estimates at each stage of the classification process [5].
Workflow Integration
The logical workflow for integrating hierarchical classification into a citizen science data pipeline follows a clear, stepped process, illustrated below.
Experimental Protocols for Validation
Protocol 1: Assessing Citizen Scientist vs. Expert Reliability
This protocol validates the core premise that citizen scientists can produce data comparable to experts when supported by structured tools.
- Objective: To quantitatively compare the accuracy and precision of species identifications performed by citizen scientists versus domain experts using the hierarchical classification system.
- Materials: A curated set of specimen images with confirmed expert identifications (ground truth); the hierarchical classification software interface; participant groups (citizen scientists and experts).
- Procedure:
- Randomized Presentation: Present the image set to both citizen scientists and experts in randomized order.
- Structured Identification: Participants identify each specimen using the hierarchical classification interface, which records their path through the taxonomic tree.
- Data Collection: For each identification, record the final taxon, the confidence score generated by the conformal predictor, and the time taken.
- Validation Metrics: Calculate percentage agreement with ground truth, Cohen's kappa for inter-rater reliability, and false positive/negative rates for each group [28].
Table 1: Exemplar Data from a Bee Monitoring Validation Study
| Participant Group | Sample Size | Agreement with Expert (%) | Kappa Statistic (κ) | Common Identification Errors |
|---|---|---|---|---|
| Expert Taxonomists | 5 | 98.5 | 0.97 | None significant |
| Trained Citizen Scientists | 101 | 86.5 | 0.82 | Confusion between congeners |
| Novice Volunteers | 50 | 73.2 | 0.65 | Family-level misassignments |
Protocol 2: Multi-Dimensional Data Quality Assessment
This protocol provides a comprehensive framework for evaluating different dimensions of data quality in citizen science outputs.
- Objective: To implement a multi-dimensional assessment of data quality, evaluating both the perception of activity (e.g., detecting a biological event) and the precision of counts or identifications [28].
- Procedure:
- Video Analysis Task: Citizen scientists record 30-second videos of biological activity (e.g., bee flight activity at a hive entrance).
- Multi-Level Counting: Participants count entrances, exits, and individuals carrying pollen (or other relevant biological markers).
- Cross-Validation: "Original" collectors analyze their videos; "replicator" citizen scientists analyze videos from others; experts analyze all videos.
- Statistical Analysis:
- Accuracy: Compare mean counts between groups using ANOVA or mixed-effects models.
- Precision: Compare data dispersion (e.g., variance, coefficient of variation) between groups.
- Perception Analysis: Use generalized linear models to test for differences in the probability of detecting specific activities (e.g., pollen carrying) between groups [28].
Table 2: Data Quality Metrics from Stingless Bee Monitoring Study
| Data Quality Dimension | Metric | Citizen Scientists | Experts | Statistical Significance |
|---|---|---|---|---|
| Accuracy (Counts) | Mean difference in entrance counts | +0.8 bees/30s | Baseline | p = 0.32 (NS) |
| Accuracy (Detection) | False positive pollen detection rate | 12.5% | 3.2% | p < 0.05 |
| Precision | Coefficient of variation for exit counts | 18.5% | 11.3% | p < 0.01 |
| Spatial Accuracy | GPS location error | < 10m | < 5m | p < 0.05 |
Implementation and Integration
Hierarchical Toolbox for Tropical Coastal Ecosystems
The hierarchical validation approach can be effectively implemented through a tiered toolbox, as demonstrated in tropical coastal ecosystem monitoring [29].
- First Biotic Level (Broad Survey): Rapid visual census or pitfall trapping conducted by citizen scientists to establish distribution patterns and general assemblage data.
- Second Biotic Level (Targeted Sampling): More intensive methods like excavation or standardised transects performed by trained citizens or technicians for density and biomass calculations.
- Abiotic Level: Concurrent measurement of physical and chemical parameters (temperature, salinity, pollutants) to correlate with biological patterns [29].
This multi-level approach allows for cost-effective large-scale data collection while maintaining scientific rigor through built-in validation mechanisms.
Technology Integration and Automation
- Automated Data Validation: Implement range checks, consistency checks against known species distributions, and outlier detection algorithms to flag potentially erroneous submissions [30].
- Geospatial Validation: Integrate GPS coordinates to automatically compare observations against known species ranges and habitat preferences.
- Image Verification: Require photographic evidence for unusual records, enabling expert review and computer vision analysis [4] [30].
The Scientist's Toolkit
Table 3: Essential Research Reagent Solutions for Implementation
| Tool / Resource | Function | Implementation Example |
|---|---|---|
| Deep Taxonomic Networks | Unsupervised discovery of hierarchical structures from unlabeled data | Automatic organization of species images into a biological taxonomy without predefined labels [27]. |
| Conformal Prediction Framework | Provides calibrated confidence measures for model predictions | Generating prediction sets with guaranteed coverage for species identifications [5]. |
| GBIF (Global Biodiversity Information Facility) | Provides access to authoritative species distribution data | Cross-referencing citizen observations with known geographic ranges for validation [5]. |
| Structured Sampling Protocols | Standardized methods for data collection across volunteers | Ensuring consistent application of pitfall trapping or visual census methods [29]. |
| Citizen Science Platforms | Web and mobile interfaces for data submission and management | Customizable platforms like iNaturalist or custom-built solutions for specific projects. |
This application note demonstrates that hierarchical classification, particularly when enhanced with conformal prediction, provides a robust methodological foundation for taxonomic validation in citizen science. The proposed protocols and frameworks enable a scalable, efficient approach to data quality assurance that can adapt to the growing volume and complexity of citizen-generated ecological data. By implementing these structured validation systems, researchers can enhance the scientific credibility of citizen science while leveraging its unique advantages for large-scale ecological monitoring and research.
Application Notes: Bridging Clinical and Data Quality Frameworks
Conceptual Parallels: Medication Reconciliation and Data Verification
Medication reconciliation (MedRec) is a formal process for creating the most complete and accurate list possible of a patient's current medications and comparing this list against physician orders during care transitions to prevent errors of omission, duplication, dosing errors, or drug interactions [31]. This clinical safety framework offers valuable parallels for citizen science data quality, where analogous vulnerabilities exist in data transitions across collection, processing, and analysis phases. In MedRec, more than 40% of medication errors result from inadequate reconciliation during handoffs [31], similar to how data quality can degrade as information passes through different stakeholders in citizen science projects.
The hierarchical verification system proposed for citizen science adapts the structured, multi-step reconciliation process used in healthcare to create a robust framework for data quality management. Just as MedRec requires comparing medication lists across transitions, this system implements verification checkpoints at critical data transition points, addressing similar challenges of incomplete documentation, role ambiguity, and workflow inconsistencies that plague both domains [31] [32].
Quantitative Evidence Supporting Structured Reconciliation
Table 1: Documented Impact of Reconciliation Processes Across Domains
| Domain | Reconciliation Focus | Error/Discrepancy Rate Before | Error/Discrepancy Rate After | Reduction Percentage | Source |
|---|---|---|---|---|---|
| Hospital Medication Safety | Medication history accuracy | 70% of charts had discrepancies | 15% of charts had discrepancies | 78.6% | [31] |
| Ambulatory Patient Records | Prescription medication documentation | 87% of charts incomplete | 82% of charts complete after 3 years | 94.3% improvement | [31] |
| Newly Hospitalized Patients | Medication history discrepancies | 38% discrepancy rate | Not specified | Prevented harm in 75% of cases | [31] |
| Clinical Data Management | Data quality through edit checks | Variable error rates | Significant improvement | Ensures "fit for purpose" data | [33] |
The evidence from healthcare demonstrates that formal reconciliation processes substantially reduce errors and discrepancies. This empirical support justifies adapting these principles to citizen science data quality challenges. The documented success in reducing medication discrepancies from 70% to 15% through systematic reconciliation [31] provides a compelling precedent for implementing similar structured approaches in data verification systems.
Experimental Protocols
Hierarchical Verification Protocol for Citizen Science Data
This protocol adapts the five-step medication reconciliation process for citizen science data quality assurance, establishing verification checkpoints at critical data transition points.
Step 1: Develop Comprehensive Data Inventory
The initial phase involves creating a complete inventory of all raw data elements collected through citizen science activities, analogous to developing a patient's current medication list in MedRec [31]. This comprehensive inventory must include:
- Primary observation data: Direct measurements, counts, or recordings
- Contextual metadata: Timestamps, geographic coordinates, environmental conditions
- Collection methodology: Equipment used, protocols followed, observer qualifications
- Supporting documentation: Photographs, audio recordings, field notes
Implementation requires standardized digital forms or templates that prompt citizens for complete information, similar to structured medication history forms in clinical settings. The inventory should capture both quantitative measurements and qualitative observations, recognizing that over-the-counter medications and supplements in MedRec parallel incidental observations or informal data in citizen science that are often overlooked but potentially significant [31].
Step 2: Develop Verified Reference Dataset
This step establishes the authoritative reference dataset against which citizen observations will be compared, mirroring the "medications to be prescribed" list in clinical MedRec [31]. The reference dataset compilation involves:
- Expert-curated data: Observations verified by professional scientists
- Historical baseline data: Established patterns from previous research
- Predictive model outputs: Expected values based on scientific models
- Corroborating observations: Supporting data from independent sources
The protocol requires explicit documentation of reference data sources, quality ratings, and uncertainty measures, implementing the clinical data management principle of ensuring data is "fit for purpose" for its intended research use [33].
Step 3: Systematic Comparison and Discrepancy Identification
The core reconciliation activity involves comparing the citizen science data inventory against the verified reference dataset to identify discrepancies, following the medication comparison process that identifies omissions, duplications, and dosing errors [31]. The protocol implements both automated and manual comparison methods:
- Automated validation checks: Range testing, format verification, and outlier detection
- Pattern analysis: Consistency with established temporal, spatial, or behavioral patterns
- Cross-validation: Comparison with correlated variables or complementary datasets
- Expert review: Professional scientist evaluation of ambiguous cases
Each identified discrepancy must be categorized using a standardized taxonomy (e.g., measurement error, identification error, contextual error, recording error) with documented severity assessment.
Step 4: Data Quality Decision-Making
Clinical decisions based on medication comparisons [31] translate to data quality determinations in this citizen science adaptation. The protocol establishes a structured decision matrix:
Table 2: Data Quality Decision Matrix
| Discrepancy Type | Severity Level | Automated Action | Expert Review Required | Final Disposition |
|---|---|---|---|---|
| Minor formatting | Low | Auto-correction | No | Include in dataset with correction note |
| Moderate measurement | Medium | Flag for review | Yes (expedited) | Include with uncertainty rating |
| Major identification | High | Flag for review | Yes (comprehensive) | Exclude or major correction |
| Critical systematic | Critical | Quarantine dataset | Yes (multidisciplinary) | Exclude and investigate root cause |
This decision framework incorporates quality management principles from clinical data management, including edit checks and validation procedures [33].
Step 5: Communication and Dataset Integration
The final step ensures proper documentation and communication of reconciliation outcomes, mirroring how new medication lists are communicated to appropriate caregivers and patients in clinical settings [31]. Implementation includes:
- Data quality tags: Embedded metadata documenting verification status
- Version control: Maintenance of original and reconciled datasets
- Stakeholder notification: Feedback to citizen scientists on data quality
- Repository integration: Structured incorporation into master research databases
The protocol emphasizes closed-loop communication to provide citizen scientists with constructive feedback, supporting continuous improvement in data collection practices.
Implementation Strategy Protocol
Successful implementation of the hierarchical verification system requires deliberate strategies adapted from healthcare implementation science. Based on analysis of MedRec implementation [32], this protocol outlines specific approaches:
Planning Strategies
Implementation begins with comprehensive planning activities adapted from the ERIC taxonomy "Plan" strategies [32]:
- Readiness assessment: Evaluate technological infrastructure, stakeholder willingness, and resource availability
- Barrier identification: Anticipate technical, cultural, and practical obstacles to adoption
- Timeline development: Establish phased implementation schedule with milestones
- Stakeholder engagement: Identify and involve key participants from scientific and citizen communities
Planning should specifically address the interprofessional collaboration challenges noted in MedRec implementation [32], developing protocols for communication between data scientists, domain experts, project coordinators, and citizen participants.
Education and Training Strategies
Effective implementation requires education strategies mirroring those used for MedRec [32]:
- Development of training materials: Create tutorials, quick reference guides, and video demonstrations
- Structured training sessions: Conduct workshops for both citizen scientists and research team members
- Ongoing support system: Establish help desks, discussion forums, and mentor programs
- Feedback mechanisms: Implement structured processes for user input and system refinement
Training should emphasize both technical skills and conceptual understanding of the verification process rationale.
Restructuring Strategies
Workflow redesign represents a critical implementation component, addressing the restructure category of ERIC strategies [32]:
- Process mapping: Document current data flows and identify verification insertion points
- Role definition: Clarify responsibilities for data collectors, verifiers, and validators
- Technology implementation: Deploy tools supporting hierarchical verification
- Incentive alignment: Develop recognition systems for high-quality data contribution
Restructuring should specifically consider the workflow challenges identified in clinical settings where medication reconciliation processes required significant reengineering of existing practices [31].
The Scientist's Toolkit: Research Reagent Solutions
Table 3: Essential Research Reagents for Hierarchical Verification Systems
| Tool Category | Specific Solutions | Function | Implementation Considerations |
|---|---|---|---|
| Data Collection Management | Electronic Case Report Forms (eCRFs) [34] | Standardized digital data capture with validation rules | Ensure 21 CFR Part 11 compliance for regulatory studies [34] |
| Clinical Data Management Systems | Oracle Clinical, Rave, eClinical Suite [34] | Centralized data repository with audit trails | Select systems supporting hierarchical user roles and permissions |
| Quality Control Tools | Edit Check Systems, Range Checks [33] | Automated validation during data entry | Configure tolerances based on scientific requirements |
| Medical Coding Systems | MedDRA (Medical Dictionary for Regulatory Activities) [34] | Standardized terminology for adverse events and observations | Adapt for domain-specific citizen science terminology |
| Statistical Analysis Packages | R, Python, SAS [35] | Descriptive and inferential analysis for quality assessment | Implement predefined quality metrics and automated reporting |
| Data Standards | CDISC (Clinical Data Interchange Standards Consortium) [34] | Standardized data structures for interoperability | Adapt domains for specific research contexts |
| Source Data Verification Tools | Targeted SDV (Source Data Verification) [34] | Efficient sampling-based verification of critical data | Focus on high-impact data elements for resource optimization |
The toolkit emphasizes solutions that support the "fit for purpose" data quality approach from clinical data management [33], ensuring verification resources focus on the most critical data elements. Implementation should follow the quality management fundamental of establishing detailed standard operating procedures (SOPs) for each tool's use [33], promoting consistency across verification activities.
The hierarchical verification system demonstrates how clinical safety frameworks can be systematically adapted to address data quality challenges in citizen science. By implementing this structured approach, research projects can enhance data reliability while maintaining citizen engagement, ultimately supporting more robust scientific outcomes from participatory research models.
Integration with Existing Research Workflows and Data Management Systems
The exponential growth in data volume from modern research methodologies, including citizen science and decentralized clinical trials, necessitates robust integration with existing data management workflows. Effective integration is crucial for maintaining data quality, ensuring reproducibility, and facilitating seamless data flow across systems. This protocol examines hierarchical verification systems that combine automated processes with expert oversight to manage large-scale data streams efficiently. By implementing structured workflows and leveraging existing institutional infrastructure, researchers can enhance data integrity while optimizing resource allocation across scientific disciplines.
Hierarchical Verification Framework for Data Quality
Conceptual Foundation and Current Approaches
Hierarchical verification employs tiered processes to balance data quality assurance with operational efficiency. In ecological citizen science, verification approaches systematically reviewed across 259 schemes reveal that expert verification remains the most widely implemented method (particularly among longer-running schemes), followed by community consensus and automated approaches [4]. This multi-layered framework strategically allocates resources by processing routine data through automated systems while reserving complex cases for human expertise.
The fundamental principle of hierarchical verification recognizes that not all data points require identical scrutiny. Current implementations demonstrate that automated systems can effectively handle the bulk of records, while flagged records undergo additional verification levels by experts [4] [36]. This approach addresses the critical challenge of maintaining data quality amid exponentially growing datasets while managing limited expert resources.
Quantitative Analysis of Verification Methods
Table 1: Verification Approaches in Ecological Citizen Science Schemes (Based on Systematic Review of 142 Schemes)
| Verification Approach | Prevalence Among Schemes | Key Characteristics | Typical Implementation Context |
|---|---|---|---|
| Expert Verification | Most widely used | Highest accuracy, resource-intensive | Longer-running schemes; critical research applications |
| Community Consensus | Intermediate prevalence | Scalable, variable accuracy | Platforms with active user communities; preliminary filtering |
| Automated Approaches | Emerging adoption | High efficiency, requires validation | Large-volume schemes; structured data inputs |
| Hybrid/Hierarchical | Limited but growing | Balanced efficiency/accuracy | Complex schemes with diverse data types and quality requirements |
Table 2: Data Collection Structure and Implications for Verification
| Project Structure Type | Verification Needs | Optimal Verification Methods | Example Projects |
|---|---|---|---|
| Unstructured | High | Expert-heavy hierarchical | iNaturalist [37] |
| Semi-structured | Moderate | Balanced hybrid approach | eBird, eButterfly [37] |
| Structured | Lower | Automation-focused | UK Butterfly Monitoring Scheme [37] |
Integration Protocols for Research Data Management
Workflow Design and Implementation
Effective data management workflow implementation requires moving beyond theoretical plans to actionable, comprehensive guides tailored to specific research groups [38]. The four fundamental components of an efficient data management workflow include:
- File organization and naming scheme: Ensuring consistent, navigable folder and file structures
- Data management roles: Clear assignment of data responsibility among team members
- Data storage/sharing guide: Protocols for secure storage and controlled sharing
- Training and evaluation: Ongoing skill development and process assessment [38]
Integration with electronic lab notebooks (ELNs) and inventory management systems creates seamless data flow between active research phases and archival stages. Platforms like RSpace provide connectivity between ELN and inventory systems, enabling automatic updates and persistent identifier tracking to maintain data integrity across systems [39].
Electronic Health Record Integration for Clinical Research
The UCSD COVID-19 NeutraliZing Antibody Project (ZAP) demonstrates successful EHR-integrated clinical research, enrolling over 2,500 participants by leveraging existing EHR infrastructure (Epic MyChart) [40]. This approach enabled:
- Participant self-scheduling through patient portals linked to medical records
- Electronic consent processes completed remotely via eCheck-in
- Integration with existing testing operations, staff, laboratory, and mobile applications
- Automated follow-up questionnaires at 30 and 90 days post-initial visit
- Direct return of results to participants through secure patient portals
The project achieved a 92.5% initial visit completion rate, with 70.1% and 48.5% response rates for 30-day and 90-day follow-up surveys respectively [40]. This case study highlights how EHR integration expands research reach across health systems while facilitating rapid implementation during public health crises.
Figure 1: EHR-Integrated Clinical Research Workflow. This diagram illustrates the seamless flow from recruitment through data collection and follow-up within an electronic health record system.
Experimental Protocols for Hierarchical Verification
Conformal Taxonomic Validation Protocol
The conformal taxonomic validation framework provides a semi-automated approach for citizen science data verification using conformal prediction methods [5]. This protocol implements a hierarchical classification system that:
- Processes citizen science records through deep-learning models
- Generates prediction sets with statistical confidence measures
- Flags uncertain records for expert verification
- Calibrates confidence thresholds using validation datasets
Materials and Equipment:
- Citizen science record collections (e.g., GBIF-sourced data)
- Deep-learning infrastructure with hierarchical classification capabilities
- Validation datasets for model calibration
- Computational resources for conformal prediction implementation
Procedure:
- Data Acquisition: Access citizen science records from repositories (GBIF DOI: 10.15468/dl.5arth9, 10.15468/dl.mp5338, etc.) [5]
- Model Training: Implement hierarchical deep-learning models using code from accessible repositories (https://gite.lirmm.fr/mdecastelbajac/conformaltaxonomicprediction)
- Confidence Calibration: Calibrate models using conformal prediction to generate valid prediction sets
- Automated Processing: Process records through calibrated models, automatically verifying high-confidence classifications
- Expert Routing: Flag low-confidence predictions for manual verification by taxonomic experts
- System Refinement: Incorporate expert-verified records into future training sets to improve model performance
Data Marginal Value Assessment Protocol
This protocol addresses spatial and temporal biases in citizen science data by optimizing sampling strategies to maximize information content [37]. The methodology determines the "marginal value" of biodiversity sampling events (BSEs) to guide participant efforts toward under-sampled regions or time periods.
Materials and Equipment:
- Existing citizen science dataset with spatial and temporal metadata
- Geographic information system (GIS) software
- Statistical computing environment (R, Python)
- Spatial mapping tools
Procedure:
- Data Characterization: Map existing sampling intensity across spatial and temporal dimensions
- Value Modeling: Develop models that assign higher value to BSEs from under-sampled regions, proportional to distance from nearest existing BSE [37]
- Gap Identification: Identify spatial and temporal sampling gaps based on habitat/biome stratification
- Participant Guidance: Develop algorithms suggesting high-value sampling locations and times to participants
- Incentive Structure: Implement reputation systems or leaderboards that reward high-value contributions rather than simply quantity
- Impact Assessment: Monitor changes in data structure and downstream analytical performance following implementation
Table 3: Optimization Strategies for Spatial and Temporal Sampling
| Sampling Dimension | Research Applications | Optimization Strategy |
|---|---|---|
| High Spatial Resolution | Species distribution models, biodiversity measurements, phylogeographical research | Prioritize homogeneous or stratified spatial sampling; value proportional to distance from existing samples [37] |
| High Temporal Resolution | Population trends, detection probabilities, full-annual-cycle research, invasive species detection | Encourage repeated sampling at established sites; value based on temporal gaps in existing data [37] |
The Scientist's Toolkit: Research Reagent Solutions
Table 4: Essential Tools for Integrated Research Data Management
| Tool Category | Specific Solutions | Function | Integration Capabilities |
|---|---|---|---|
| Electronic Lab Notebooks | RSpace ELN | Document experimental procedures, link samples to data, facilitate collaboration | Connects with inventory management, supports PID tracking, repository exports [39] |
| Inventory Management | RSpace Inventory | Track samples, materials, and equipment using barcodes and IGSN identifiers | Integrates with ELN, mobile access, template-based sample creation [39] |
| Clinical Data Integration | EHR Systems (Epic, Cerner) | Integrate clinical research with patient care workflows | MyChart integration, eConsent, automated follow-up [40] |
| Citizen Science Platforms | iNaturalist, eBird, Zooniverse | Collect biodiversity data at scale | API access, community verification, data export [4] [37] |
| Data Standards | CDISC, HL7 FHIR | Standardize data structure for interoperability | Foundational standards for data acquisition, exchange, and analysis [41] |
Workflow Automation and Interoperability Solutions
Automated Workflow Implementation
Automation addresses critical inefficiencies in traditional research processes by reducing manual data entry, minimizing repetitive tasks, and enhancing precision in data management [42]. Implementation strategies include:
- ETL (Extract, Transform, Load) Tools: Automate data integration from multiple sources
- Template-Driven Standardization: Ensure consistent data entry across users and systems
- Real-Time Data Updates: Facilitate immediate access to current information for all stakeholders
- Centralized Monitoring: Enable anomaly detection and proactive issue resolution
The transition to automated workflows requires careful planning and execution. Assessment of current data processes should identify bottlenecks and inefficiencies before establishing data quality management protocols and implementing appropriate automation solutions [43].
Figure 2: Hierarchical Data Verification Workflow. This three-tiered approach efficiently allocates verification resources based on data complexity and uncertainty levels.
Interoperability Standards and Best Practices
Effective data integration relies on established standards and implementation practices. Core standards include:
- CDISC Foundational Standards: CDASH (data collection), SDTM (data tabulation), ADaM (analysis datasets) [41]
- CDISC Exchange Standards: ODM, Define-XML, Dataset-JSON for sharing structured data across systems [41]
- HL7 FHIR Resources: APIs and standards for healthcare data integration, particularly EHR systems [41]
Implementation best practices recommend defining integration goals early in project planning, mapping all data sources and formats, selecting platforms supporting open standards, establishing cross-functional governance teams, and validating data pipelines before launch [41]. These approaches ensure seamless communication between diverse systems while maintaining data integrity throughout the research lifecycle.
Integration with existing research workflows and data management systems represents a critical advancement for handling increasingly large and complex scientific datasets. The hierarchical verification framework provides a scalable approach to data quality assurance, while standardized protocols and interoperability solutions enable efficient data flow across research ecosystems. By implementing these structured approaches, researchers can enhance data integrity, optimize resource allocation, and accelerate scientific discovery across diverse domains from citizen science to clinical research.
Solving Data Quality Challenges: Optimization Strategies for Reliable Outcomes
In the context of citizen science and ecological research, the reliability of data is paramount for producing valid scientific outcomes. A systematic approach to understanding data quality begins with a clear taxonomy of defects. Research in healthcare administration data, which shares similarities with citizen science in terms of data volume and variety of sources, has established a comprehensive taxonomy categorizing data defects into five major types: missingness, incorrectness, syntax violation, semantic violation, and duplicity [44]. This document focuses on the three most prevalent categories—Missingness, Incorrectness, and Duplication—framed within a hierarchical verification system for citizen science data quality research. The inability to address these defects can lead to misinformed decisions, reduced research efficiency, and compromised trust in scientific findings [45] [46].
An analysis of a large-scale Medicaid dataset comprising over 32 million cells revealed a significant density of data defects, with over 3 million individual defects identified [44]. This quantitative assessment underscores the critical need for systematic defect detection and resolution protocols in large datasets, a common characteristic of citizen science projects.
Table 1: Prevalence of Major Data Defect Categories in a Healthcare Dataset Analysis
| Defect Category | Description | Prevalence Notes |
|---|---|---|
| Missingness | Data that is absent or incomplete where it is expected to be present [44]. | Contributes to reduced data completeness and potential analytical bias. |
| Incorrectness | Data that is present but erroneous, inaccurate, or invalid [44]. | Often includes implausible values and invalid codes. |
| Duplicity | Presence of duplicate records or entities within a dataset [44]. | Leads to overcounting and skewed statistical analyses. |
Table 2: Data Quality Dimensions and Associated Metrics for Defect Assessment
| Quality Dimension | Definition | Example Metric/KPI |
|---|---|---|
| Completeness | The extent to which data is comprehensive and lacks gaps [45]. | Data Completeness Ratio (%) |
| Accuracy | The degree to which data correctly reflects the real-world values it represents [45]. | Data Accuracy Rate (%) |
| Uniqueness | The absence of duplicate records or entities within the dataset [45]. | Unique Identifier Consistency |
| Validity | The conformity of data to predefined syntax rules and standards [45]. | Percentage of values adhering to format rules |
Hierarchical Verification System for Citizen Science Data
Verification is the critical process of checking records for correctness, which in ecological citizen science typically involves confirming species identity [4]. A hierarchical verification system optimizes resource allocation by automating the bulk of record checks and reserving expert effort for the most complex cases.
System Workflow and Logic
The following diagram illustrates the logical workflow of a hierarchical verification system for citizen science data, from initial submission to final validation.
Protocol 1: Automated Data Validation Check
Objective: To programmatically identify and flag obvious data defects related to missingness, incorrectness, and syntax at the point of entry [44].
Methodology:
- Constraint Definition: Define a set of validation rules based on the data taxonomy.
- Missingness Check: Identify mandatory fields that contain null or empty values.
- Syntax Violation Check: Validate data formats (e.g., date
YYYY-MM-DD, geographic coordinates). - Plausibility/Incorrectness Check: Compare numerical values against predefined plausible ranges (e.g., latitude -90 to 90, positive values for count data) [44].
- Implementation: Execute a software script or use database constraints to scan submitted data batches against the defined rules.
- Output: Records are categorized as:
- Pass: Proceed to community verification.
- Fail: Flagged for specific defects and routed to expert verification.
Protocol 2: Community Consensus Verification
Objective: To leverage the collective knowledge of the citizen science community for verifying records that passed automated checks [4].
Methodology:
- Platform Setup: Implement a system where records (e.g., species observations with photos) are visible to other experienced community members.
- Voting/Agreement Mechanism: Allow users to vote on the correctness of identifications. A record is considered verified when it reaches a predefined consensus threshold (e.g., 95% agreement from a minimum of 5 voters) [4].
- Output: Records achieving consensus are marked as validated. Records failing to achieve consensus or with significant disagreement are escalated to expert review.
Protocol 3: Expert Verification
Objective: To provide authoritative validation for records that are complex, ambiguous, or failed previous verification stages [4].
Methodology:
- Triaging: Experts receive a queue of records flagged by automated checks or community review.
- In-depth Analysis: Experts examine all available evidence, including photos, metadata, geographic context, and comparator data from trusted sources.
- Determination: Experts make a final determination on the record's validity, correcting identifications or data values as necessary.
- Feedback Loop: Expert decisions can be used to refine the rules for the automated system and educate the community.
The Researcher's Toolkit: Essential Reagents and Materials
Table 3: Key Research Reagent Solutions for Data Quality Management
| Item / Tool Category | Function / Purpose | Example Use Case |
|---|---|---|
| Data Profiling Tools | To automatically analyze the content, structure, and quality of a dataset [45]. | Identifying the percentage of missing values in a column or detecting invalid character patterns. |
| Reference Datasets & Libraries | To provide a ground-truth standard for validating data correctness. | Verifying species identification against a curated taxonomic database. |
| Statistical Environment (R/Python) | To conduct descriptive analysis and detect extreme or abnormal values programmatically [44]. | Calculating summary statistics (mean, percentiles) to identify implausible values. |
| Data Quality Matrix | A visual tool that represents the status of various data quality metrics across dimensions [45]. | Tracking and communicating the completeness, accuracy, and uniqueness of a dataset over time. |
| Conformal Prediction Frameworks | A semi-automated validation method that provides confidence levels for classifications, suitable for hierarchical systems [5]. | Assigning a confidence score to an automated species identification, flagging low-confidence predictions for expert review. |
Overcoming Source Fragmentation and Contradictory Information
Source fragmentation and contradictory information represent significant bottlenecks in citizen science (CS), potentially compromising data quality and subsequent scientific interpretation. In metabolomics, a field with vast chemical diversity, the identification of unknown metabolites remains a primary challenge, rendering the interpretation of results ambiguous [47]. Similarly, CS projects must navigate complexities arising from interactions with non-professional participants and multiple stakeholders [48]. A hierarchical verification system provides a structured framework to overcome these issues by implementing sequential data quality checks, thereby enhancing the reliability of crowdsourced data. This protocol outlines detailed methodologies and reagents for establishing such a system, framed within the context of citizen science data quality research.
The Scientist's Toolkit: Research Reagent Solutions
The following table details essential materials and digital tools required for implementing a hierarchical verification system in citizen science, particularly for projects involving chemical or environmental data.
Table 1: Key Research Reagent Solutions for Citizen Science Data Quality
| Item Name | Function/Brief Explanation |
|---|---|
| Fragmentation Tree Algorithms | Computational tools used to predict the fragmentation pathway of a molecule, aiding in the annotation of unknown metabolites and providing structural information beyond standard tandem MS [47]. |
| Ion Trap Mass Spectrometer | An instrument capable of multi-stage mass spectrometry (MSn), enabling the recursive reconstruction of fragmentation pathways to link specific substructures to complete molecular structures [47]. |
| Protocols.io Repository | An open-access repository for science methods that facilitates the standardized sharing of detailed experimental protocols, ensuring reproducibility and reducing methodological fragmentation across teams [49]. |
| JoVE Unlimited Video Library | A resource providing video demonstrations of experimental procedures and protocols, which is critical for training citizen scientists and ensuring consistent data collection practices [49]. |
| axe-core Accessibility Engine | An open-source JavaScript library for testing web interfaces for accessibility, including color contrast, ensuring that data collection platforms are usable by all participants, which is crucial for data quality and inclusivity [50]. |
| SpringerNature Experiments | A database of peer-reviewed, reproducible life science protocols, providing a trusted source for standardized methods that can be adapted for citizen science project design [49]. |
Summarizing quantitative data from CS projects is essential for identifying patterns and justifying protocol adjustments. The tables below consolidate key metrics related to data quality and participant engagement.
Table 2: Comparative Analysis of Project Outcomes and Participant Engagement
| Project / Variable | Sample Size (n) | Mean | Standard Deviation | Key Finding |
|---|---|---|---|---|
| Gorilla Chest-Beating (Younger) [51] | 14 | 2.22 beats/10h | 1.270 | Younger gorillas exhibited a faster mean chest-beating rate. |
| Gorilla Chest-Beating (Older) [51] | 11 | 0.91 beats/10h | 1.131 | Highlighted a distinct biological difference via quantitative comparison. |
| Forest Observation Project [48] | 3,800 data points | N/A | N/A | Participation was insufficient for scientific objectives, leading to project termination. |
| 50,000 Observations Target [48] | 0 (Target not met) | N/A | N/A | Illustrates that over-simplified tasks can fail to motivate participants. |
Table 3: Summary of Quantitative Data on Participant Behavior and Data Quality
| Metric | Observation / Value | Implication for Project Design |
|---|---|---|
| Self-Censorship of Data [48] | Prevalent among volunteers in Vigie-Nature and Lichens GO | Fear of error can lead to harmful data gaps; open communication about error risk is vital. |
| Data Quality vs. Professional Standards [48] | Rivals data collected by professionals in many projects | Challenges scientist skepticism and underscores the potential of well-designed CS. |
| Motivation for Participation [48] | Driven by skill-matched challenge and personal relevance | Tasks must be engaging and make volunteers feel their contribution is unique and valuable. |
Experimental Protocols for Hierarchical Verification
Protocol: Multi-Stage Mass Spectral (MSn) Analysis for Metabolite Identification
This protocol provides a step-by-step methodology for using MSn ion trees to overcome fragmentation and contradictory annotations in metabolite identification, a common source fragmentation issue [47].
4.1.1 Setting Up
- Instrument Preparation: Reboot the controlling computer of the ion trap mass spectrometer (e.g., Linear Quadrupole Ion Trap, Orbitrap). Ensure the instrument is calibrated for accurate mass measurement.
- Software Initialization: Launch the data acquisition software (e.g., capable of data-dependent ion tree experiments) and the fragmentation tree analysis software (e.g., Mass Frontier).
- Parameter Application: Verify the settings for electrospray ionization (ESI), source temperature, and gas flows. Confirm that the collision-induced dissociation (CID) parameters are set for the expected molecular weight range (<2 kDa) [47].
4.1.2 Greeting and Consent (For Human Subjects Research)
- If the study involves human samples, meet the participant at a designated location and escort them to the lab.
- Settle the participant and present the informed consent document. Emphasize the main points, including the purpose of the research, procedures, risks, benefits, and confidentiality.
4.1.3 Instructions and Data Acquisition
- Sample Introduction: Introduce the sample via direct infusion or flow injection into the ESI source [47].
- MS1 Survey Scan: Acquire a full MS1 scan to identify the precursor ion of the unknown metabolite based on accurate mass.
- Data-Dependent MS2 Acquisition: The software automatically selects the most intense precursor ions for fragmentation. Collect MS2 spectra to obtain the first-generation product ions.
- MSn Ion Tree Construction: For the primary product ions in the MS2 spectrum, initiate subsequent rounds of fragmentation (MS3, MS4, etc.). This data-dependent acquisition populates the ion tree, delineating dependencies between precursor and product ions across stages [47].
- Monitoring: Monitor the signal intensity to ensure sufficient ion population for MSn analysis. The process is typically automated after initiation.
4.1.4 Data Analysis and Saving
- Fragmentation Tree Computation: Process the acquired MSn spectra using computational algorithms to generate a fragmentation tree. This tree explores the fragmentation process and predicts rules for substructure identification [47].
- Structural Annotation: Annotate the nodes of the mass spectral tree with putative substructures, using the hierarchical dependencies to resolve ambiguities (e.g., differentiating between 6-C and 8-C-glycosidic flavonoids) [47].
- Data Saving: Save the raw spectral data, the computed fragmentation tree, and the annotation results in a non-proprietary, archived format.
4.1.5 Exceptions and Unusual Events
- Participant Withdrawal: If a participant withdraws consent, their data must be deleted immediately and permanently from all systems, as detailed in the protocol.
- Instrument Failure: In case of a software crash or instrument error, note the event in the lab log, shut down the instrument according to manufacturer guidelines, and restart the procedure.
Protocol: Hierarchical Data Quality Verification in Citizen Science
This protocol establishes a multi-layered verification process to manage data originating from fragmented sources and multiple contributors, mitigating contradictory information.
4.2.1 Setting Up
- Platform Configuration: Reboot and ensure the CS data collection platform (e.g., gamified website, mobile app) is functioning. Verify that data logging is active.
- Protocol Standardization: Publish the detailed data collection protocol on an open-access platform like
protocols.ioto ensure all participants and partners have access to the same standardized instructions [49].
4.2.2 Stakeholder Engagement and Co-Design
- Stakeholder Identification: Actively identify and engage a complex network of stakeholders, including researchers, coordinators, non-governmental organizations (NGOs), funding bodies, and potential volunteers [48].
- Collaborative Design: Conduct workshops to co-design the project. Acknowledge and document the different objectives of each stakeholder (e.g., data collection for researchers, environmental education for NGOs) to build a convergent, common goal and avoid later contradiction [48].
4.2.3 Data Collection and Tiered Verification
- Task Instructions: Do not rely on participants reading instructions alone. Implement a system where an experimenter or a locked screen provides aural or forced instructions, respectively, followed by representative practice trials [52].
- Level 1 - In-situ Validation: Design tasks that are challenging and matched to participant skills to foster engagement and a sense of responsibility, thereby improving initial data quality [48]. Avoid over-simplification.
- Level 2 - Automated Plausibility Checks: Implement software rules (e.g., using an open-source engine like
axe-corefor data format checks) to flag physiologically or contextually impossible values at the point of entry [50]. - Level 3 - Community Verification: Foster a learning community where participants can view and comment on each other's data. This creates a system of quality control by imitation and peer review, reducing the need for hidden error-control mechanisms [48].
- Level 4 - Expert Audit: A subset of the data, especially flagged entries, should be periodically audited by professional researchers to calibrate the automated and community verification systems.
4.2.4 Data Saving and Project Breakdown
- Secure Data Saving: Upon project completion, save the final, verified dataset with a complete version history and a record of all verification steps applied.
- Debriefing: Debrief participants and stakeholders on the outcomes, sharing how their contributions were used and the findings of the research.
4.2.5 Exceptions and Unusual Events
- Data Vandalism: While extremely rare [48], have a documented process for identifying and removing malicious data entries while preserving the raw data audit trail.
- Coordinator Burnout: Avoid the assumption that a single coordinator can handle all tasks. Hire skilled individuals for specific roles like communication and community management to prevent burnout [48].
Workflow Visualization
The following diagrams, generated with Graphviz using the specified color palette and contrast rules, illustrate the core concepts and workflows.
Hierarchical Data Verification Workflow
MSn Ion Tree for Metabolite ID
In the context of citizen science and drug development research, a Multi-dimensional Hierarchical Evaluation System (MDHES) provides a structured framework for data quality assessment prior to resource allocation decisions [53]. This system quantitatively evaluates data across multiple dimensions—including completeness, accuracy, consistency, variety, and timeliness—enabling objective determination of whether automated processes or human expertise are better suited for specific research tasks [53].
The transition toward AI-powered automation is accelerating across research domains. By 2025, an estimated 80% of manual tasks may be transformed through automation, creating an urgent need for systematic allocation frameworks [54]. In drug discovery, AI has demonstrably compressed early-stage research timelines from years to months while reducing the number of compounds requiring synthesis by up to 10-fold [55]. This landscape necessitates precise protocols for deploying limited human expertise where it provides maximum strategic advantage.
Hierarchical Verification System Framework
Multi-Dimensional Data Quality Assessment
The MDHES framework evaluates data quality across ten defined dimensions, calculating individual scores for each to identify specific strengths and weaknesses [53]. This granular assessment informs appropriate resource allocation between automated and human-driven approaches.
Table: Data Quality Dimensions for Hierarchical Verification
| Dimension | Calculation Method | Optimal for Automation | Requires Human Expertise |
|---|---|---|---|
| Completeness | θ₁₁ = min(1, Ω₁₁/℧₁₁) × 100% [53] | Score > 90% | Score < 70% |
| Accuracy | Comparison against benchmark datasets [53] | Standardized, structured data | Complex, unstructured data |
| Consistency | Measurement of variance across data sources [53] | Low variance (σ² < threshold) | High variance or contradictions |
| Variousness | Assessment of feature diversity [53] | Limited diversity requirements | High diversity with subtle patterns |
| Equalization | Analysis of data distribution balance [53] | Balanced distributions | Skewed distributions requiring interpretation |
| Logicality | Verification of logical relationships [53] | Rule-based logical checks | Context-dependent reasoning |
| Fluctuation | Measurement of data stability over time [53] | Stable, predictable patterns | Highly variable with context shifts |
| Uniqueness | Identification of duplicate entries [53] | Exact matching scenarios | Fuzzy matching requiring judgment |
| Timeliness | Assessment of data freshness and relevance [53] | Real-time processing needs | Historical context dependence |
| Standardization | Verification against established formats [53] | Well-defined standards | Evolving or ambiguous standards |
Comprehensive Quality Scoring Protocol
Following individual dimension assessment, a comprehensive evaluation method incorporating a fuzzy evaluation model synthesizes these scores while accounting for interactions between dimensions [53]. This approach achieves dynamic balance between quantitative metrics and qualitative assessment, harmonizing subjective and objective criteria for final data quality classification [53].
The output is a hierarchical verification score that determines appropriate processing pathways:
- Tier 1 (Score 85-100%): Fully automated processing suitable
- Tier 2 (Score 70-84%): Mixed automation with human oversight
- Tier 3 (Score < 70%): Primarily human expertise with automated assistance
Decision Framework for Resource Allocation
Task Characterization Matrix
Different research tasks demonstrate varying suitability for automation based on their inherent characteristics. The following matrix provides a structured approach to task classification.
Table: Task Characterization Matrix for Resource Allocation
| Task Category | Automation Advantage | Human Expertise Advantage | Allocation Protocol |
|---|---|---|---|
| Data Processing | 70-80% faster processing; 24/7 operation [54] | Contextual interpretation; Exception handling | Automated for standardized, repetitive tasks |
| Pattern Recognition | Large dataset analysis; Hidden pattern detection [56] | Intuitive pattern recognition; Cross-domain knowledge | Hybrid: AI identification with human validation |
| Quality Control | Consistent rule application; High-volume checking [57] | Nuanced quality assessment; Evolving standards | Tiered: Automated first pass, human complex cases |
| Problem Solving | Rapid parameter optimization [55] | Creative solution generation; Strategic framing | Human-led with automated simulation |
| Decision Making | Data-driven recommendations; Real-time adjustments [58] | Ethical considerations; Long-term implications | Human responsibility with AI support |
Resource Allocation Decision Protocol
The allocation decision protocol begins with task decomposition and classification, followed by data quality assessment, and culminates in appropriate resource assignment.
Experimental Protocols for Verification
Data Quality Assessment Protocol
Objective: Quantitatively evaluate citizen science data quality using MDHES framework to determine appropriate processing pathways.
Materials:
- Raw citizen science datasets
- Benchmark validation datasets
- MDHES calculation formulas
- Data profiling tools
Methodology:
- Data Profiling: Execute comprehensive data analysis to establish baseline metrics including row counts, null value percentages, and value distributions [57]
- Dimension Scoring: Calculate individual scores for each quality dimension using defined formulas [53]
- Fuzzy Evaluation: Apply fuzzy evaluation model to synthesize dimension scores into comprehensive quality assessment [53]
- Tier Classification: Assign data to appropriate verification tier based on comprehensive score
- Pathway Assignment: Direct data to corresponding processing pathway (automated, hybrid, or human-led)
Quality Control:
- Implement peer review for all new data transformations [57]
- Conduct monthly audits for top critical datasets [57]
- Establish data validation checkpoints at pipeline entry points [57]
Hybrid Verification Protocol
Objective: Implement human-AI collaborative workflow for medium complexity data verification tasks.
Materials:
- Tier 2 classified datasets (70-84% quality score)
- AI-powered validation tools
- Expert researcher access
- Annotation platform
Methodology:
- Automated First Pass: Deploy AI systems for initial data validation and anomaly detection [59]
- Exception Identification: Flag records with confidence scores below 85% for human review [58]
- Expert Sampling: Implement stratified sampling protocol for human verification (5-20% based on quality tier)
- Model Refinement: Incorporate human-verified results into AI training feedback loop [56]
- Continuous Monitoring: Track system performance metrics and adjust allocation ratios accordingly
The Scientist's Toolkit: Research Reagent Solutions
Table: Essential Research Reagents and Platforms
| Tool Category | Specific Solutions | Function | Automation Compatibility |
|---|---|---|---|
| AI Discovery Platforms | Exscientia, Insilico Medicine, Recursion [55] | Target identification, compound design | Full automation for initial screening |
| Data Quality Assessment | MDHES Framework [53] | Multi-dimensional data evaluation | Automated scoring with human oversight |
| Federated Learning Systems | HDP-FedCD [60], Lifebit [56] | Privacy-preserving collaborative analysis | Automated model training |
| Clinical Trial Automation | BEKHealth, Dyania Health [59] | Patient recruitment, trial optimization | Hybrid automation-human coordination |
| Work Management Platforms | monday Work Management [58] | Resource allocation, project coordination | Intelligent automation with human governance |
Implementation Guidelines
Automation Deployment Protocol
Phase 1: Foundation (Months 1-3)
- Identify repetitive, high-volume tasks suitable for initial automation [58]
- Implement automated data validation checks at entry points [57]
- Establish baseline performance metrics
Phase 2: Integration (Months 4-6)
- Deploy AI-powered resource optimization tools [58]
- Implement predictive analytics for project timeline forecasting [58]
- Develop hybrid workflows for complex verification tasks
Phase 3: Optimization (Months 7-12)
- Continuous monitoring of automation performance
- Refine allocation ratios based on quality metrics
- Expand automated systems to additional use cases
Quality Assurance Framework
- Automated Monitoring: Implement data observability platforms tracking freshness, volume, and schema changes [57]
- Regular Audits: Conduct monthly cross-functional data audits examining accuracy, completeness, and consistency [57]
- Governance Structure: Establish clear data ownership matrix with defined roles and responsibilities [57]
Handling Edge Cases and Ambiguous Data Submissions
Within hierarchical verification systems for citizen science, handling edge cases and ambiguous data submissions is a critical challenge that directly impacts data quality and research outcomes. The very nature of citizen science—relying on contributions from volunteers with varying expertise—guarantees a continuous stream of observations that fall outside typical classification boundaries or validation pathways. This document establishes application notes and experimental protocols for identifying, processing, and resolving such problematic submissions, ensuring the integrity of downstream research, including applications in drug development where ecological data may inform natural product discovery.
Ambiguous data encompasses observations that are unclear, incomplete, or contradictory, making them difficult to verify automatically. Edge cases are rare observations that lie at the operational limits of identification keys and AI models, often representing the most taxonomically unusual or geographically unexpected records. A multi-dimensional hierarchical evaluation system (MDHES) provides the framework for systematically assessing these data points across multiple quality dimensions before routing them to appropriate resolution pathways [53].
Classification and Identification of Ambiguous Data
Quantitative Dimensions for Data Quality Assessment
A multi-dimensional approach enables precise identification of data ambiguities by quantifying specific quality failures. The following dimensions are calculated for each submission to flag potential issues [53].
Table 1: Data Quality Dimensions for Identifying Ambiguous Submissions
| Dimension | Calculation Formula | Interpretation | Threshold for Ambiguity |
|---|---|---|---|
| Completeness (Feature Comprehensiveness) | θ₁₁ = min(1, Ω₁₁/℧₁₁) × 100% | Measures percentage of expected features present in submission | < 85% |
| Consistency | C = (1 - (Nconflict / Ntotal)) × 100% | Measures logical alignment between related data fields | < 90% |
| Accuracy (Confidence Score) | A = P(correct|features) × 100% | AI-derived probability of correct identification | < 70% |
| Uniqueness | U = (1 - (Nduplicate / Ntotal)) × 100% | Measures novelty against existing observations | < 95% potentially indicates duplicate entry |
Experimental Protocol: Data Quality Dimension Calculation
Purpose: To quantitatively measure data quality dimensions for identifying ambiguous submissions.
Materials:
- Raw citizen science data submissions
- Reference benchmark dataset (comprehensive for target domain)
- Computing environment with Python/R statistical packages
- MDHES calculation scripts [53]
Procedure:
- Data Ingestion: Load submission data and corresponding benchmark dataset.
- Feature Mapping: Align submission features with benchmark features using semantic matching.
- Completeness Calculation:
- Count features present in submission (Ω₁₁)
- Count features in benchmark (℧₁₁)
- Calculate θ₁₁ = min(1, Ω₁₁/℧₁₁) × 100%
- Consistency Assessment:
- Define logical ruleset for data field relationships
- Count violations (Nconflict) across all records (Ntotal)
- Calculate C = (1 - (Nconflict / Ntotal)) × 100%
- Accuracy Estimation:
- For AI-identified submissions: extract confidence score (P)
- For human submissions: calculate agreement rate with preliminary validation
- Uniqueness Checking:
- Generate data fingerprint for each submission
- Compare against database using similarity hashing
- Calculate duplicate percentage (Nduplicate/Ntotal)
Validation: Repeat calculations across multiple citizen science platforms (e.g., iNaturalist, Zooniverse) to establish platform-specific thresholds.
Hierarchical Verification Workflow
The resolution of ambiguous submissions follows a hierarchical pathway that escalates cases based on complexity and required expertise. This system optimizes resource allocation by reserving human expert attention for the most challenging cases.
Figure 1: Hierarchical verification workflow for ambiguous data submissions. This multi-stage process efficiently routes cases based on complexity.
Experimental Protocol: Tiered Validation System
Purpose: To implement and evaluate a hierarchical validation system for resolving ambiguous data submissions.
Materials:
- Pre-trained CNN identification models [61]
- Citizen science platform with community features
- Domain expert panel (3-5 experts per domain)
- Data tracking system with audit capability
Procedure:
- AI Validation Layer:
- Process all submissions through CNN model
- Extract confidence scores and feature activation maps
- Route submissions based on confidence thresholds:
- >90%: Automatic approval
- 70-90%: Community review
- <70%: Expert review
- Community Review Layer:
- Present ambiguous submission to 5+ community validators
- Collect independent assessments
- Calculate agreement rate and confidence
- Escalate to experts if no consensus (agreement <80%)
- Expert Review Layer:
- Present case to domain specialist with full context
- Include similar validated cases for comparison
- Document resolution rationale for training data
- Feedback Integration:
- Provide specific feedback to original contributor
- Incorporate expert-validated cases into AI training sets
- Monitor same-contributor submission improvement
Quality Control: Implement blinding where validators cannot see previous assessments. Track time-to-resolution and inter-rater reliability metrics.
Resolution of Specific Edge Case Categories
Taxonomic Uncertainties
Taxonomic edge cases include cryptic species, phenotypic variants, and hybrid organisms that challenge standard classification systems. These cases require specialized resolution protocols.
Table 2: Taxonomic Edge Case Resolution Matrix
| Edge Case Type | Identification Characteristics | Resolution Protocol | Expert Specialization Required |
|---|---|---|---|
| Cryptic Species | Morphologically identical but genetically distinct species | Genetic barcoding validation; geographical distribution analysis | Taxonomic specialist with genetic analysis capability |
| Phenotypic Variants | Atypical coloration or morphology | Comparison with known variants; environmental correlation analysis | Organism-specific taxonomist |
| Hybrid Organisms | Intermediate characteristics between known species | Morphometric analysis; fertility assessment; genetic testing | Hybridization specialist |
| Life Stage Variations | Different appearances across developmental stages | Life stage tracking; reference to developmental sequences | Developmental biologist |
| Damaged Specimens | Incomplete or degraded specimens | Partial feature mapping; statistical inference from remaining features | Forensic taxonomy specialist |
Geographic and Temporal Anomalies
Observations occurring outside expected ranges or seasons represent another class of edge cases requiring careful validation.
Experimental Protocol: Geographic Anomaly Validation
Purpose: To validate observations that occur outside documented species ranges.
Materials:
- Historical distribution databases (GBIF, IUCN)
- Environmental niche modeling tools
- Satellite imagery and habitat data
- Local expert network
Procedure:
- Range Deviation Calculation:
- Calculate distance from known range boundaries
- Assess climatological similarity to native range
- Evaluate habitat connectivity
- Historical Precedent Research:
- Search for previous outlier records
- Verify historical validation status
- Identify range expansion patterns
- Alternative Explanation Elimination:
- Check for mislabelled collection locations
- Verify specimen wasn't transported artificially
- Assess potential misidentification
- Expert Consultation:
- Contact regional specialists
- Consult migration pattern experts
- Engage habitat change researchers
Validation Criteria: Multiple verified observations, photographic evidence, specimen collection, or genetic evidence required for range expansion confirmation.
Signaling Pathways for Data Quality Escalation
The decision pathway for escalating ambiguous cases follows a logical signaling structure that ensures appropriate resource allocation while maintaining scientific rigor.
Figure 2: Signaling pathway for data quality escalation, detailing the decision logic for routing ambiguous cases.
The Scientist's Toolkit: Research Reagent Solutions
Table 3: Essential Research Reagents and Computational Tools for Ambiguous Data Resolution
| Tool/Reagent | Function | Application Context | Implementation Considerations |
|---|---|---|---|
| Convolutional Neural Networks (CNNs) | Automated visual identification and confidence scoring | Initial classification of image-based submissions | Training data bias mitigation; uncertainty quantification [61] |
| Federated Learning Systems | Model training across decentralized data sources | Incorporating local knowledge without data centralization | Privacy preservation; model aggregation algorithms [61] |
| Multi-dimensional Hierarchical Evaluation System (MDHES) | Comprehensive data quality assessment across multiple dimensions | Quantitative ambiguity detection and classification | Dimension weight calibration; threshold optimization [53] |
| Fuzzy Denoising Autoencoders (FDA) | Feature extraction robust to data uncertainties | Handling incomplete or noisy submissions | Architecture optimization; noise pattern adaptation [53] |
| Semantic-enhanced Bayesian Models | Context-aware probabilistic reasoning | Resolving contradictory or context-dependent observations | Prior specification; semantic network development [53] |
| Backdoor Watermarking | Data provenance and ownership verification | Authenticating rare observations from trusted contributors | Robustness to transformations; false positive control [53] |
Effective handling of edge cases and ambiguous data submissions requires a sophisticated, multi-layered approach that combines automated systems with human expertise. The protocols and methodologies outlined herein provide a robust framework for maintaining data quality within citizen science initiatives, particularly those supporting critical research domains like drug development. By implementing these hierarchical verification systems, researchers can transform ambiguous data from a problem into an opportunity for discovery, system improvement, and contributor education. The continuous refinement of these protocols through measured feedback and algorithmic updates ensures ever-increasing capability in managing the inherent uncertainties of citizen-generated scientific data.
Application Notes: Current Landscape and Quantitative Metrics
Effective continuous quality improvement (CQI) for data verification requires an understanding of current challenges and the establishment of quantitative benchmarks. The field is evolving from static, technical metrics toward dynamic, business-contextualized "fitness-for-purpose" assessments [62].
The Contemporary Data Quality Challenge
Recent industry surveys reveal the scale of the data quality challenge facing organizations. The quantitative impact is substantial and growing [63].
Table 1: Key Quantitative Data Quality Metrics (2025 Benchmarking Data)
| Metric | 2022 Average | 2023 Average | Year-over-Year Change |
|---|---|---|---|
| Monthly Data Incidents | 59 | 67 | +13.6% |
| Average Time to Detection (for issues taking >4 hours) | 62% of respondents | 68% of respondents | +6 percentage points |
| Average Time to Resolution | Not Specified | 15 hours | +166% (from previous baseline) |
| Revenue Impacted by Data Quality Issues | 26% | 31% | +5 percentage points |
These metrics indicate that data incidents are becoming more frequent and resolving them requires significantly more resources [63]. Furthermore, business stakeholders are often the first to identify data issues 74% of the time, "all or most of the time," underscoring a failure in proactive detection by data teams [63].
The Shift to Fitness-for-Purpose
In 2025, the leading trend in data quality is the move beyond traditional dimensions (completeness, accuracy) toward a framework of fitness-for-purpose [62]. This means data quality is evaluated against specific business questions, model needs, and risk thresholds, requiring a more nuanced approach to verification [62]. Gartner's Data Quality Maturity Scale guides this evolution [62]:
- Low Quality: Basic awareness with limited enforcement.
- Medium Quality: Operational focus with dashboards and accountability.
- High Quality: Quality is embedded and integrated across all workflows, from ingestion to AI use cases [62].
Augmented Data Quality (ADQ) solutions, powered by AI and machine learning, are central to this shift, automating profiling, rule discovery, and anomaly detection [64].
Experimental Protocols for Monitoring and Refinement
This section provides detailed, actionable protocols for implementing a CQI framework within a hierarchical verification system.
Protocol: Foundational Data Quality Measurement
This protocol establishes the baseline measurement of data quality across core dimensions.
I. Research Reagent Solutions
Table 2: Essential Tools for Data Quality Measurement
| Item (Tool/Capability) | Function |
|---|---|
| Data Profiling Engine | Analyzes source data to understand structure, content, and quality; identifies anomalies, duplicates, and missing values [64] [65]. |
| Data Quality Rule Library | A set of pre-built and customizable rules for validation (e.g., format checks, range checks, uniqueness checks) [62]. |
| Automated Monitoring & Alerting System | Tracks data quality metrics in real-time and alerts users to potential issues and threshold breaches [62] [65]. |
| Data Lineage Mapper | Provides detailed, bidirectional lineage to track data origin, transformation, and issue propagation for root cause analysis [62]. |
| Active Metadata Repository | Leverages real-time, contextual metadata to recommend rules, link policies to assets, and guide remediation [62]. |
II. Methodology
- Business Understanding: Collaborate with business stakeholders (e.g., citizen science project leads) to define the intended purpose of the dataset and the critical dimensions of quality (e.g., is spatial accuracy more critical than timeliness?) [62].
- Data Profiling:
a. Execute the profiling engine against the target dataset.
b. Calculate metrics for each relevant dimension [64]:
* Completeness:
(1 - (Number of NULL fields / Total number of fields)) * 100* Uniqueness:(Count of unique records / Total records) * 100* Validity:(Number of records conforming to defined rules / Total records) * 100 - Rule Definition: Based on profiling results and business needs, define and deploy validation rules. For example, a rule could require that at least one of two identifier fields (e.g.,
taxon_idorcommon_name) must be populated (completeness), or thatobservation_datecannot be a future date (validity) [64]. - Baseline Establishment: Document the initial quality scores for each dimension to serve as a benchmark for future improvement.
Protocol: Continuous Monitoring and Anomaly Detection
This protocol outlines the process for ongoing surveillance of data health to identify issues proactively.
I. Research Reagent Solutions
- Same as Table 2, with emphasis on the Automated Monitoring & Alerting System and Active Metadata Repository.
II. Methodology
- Metric Selection: Choose key quality metrics (e.g., record count freshness, null rate for a critical column, validity score) for continuous monitoring [62].
- Threshold Configuration: Set warning and critical thresholds for each metric. These can be static (e.g.,
completeness_score < 95%) or dynamic, using machine learning to detect statistical anomalies and drift from historical patterns [64]. - Workflow Integration: Route quality alerts and failed checks into collaborative tools like Slack, Jira, or Microsoft Teams. Enrich tickets with asset context, lineage, and pre-assigned ownership [62].
- Resolution Tracking: Implement a workflow for assigning, escalating, and resolving data quality issues. Track resolution time (Time to Resolution - TTR) as a key performance indicator for the CQI process [63] [62].
Protocol: Root Cause Analysis and Systemic Correction
When a data quality incident is detected, this protocol guides the investigation and remediation.
I. Research Reagent Solutions
- Data Lineage Mapper
- Active Metadata Repository
- Embedded Collaboration Tools (e.g., comment threads, issue flagging within the data platform) [62]
II. Methodology
- Impact Assessment: Use bidirectional lineage to identify all downstream assets, reports, and models affected by the issue [62].
- Root Cause Investigation: Trace the data upstream to its source to identify the origin of the corruption. The lineage mapper is critical here. Common causes include [64]:
- Source System Changes: An unannounced schema change in a source database.
- Pipeline Logic Error: A bug in a data transformation step (e.g., a dbt model).
- Invalid Data Input: A citizen science submission that bypassed initial validation checks.
- Corrective Action: a. Short-term: Execute data cleansing and standardization procedures to correct the affected dataset [64]. b. Long-term (Prevention): Establish new validation rules at the data entry point or modify pipeline logic to prevent the issue from recurring. This aligns with the "Prevention" methodology in Gartner's improvement framework [64].
- Knowledge Documentation: Document the incident, root cause, and solution in the active metadata repository to accelerate future investigations.
Workflow Visualization
The following diagrams, generated with Graphviz DOT language, illustrate the logical relationships and workflows described in the protocols. The color palette and contrast comply with the specified guidelines.
Tools and Technologies for Efficient Data Quality Management
Within the framework of a hierarchical verification system for citizen science data, robust data quality management (DQM) is not merely beneficial—it is a foundational requirement for scientific credibility. Citizen science initiatives generate massive datasets that power critical research, from biodiversity conservation [15] to environmental monitoring. The hierarchical verification model, which progressively validates data from initial collection to final application, depends entirely on a suite of sophisticated tools and technologies to automate checks, ensure consistency, and maintain data integrity across multiple validation tiers. This document outlines the core tools, detailed application protocols, and visualization strategies essential for implementing such a system, with a specific focus on citizen science data quality research.
Data Quality Tools: A Comparative Analysis
The data quality tool landscape can be categorized by their primary function within the data pipeline. The following tables provide a structured comparison of prominent tools, highlighting their relevance to a hierarchical verification system.
Table 1: Data Observability and Monitoring Tools. These tools provide continuous, automated monitoring of data health and are crucial for the ongoing surveillance tiers of a hierarchical system.
| Tool Name | Key Capabilities | Relevance to Citizen Science & Hierarchical Verification |
|---|---|---|
| Monte Carlo [66] [67] | Automated anomaly detection on data freshness, volume, and schema; End-to-end lineage; Data downtime prevention. | Monitors data streams from citizen observatories for unexpected changes in data submission rates or schema, triggering alerts for higher-level verification. |
| Soda [68] [67] | Data quality monitoring with SodaCL (human-readable checks); Collaborative data contracts; Anomaly detection. | Allows researchers to define simple, contract-based quality checks (e.g., validity checks for species taxonomy codes) that can be applied at the point of data entry. |
| Metaplane [66] | Lightweight observability for analytics stacks; Anomaly detection in metrics, schema, and volume; dbt & Slack integration. | Ideal for monitoring the health of derived datasets and dashboards used by researchers, ensuring final outputs remain reliable. |
| SYNQ [66] | AI-native observability organized around data products; Integrates with dbt/SQLMesh; Recommends tests and fixes. | AI can learn from expert-validated records in a citizen science platform to automatically flag anomalous new submissions for review. |
Table 2: Data Testing, Validation, and Cleansing Tools. These tools are used for rule-based validation and data cleansing, forming the core of the structured verification tiers.
| Tool Name | Key Capabilities | Relevance to Citizen Science & Hierarchical Verification |
|---|---|---|
| Great Expectations (GX) [69] [66] [67] | Open-source framework for defining "expectations" (data assertions); Validation via Python/YAML; Generates data docs. | Perfect for enforcing strict data quality rules (e.g., column "latitude" must be between -90 and 90) at the transformation stage of the hierarchy. |
| dbt Tests [69] | Built-in testing within dbt workflows; Simple YAML-based definitions for nulls, uniqueness, etc. | Enables analytics engineers to embed data quality tests directly into the SQL transformations that prepare citizen science data for analysis. |
| Ataccama ONE [66] [67] | AI-powered unified platform (DQ, MDM, Governance); Automated profiling, rule discovery, and cleansing. | Useful for mastering key entities (e.g., participant, location) in large-scale citizen science projects, ensuring consistency across datasets. |
| Informatica Data Quality [66] [67] | Enterprise data profiling, standardization, matching, and cleansing; Part of broader IDMC platform. | Provides robust data cleansing and standardization for legacy or highly fragmented citizen science data before it enters the verification hierarchy. |
Table 3: Data Discovery, Governance, and Master Data Management (MDM) Tools. These tools provide the organizational framework and context, essential for the governance tier of the hierarchy.
| Tool Name | Key Capabilities | Relevance to Citizen Science & Hierarchical Verification |
|---|---|---|
| Atlan [69] [66] | Active metadata platform; Data cataloging; Column-level lineage; Embedded quality metrics. | Creates a searchable inventory of all citizen science data assets, their lineage, and quality scores, making the entire verification process transparent. |
| Collibra [66] | Enterprise data catalog & governance suite; Policy enforcement; Stewardship workflows. | Manages data stewardship roles and formal governance policies for sensitive or high-stakes citizen science data (e.g., health, protected species data). |
| DataGalaxy [68] | Data & AI governance platform; Centralized cataloging, lineage, and quality assessment. | Unifies data quality monitoring with governance, enabling a holistic view of data assets and their fitness for use in conservation plans [16]. |
| OvalEdge [67] | Unified data catalog, lineage, and quality; Automated anomaly detection; Ownership assignment. | Automatically identifies data quality issues and assigns them to defined owners, creating clear accountability within the verification workflow. |
Experimental Protocols for Tool Implementation
Protocol: Implementing a Hierarchical Data Validation Pipeline for Species Occurrence Data
This protocol details a methodology for validating citizen science species observations using a combination of Great Expectations and a conformal prediction framework, as suggested by recent research [5].
1. Research Reagent Solutions (Software Stack)
| Item | Function |
|---|---|
| Great Expectations (GX) | Core validation framework for executing rule-based data quality checks. |
| Python 3.9+ | Programming language for defining custom GX expectations and analysis logic. |
| dbt (data build tool) | Handles data transformation and model dependency management between validation stages. |
| Citizen Science Platform (e.g., iNaturalist API) [15] | Source of raw, unvalidated species occurrence records. |
| Reference Datasets (e.g., GBIF) [5] [15] | Provides authoritative taxonomic and geographic data for validation. |
2. Methodology
Step 1: Data Ingestion and Profiling
- Ingest raw occurrence records from the citizen science platform's API.
- Use GX's automated profiling to understand initial data structure, completeness, and value distributions for key fields like
species_name,latitude,longitude, andtimestamp.
Step 2: Rule-Based Validation (Tier 1)
- Construct a GX suite of expectations to serve as the first validation tier.
- Schema & Validity Checks: Expect columns to exist and for
latitude/longitudeto be within valid global ranges. - Completeness Checks: Expect critical fields (
species_name,geolocation) to be non-null. - Custom Check Example: Expect that
observed_dateis not a future date.
Step 3: Conformal Prediction for Taxonomic Validation (Tier 2)
- This step implements a semi-automated, probabilistic validation tier [5].
- Model Training: Train a deep-learning model on a curated dataset of expert-verified species identifications with associated images.
- Calibration: Calibrate the model using a separate calibration set to establish prediction intervals that guarantee a defined level of confidence (e.g., 95%).
- Validation: For new submissions, the model provides a set of plausible species predictions with confidence metrics. Records with high-confidence predictions matching the user's suggestion are auto-validated. Records with low confidence or multiple plausible species are flagged for Tier 3: Expert Review.
Step 4: Data Transformation and Integration
- Use dbt to model the validated data, creating analytical tables.
- Embed dbt tests to ensure the integrity of the final data product, such as testing for unique record IDs or referential integrity with taxonomic reference tables.
Step 5: Continuous Monitoring
- Integrate an observability tool like Soda or Monte Carlo.
- Configure monitors on the final data product to track freshness (are new records flowing in?), volume (has the submission rate dropped?), and schema (have any new fields been added?).
The following workflow diagram illustrates this hierarchical process:
Protocol: Establishing Data Contracts for Citizen Observatory Integration
This protocol outlines how to use tools like Soda and Atlan to create and manage data contracts, ensuring data from diverse citizen observatories meets quality standards before integration.
1. Methodology
Step 1: Contract Definition
- Stakeholder Alignment: Data consumers (scientists) and data producers (observatory platform managers) collaboratively define quality expectations using SodaCL.
- Example SodaCL Checks:
checks for citizen_observatory_data: freshness(timestamp) < 7dschema for species_observations: (id, species, date, lat, long)valid values for quality_grade in (casual, research, needs_id)
Step 2: Contract Publication & Discovery
- The defined data contracts are published and documented in a data catalog like Atlan.
- This makes the contracts discoverable, providing clear context for all users about the provenance and quality guarantees of the data.
Step 3: Automated Contract Validation
- Soda Core (CLI) executes the contract checks automatically within the data pipeline, for example, as part of a CI/CD process or upon data ingestion.
Step 4: Incident Management & Feedback
- When a check fails, Soda Cloud or a similar tool triggers alerts to the data producers via Slack or email.
- This creates a closed feedback loop, prompting immediate remediation and maintaining the integrity of the hierarchical system.
The following diagram visualizes this data contract workflow:
Measuring Success: Validation Frameworks and Performance Comparison
Application Note
Background and Rationale
Verification processes are critical for ensuring data quality and reliability across scientific domains, from ecological citizen science to pharmaceutical development. Traditional verification approaches, characterized by a one-size-fits-all methodology where every data point undergoes identical rigorous checking, have long been the standard. However, these methods are increasingly challenged by the era of big data, where volume and velocity outpace manual verification capabilities [4]. In ecological citizen science, for instance, expert verification—the painstaking process of having specialists manually validate individual observations—has been the default approach for longer-running schemes [4] [36]. Similarly, in analytical laboratories, method verification traditionally involves confirming that a previously validated method performs as expected under specific laboratory conditions through standardized testing [70] [71].
The emerging hierarchical verification paradigm offers a strategic alternative by implementing tiered verification levels that match scrutiny intensity to data risk and complexity. This approach allocates limited expert resources efficiently, automating routine checks while reserving expert judgment for ambiguous or high-stakes cases [4]. The core innovation lies in its adaptive workflow, which dynamically routes data through verification pathways based on initial automated assessments and predetermined risk criteria. This system is particularly valuable for citizen science, where data collection spans vast geographical and temporal scales, creating datasets of immense research value but variable quality [4]. The hierarchical model represents a fundamental shift from uniform treatment to intelligent, risk-based verification resource allocation.
Comparative Quantitative Analysis
The table below summarizes a systematic performance comparison between hierarchical and traditional verification approaches across key operational metrics, synthesizing findings from multiple domains including citizen science and laboratory analysis.
Table 1: Performance Comparison of Verification Approaches
| Performance Metric | Traditional Approach | Hierarchical Approach | Data Source/Context |
|---|---|---|---|
| Throughput Capacity | Limited by expert availability; processes 100% of records manually | High; automates ~70-80% of initial verifications, experts handle 20-30% | Citizen science schemes [4] |
| Resource Efficiency | Low; high operational costs from manual labor | High; reduces expert time by 60-70% through automation | Laboratory method verification [70] |
| Error Detection Accuracy | High for experts (varies by expertise), low for basic checks | Superior; combines algorithmic consistency with expert oversight for flagged cases | Document verification [72] |
| Scalability | Poor; requires linear increase in expert resources | Excellent; handles volume increases with minimal additional resources | Identity verification systems [73] [74] |
| Implementation Speed | Slow; manual verification creates bottlenecks (days/weeks) | Fast; automated bulk processing (seconds/minutes) with parallel expert review | Document verification workflows [72] |
| Adaptability to Complexity | Moderate; struggles with novel or ambiguous edge cases | High; specialized routing for complex cases improves outcome quality | Conformal prediction in species identification [5] |
Domain-Specific Applications
Ecological Citizen Science
In citizen science, hierarchical verification addresses a critical bottleneck: the manual expert verification that has been the default for 65% of published schemes [4] [36]. A proposed implementation uses a decision tree where submitted species observations first undergo automated validation against known geographic ranges, phenology patterns, and image recognition algorithms. Records passing these checks with high confidence scores are automatically verified, while those with discrepancies or low confidence are flagged for community consensus or expert review [4]. This system is particularly effective for platforms like iNaturalist, where computer vision provides initial suggestions, and the community of naturalists provides secondary validation for uncertain records, creating a multi-tiered verification hierarchy.
Pharmaceutical Development and Laboratory Analysis
The pharmaceutical industry employs hierarchical thinking in analytical method procedures, distinguishing between full validation, qualification, and verification based on the stage of drug development and method novelty [70] [71]. For compendial methods (established standard methods), laboratories perform verification—confirming the method works under actual conditions of use—rather than full re-validation [71]. This creates a de facto hierarchy where method risk determines verification intensity. Similarly, in drug development, early-phase trials may use qualified methods with limited validation, while late-phase trials require fully validated methods, creating a phase-appropriate verification hierarchy that aligns scrutiny with regulatory impact [71].
Identity Verification Systems
Digital identity verification exemplifies sophisticated hierarchical implementation, combining document authentication, biometric liveness detection, and behavioral analytics in layered defenses [73] [75] [74]. Low-risk verifications might proceed with document checks alone, while high-risk scenarios trigger additional biometric and behavioral verification layers. This "Journey Time Orchestration" dynamically adapts verification requirements throughout a user's digital interaction, balancing security and user experience [73]. This approach specifically addresses both traditional threats (fake IDs) and emerging AI-powered fraud (deepfakes) by applying appropriate verification technologies based on risk indicators [74].
Experimental Protocols
Protocol 1: Implementing Hierarchical Verification for Citizen Science Data
Purpose and Scope
This protocol establishes a standardized methodology for implementing a three-tier hierarchical verification system for ecological citizen science data. It is designed to maximize verification efficiency while maintaining high data quality standards by strategically deploying automated, community-based, and expert verification resources [4]. The protocol is applicable to species occurrence data collection programs where volunteers submit observations with associated metadata and media (photographs, audio).
Experimental Workflow
Table 2: Research Reagent Solutions for Citizen Science Verification
| Component | Function in Verification | Implementation Example |
|---|---|---|
| Geographic Range Data | Flags observations outside known species distribution | GBIF API or regional atlas data |
| Phenological Calendar | Identifies temporal outliers (e.g., summer species in winter) | Published phenology studies or historical data |
| Conformal Prediction Model | Provides confidence scores for species identification with calibrated uncertainty | Deep-learning models trained on verified image datasets [5] |
| Community Consensus Platform | Enables crowd-sourced validation by multiple identifiers | Online platform with voting/agreement system |
| Expert Review Portal | Facilitates efficient review of flagged records by taxonomic specialists | Curated interface with prioritization algorithms |
The following diagram illustrates the hierarchical verification workflow for citizen science data:
Figure 1: Hierarchical verification workflow for citizen science data.
Procedure
Tier 1: Automated Verification
- Geographic Plausibility Check: Programmatically compare observation coordinates against known species distribution maps from established sources (e.g., GBIF). Flag records falling outside reasonable range buffers (species-dependent).
- Phenological Consistency Check: Validate observation dates against known seasonal occurrence patterns. Flag records outside expected timeframes.
- Automated Species Identification: Process submitted images through a conformal prediction model [5] to generate species identification suggestions with confidence scores. Records with confidence scores ≥0.95 proceed to auto-verification.
Tier 2: Community Consensus Verification
- Route flagged records from Tier 1 and records with confidence scores between 0.70-0.94 to a community platform.
- Expose records to multiple experienced community validators (minimum 3).
- Apply consensus algorithm: require agreement from ≥2 validators for verification.
- Records failing to reach consensus within 14 days escalate to Tier 3.
Tier 3: Expert Verification
- Present unresolved records to taxonomic specialists through a prioritized queue.
- Experts provide definitive verification with supporting rationale.
- Use expert decisions to retrain and improve automated models.
Validation and Quality Control
Implement continuous quality assessment through:
- Blinded Re-Verification: Periodically re-route auto-verified records to experts for accuracy assessment.
- Expert Review Calibration: Conduct regular inter-expert agreement studies to ensure consistency.
- Feedback Loop: Use expert corrections to improve automated validation rules and model performance.
Protocol 2: Hierarchical Document Verification for Identity Assurance
Purpose and Scope
This protocol details a hierarchical approach for identity document verification, balancing security and user experience in digital onboarding processes. It addresses both traditional document forgery and AI-generated synthetic identities by applying appropriate verification technologies based on risk assessment [73] [72] [74]. The protocol is applicable to financial services, healthcare, and other sectors requiring reliable remote identity verification.
Experimental Workflow
Table 3: Research Reagent Solutions for Document Verification
| Component | Function in Verification | Implementation Example |
|---|---|---|
| OCR Engine | Extracts machine-readable text from document images | Cloud-based OCR service (e.g., Google Vision, AWS Textract) |
| Document Forensics AI | Analyzes security features for tampering indicators | Custom CNN trained on genuine/forged document datasets |
| Liveness Detection | Ensures presenter is physically present | 3D depth sensing, micro-movement analysis [75] |
| Biometric Matcher | Compares selfie to document photo | Facial recognition algorithms (e.g., FaceNet, ArcFace) |
| Database Validator | Cross-references extracted data against authoritative sources | Government databases, credit bureau data (with consent) |
The following diagram illustrates the hierarchical document verification workflow:
Figure 2: Hierarchical document verification workflow for identity assurance.
Procedure
Tier 1: Document Authenticity Checks
- Document Integrity Validation: Use AI-based analysis to check for digital manipulation, including pixel-level inconsistency detection and metadata analysis.
- Security Feature Verification: Validate presence and correctness of holograms, microprinting, UV features, and other document-specific security elements.
- Template Matching: Compare document layout against official templates for the claimed document type and issuing authority.
- Documents passing all checks with high confidence scores proceed to Tier 2; others route directly to Tier 3.
Tier 2: Biometric Verification
- Liveness Detection: Implement active (user prompts) or passive (algorithmic) liveness detection to prevent presentation attacks using 3D masks or video replays [73] [75].
- Facial Matching: Compare selfie photo to the portrait on the identity document using facial recognition algorithms.
- Sessions with high liveness confidence and facial similarity scores ≥0.90 receive medium-risk verification approval.
Tier 3: Enhanced Verification
- Database Cross-Reference: Validate extracted document data against authoritative sources (e.g., government databases, credit bureau data) where permitted and available.
- Expert Manual Review: Route ambiguous cases to trained verification specialists for final determination.
- Apply additional context-aware checks (device fingerprinting, behavioral analytics) for comprehensive risk assessment.
Validation and Quality Control
- Fraud Detection Testing: Regularly test system with known forgeries to evaluate detection capabilities.
- Bias Auditing: Assess demographic differentials in false rejection/acceptance rates.
- Continuous Model Retraining: Update AI models with new fraudulent patterns and document versions.
Within the framework of a hierarchical verification system for citizen science data quality research, the concept of 'ground truth' is foundational. Ground truth, or ground truth data, refers to verified, accurate data used for training, validating, and testing analytical or artificial intelligence (AI) models [76]. It represents the gold standard of accurate information against which other measurements or predictions are compared. In the context of citizen science, where data collection is distributed among contributors with varying levels of expertise, a robust ground truth provides the benchmark for assessing data quality, quantifying uncertainty, and validating scientific findings. This document outlines the principles, generation methodologies, and application protocols for establishing ground truth within a multi-layered verification system designed to ensure the reliability of crowdsourced scientific data.
Core Principles and Definitions
Ground truth data serves as the objective reference measure in a validation hierarchy. Its primary function is to enable the deterministic evaluation of system quality by providing a known, factual outcome to measure against [77]. In a hierarchical verification system for citizen science, this translates to several core principles:
- Verified Accuracy: Ground truth must be based on real-world observations and verified to a high degree of certainty, often by subject matter experts (SMEs) or through highly precise instrumentation [76].
- Deterministic Benchmark: It unlocks the ability to create custom benchmarks for tracking performance drift over time and for statistically comparing the performance of different models or data collection methods in accomplishing the same task [77].
- Hierarchical Alignment: At each level of the verification hierarchy—from initial data entry to complex model inference—the corresponding ground truth provides the definitive "correct answer" for that specific validation stage.
For question-answering applications, such as those that might be used to interpret citizen science reports, ground truth is often curated as question-answer-fact triplets. The question and answer are tailored to the ideal response in terms of content, length, and style, while the fact is a minimal representation of the ground truth answer, comprising one or more subject entities of the question [77].
Table 1: Ground Truth Data Types and Their Roles in Citizen Science Validation
| Data Type | Description | Example Citizen Science Use Case |
|---|---|---|
| Classification | Provides correct labels for each input, helping models categorize data into predefined classes [76]. | Identifying species from uploaded images (e.g., bird, insect, plant). |
| Regression | Represents actual numerical outcomes that a model seeks to predict [76]. | Predicting local air quality index based on sensor data and observations. |
| Segmentation | Defined at a pixel-level to identify boundaries or regions within an image [76]. | Delineating the area of a forest fire from satellite imagery. |
| Question-Answer-Fact Triplets | A curated set containing a question, its ideal answer, and a minimal factual representation [77]. | Training a model to answer specific queries about ecological data. |
Generation and Curation Protocols
Establishing high-quality ground truth is a critical process that combines expert human input with scalable, automated techniques. The following protocols detail the methodologies for generating and curating ground truth suitable for a large-scale citizen science initiative.
Expert-Led Curation for Foundational Datasets
An initial, high-fidelity ground truth dataset should be developed through direct involvement of subject matter experts (SMEs). This exercise, while resource-intensive, forces crucial early alignment among stakeholders.
- Objective: To create a small, high-signal dataset that defines the most important questions and expected answers for the citizen science project.
- Procedure:
- Stakeholder Workshop: Convene SMEs and project stakeholders to align on the top N critical questions the system must accurately address.
- Manual Curation: SMEs manually generate the expected question-answer-fact triplets, ensuring they represent the gold standard for content, length, and style.
- Validation and Refinement: The curated dataset is reviewed and refined through iterative consensus-building among the SMEs.
- Outcomes:
- Stakeholder alignment on key performance indicators.
- A high-fidelity starter dataset for initial proof-of-concept evaluations [77].
Scalable, LLM-Assisted Generation Pipeline
To scale beyond the manually curated dataset, a risk-based approach using Large Language Models (LLMs) can be employed, while maintaining a human-in-the-loop (HITL) for review.
- Objective: To efficiently generate large volumes of ground truth data from existing source materials (e.g., historical validated data, scientific literature).
- Workflow Architecture: A serverless batch pipeline automates the generation process. The high-level data flow and components are illustrated below.
Diagram 1: Automated Ground Truth Generation Pipeline
- Procedure:
- Input: Source data (e.g., validated historical observations, scientific abstracts) is placed in an Amazon S3 bucket.
- Chunking: A distributed map state in AWS Step Functions orchestrates Lambda functions that ingest and chunk the source data into manageable pieces, stored in an intermediate S3 bucket [77].
- LLM Prompting: A second distributed map state feeds each chunk to a carefully designed prompt run on an LLM (e.g., Anthropic's Claude on Amazon Bedrock). The prompt instructs the LLM to adopt a fact-based persona and generate question-answer-fact triplets from the chunk [77].
- Output Handling: The LLM's output is validated and stored as JSONLines files in an output S3 prefix.
- Aggregation and Sampling: A SageMaker Processing Job aggregates all JSONLines files into a single ground truth dataset. A randomly selected percentage of records (based on user input) is flagged for human review [77].
Human-in-the-Loop (HITL) Review Process
The level of human review is determined by the risk of incorrect ground truth. A HITL process is essential for verifying that critical business or scientific logic is correctly represented [77].
- Objective: To mitigate the risks of LLM-generated inaccuracies and ensure ground truth aligns with expert knowledge.
- Procedure:
- Sample Selection: A random sample of the generated ground truth is selected for review based on a pre-defined risk percentage.
- Expert Evaluation: SMEs review the sampled question-answer-fact triplets for accuracy, relevance, and alignment with project goals.
- Correction and Integration: Errors are corrected by the SMEs, and the validated ground truth is integrated back into the master dataset.
Validation and Quality Assurance Metrics
Ensuring the quality of the ground truth itself is paramount. The following metrics and methods are used to judge ground truth fidelity.
Table 2: Quality Assurance Metrics for Ground Truth Data
| Metric | Calculation/Method | Interpretation |
|---|---|---|
| Inter-Annotator Agreement (IAA) | Statistical measure of consistency between different human annotators labeling the same data [76]. | A high IAA indicates consistent and reliable labeling guidelines and processes. |
| LLM-as-a-Judge | Using a separate, potentially more powerful LLM to evaluate the quality of generated ground truth against a set of criteria. | Provides a scalable, initial quality screen before human review. |
| Human Review Score | Percentage of records in a reviewed sample that are deemed correct by SMEs. | Direct measure of accuracy; used to calculate error rates and determine if full-regeneration is needed. |
The Scientist's Toolkit: Essential Research Reagents and Solutions
The following table details key resources and their functions for establishing ground truth in a citizen science data quality context.
Table 3: Research Reagent Solutions for Ground Truth Generation and Validation
| Item / Solution | Function in Ground Truth Process |
|---|---|
| Amazon SageMaker Ground Truth | A data labeling service that facilitates the creation of high-quality training datasets through automated labeling and human review processes [76]. |
| FMEval (Amazon SageMaker Clarify) | A comprehensive evaluation suite providing standardized implementations of metrics to assess model quality and responsibility against ground truth [77]. |
| AWS Step Functions | Orchestrates serverless, scalable pipelines for the batch processing and generation of ground truth data from source documents [77]. |
| Amazon Bedrock | Provides access to foundation models (e.g., Anthropic's Claude) for generating question-answer-fact triplets via prompt-based strategies [77]. |
| Inter-Annotator Agreement (IAA) Metrics | A statistical quality assurance process to measure labeling consistency between different human annotators [76]. |
| Human-in-the-Loop (HITL) Platform | A platform or interface that allows subject matter experts to efficiently review, correct, and validate sampled ground truth data [77]. |
Experimental Protocol: End-to-End Ground Truth Establishment for Species Identification
This detailed protocol describes the process of creating and using ground truth to validate a citizen science model for bird species identification.
- Aim: To develop a benchmark for evaluating the performance of a machine learning model that classifies bird species from images submitted by citizen scientists.
- Experimental Workflow: The end-to-end process, from data preparation to model evaluation, is visualized below.
Diagram 2: Species Identification Validation Workflow
Materials:
- Curated image library with expert-validated species labels.
- Access to the ground truth generation pipeline (See Section 3.2).
- FMEval or similar evaluation suite.
- Panel of ornithology experts (SMEs).
Procedure:
- Foundational Curation: A panel of ornithologists selects 100-200 high-confidence images from a verified library, creating an initial labeled dataset covering multiple species. This defines the "correct answer" for each image.
- Schema Definition: A comprehensive labeling schema is developed, specifying how to handle ambiguities (e.g., "sparrow species," unclear images).
- Scalable Generation: For associated textual data (e.g., historical reports), the LLM-assisted pipeline is used to generate question-answer-fact triplets (e.g., Q: "What species is in this image description?" A: "[Species Name]").
- HITL Review: A random sample (e.g., 15%) of the generated data and all foundational curated data is reviewed by the ornithologists. Corrections are made, and the IAA is calculated to ensure consistency.
- Model Benchmarking: The final ground truth dataset is used with FMEval to evaluate the candidate species identification model. Metrics such as accuracy, precision, and recall are calculated against the ground truth.
- Hierarchical Validation: The ground truth serves as the top-tier reference in the verification system. Discrepancies between citizen scientist labels and model predictions are escalated and resolved against this ground truth.
Multi-Dimensional Assessment Systems for Comprehensive Quality Evaluation
Multi-dimensional assessment systems represent a paradigm shift in evaluation methodology, moving beyond single-metric approaches to provide comprehensive quality analysis. These systems employ structured frameworks that analyze subjects or data across multiple distinct yet interconnected dimensions, enabling holistic quality verification. Within citizen science data quality research, hierarchical verification systems provide structured approaches to evaluate data through multiple analytical layers, from basic data integrity to complex contextual validity. Such systems are particularly valuable for addressing the complex challenges of citizen science data, where variability in collector expertise, methodological consistency, and contextual factors necessitate sophisticated assessment protocols. The integration of both quantitative metrics and qualitative evaluation within these frameworks ensures robust quality assurance for research applications, including drug development and scientific discovery [53] [78].
The fundamental architecture of multi-dimensional assessment systems typically follows a hierarchical structure that progresses from granular dimension-level evaluation to comprehensive synthetic assessment. This approach enables both targeted identification of specific quality issues and holistic quality scoring. For citizen science data quality research, this means establishing verification protocols that can accommodate diverse data types while maintaining scientific rigor across distributed data collection environments [53] [79].
Core Dimensions for Data Quality Assessment
A robust multi-dimensional assessment system for citizen science data quality should incorporate several core dimensions that collectively address the complete data lifecycle. Based on evaluation frameworks from trustworthy AI and other scientific domains, the following dimensions have been identified as essential for comprehensive quality evaluation [53]:
Table 1: Core Dimensions for Citizen Science Data Quality Assessment
| Dimension | Definition | Quantification Method | Quality Indicator |
|---|---|---|---|
| Completeness | Absence of gaps or missing values within datasets | θ₁₁ = min(1, Ω₁₁/℧₁₁) × 100% where ℧₁₁ is benchmark feature number, Ω₁₁ is training feature number [53] | Percentage of missing values against benchmark |
| Accuracy | Degree to which data correctly represents real-world values | Agreement rate with expert validation samples; Error rate calculation against gold standard [53] | Error margin thresholds; Precision/recall metrics |
| Consistency | Absence of contradictions within datasets or across time | Logic rule violation rate; Temporal stability metrics; Cross-source discrepancy analysis [53] | Rule compliance percentage; Coefficient of variation |
| Timeliness | Data availability within required timeframes | Freshness index = (Current timestamp - Data creation timestamp) / Required latency [53] | Latency thresholds; Data expiration rates |
| Variousness | Adequate diversity and representation in data coverage | Diversity index = 1 - ∑(pᵢ)² where pᵢ is proportion of category i [53] | Sample representativeness; Coverage gaps |
| Logicality | Adherence to domain-specific rules and relationships | Logic constraint satisfaction rate; Rule-based validation scores [53] | Logical consistency percentage |
These dimensions can be quantitatively measured using specific formulas and metrics, enabling objective quality assessment. For example, completeness evaluation encompasses multiple aspects including comprehensiveness of features, fullness of feature values, and adequacy of data size, each with distinct measurement approaches [53]. The hierarchical relationship between these dimensions and the overall assessment framework follows a structured architecture as illustrated below:
Implementation Protocols for Citizen Science Data Quality Assessment
Multi-Dimensional Hierarchical Evaluation System (MDHES) Protocol
The Multi-Dimensional Hierarchical Evaluation System (MDHES) provides a structured methodology for assessing data quality in citizen science projects. This protocol employs both individual dimension scoring and comprehensive synthetic evaluation to balance specialized assessment with holistic quality judgment [53].
Table 2: MDHES Implementation Protocol Workflow
| Phase | Procedures | Techniques & Methods | Output Documentation |
|---|---|---|---|
| Dimension Establishment | 1. Identify relevant quality dimensions2. Define dimension-specific metrics3. Establish weighting schemes4. Set quality thresholds | Expert panels; Delphi technique; Literature review; Stakeholder workshops [80] | Dimension specification document; Metric definition table; Weight assignment rationale |
| Data Collection & Preparation | 1. Deploy standardized collection tools2. Implement quality control protocols3. Apply data cleaning procedures4. Document collection parameters | Electronic data capture; Validation rules; Automated quality checks; Metadata standards [81] | Quality control log; Data provenance records; Cleaning transformation documentation |
| Individual Dimension Scoring | 1. Calculate dimension-specific metrics2. Apply normalization procedures3. Generate dimension quality profiles4. Identify dimension-specific issues | Quantitative formulas; Statistical analysis; Automated scoring algorithms; Benchmark comparisons [53] | Dimension score report; Quality issue log; Strength/weakness analysis |
| Comprehensive Quality Evaluation | 1. Apply fuzzy evaluation model2. Integrate dimension scores3. Calculate composite quality indices4. Assign quality classifications | Fuzzy logic algorithms; Multi-criteria decision analysis; Hierarchical aggregation [53] | Comprehensive quality score; Quality classification; Integrated assessment report |
| Validation & Refinement | 1. Conduct expert validation2. Perform reliability testing3. Assess criterion validity4. Refine assessment parameters | Inter-rater reliability; Cross-validation; Sensitivity analysis; Parameter optimization [82] | Validation report; Reliability metrics; Refinement recommendations |
The experimental workflow for implementing this protocol follows a systematic process from dimension establishment through validation, with iterative refinement based on performance evaluation:
Hierarchical Validity Assessment Protocol for Complex Data Types
For complex data types including multimedia, spatial, and temporal data common in citizen science, the Hi3DEval protocol provides a hierarchical approach to validity assessment. This methodology combines both object-level and part-level evaluation to enable holistic assessment while supporting fine-grained quality analysis [79].
Procedure:
- Object-Level Assessment: Conduct holistic evaluation of complete data assets considering geometry, texture, and source alignment
- Part-Level Assessment: Perform localized diagnosis of quality issues within semantic regions to enhance interpretability
- Material-Subject Evaluation: Extend assessment beyond aesthetic appearance to explicit evaluation of core physical properties
- Multi-Agent Annotation: Employ multiple assessment agents to collaboratively yield scalable, consistent quality assessments
- Hybrid Representation Analysis: Leverage multiple data representations to enhance understanding of spatial and temporal consistency
Technical Specifications:
- Assessment granularity: Object-level, part-level, and material-level evaluation
- Annotation pipeline: Multi-agent, multi-modal annotation pipeline (M²AP)
- Scoring system: Hybrid 3D representation-based automated scoring
- Validation: Extensive experiments demonstrating superior alignment with human preference
This protocol is particularly valuable for citizen science projects involving image, video, or spatial data collection, where understanding structural integrity and material properties is essential for research applications [79].
The Scientist's Toolkit: Essential Research Reagents & Solutions
Table 3: Essential Research Reagents for Multi-Dimensional Assessment Systems
| Tool/Reagent | Function | Application Context | Implementation Considerations |
|---|---|---|---|
| Multidimensional Item Banks | Curated collections of assessment items measuring multiple constructs simultaneously [82] | Patient-reported outcomes; Quality of life assessment; Psychological constructs | Require careful design and calibration; Should follow between-item or within-item multidimensional structures |
| Computerized Adaptive Testing (CAT) Engines | Dynamic assessment systems that select subsequent items based on previous responses [82] | Large-scale assessment; Personalized evaluation; Efficiency-optimized testing | Multidimensional CAT requires complex statistical algorithms; Efficiency gains must be balanced with precision |
| Hierarchical Clustering Validation Tools | Statistical packages for validating multidimensional performance assessment models [83] | Model validation; Cluster analysis; Performance benchmarking | Provides methodological rigor for verifying assessment structure alignment |
| Three-Dimensional Learning Assessment Protocol (3D-LAP) | Characterization tool for assessment tasks aligning with three-dimensional learning frameworks [84] | Educational assessment; Science competency evaluation; Curriculum alignment | Evaluates integration of scientific practices, crosscutting concepts, and disciplinary core ideas |
| Multidimensional Toolkit for Assessment of Play (M-TAPS) | Structured observation system combining scan observations, focal observations, and self-report [81] | Behavioral assessment; Environmental interactions; Complex behavior coding | Flexible components can be used individually or combined; Requires reliability testing between coders |
| Fuzzy Evaluation Model Systems | Computational frameworks for handling subjectivity in multi-criteria assessment [53] | Complex quality assessment; Subjective dimension integration; Decision support | Enables dynamic balance between dimensions; Harmonizes subjective and objective criteria |
Application Notes for Citizen Science Data Quality Research
Implementation Considerations
When implementing multi-dimensional assessment systems for citizen science data quality research, several practical considerations emerge from existing implementations:
Balancing Assessment Burden and Precision: Multidimensional computerized adaptive testing (MCAT) can balance assessment burden and precision, but requires sophisticated implementation. For citizen science applications, this means developing item banks that efficiently measure multiple data quality dimensions while minimizing participant burden [82].
Integration of Mixed Methods: Combining quantitative metrics with qualitative assessment strengthens overall evaluation. The M-TAPS framework demonstrates how scan observations, focal observations, and self-report can be integrated to provide complementary assessment perspectives [81].
Hierarchical Validation Approaches: Implementing validation at multiple system levels ensures robust performance assessment. Following protocols like Hi3DEval, citizen science data quality systems should incorporate both object-level (dataset-wide) and part-level (element-specific) validation [79].
Adaptation for Drug Development Contexts
For citizen science data with applications in drug development, additional specialized assessment dimensions may be required:
- Regulatory Compliance: Adherence to FDA 21 CFR Part 11, GCP, and GDPR requirements
- Audit Trail Completeness: Comprehensive documentation of data provenance and modifications
- Cross-System Integration: Compatibility with clinical data management systems and electronic data capture platforms
- Risk-Based Monitoring: Alignment with ICH E6(R2) guidelines for risk-based quality management
These specialized dimensions would complement the core quality dimensions outlined in Section 2, creating a comprehensive assessment framework suitable for regulatory submission contexts.
Multi-dimensional assessment systems provide sophisticated frameworks for comprehensive quality evaluation in citizen science data quality research. By implementing hierarchical verification protocols that address multiple quality dimensions through both individual and integrated assessment, these systems enable robust quality assurance for distributed data collection environments. The structured protocols, experimental methodologies, and research reagents outlined in this document provide researchers with practical tools for implementing these assessment systems across diverse citizen science contexts, including demanding applications in drug development and healthcare research.
Application Notes
Hierarchical verification systems are increasingly critical for managing data quality and complexity across diverse scientific fields. These systems structure verification into multiple tiers, automating routine checks and reserving expert human oversight for the most complex cases. This approach enhances efficiency, scalability, and reliability. The following case examples from ecology and safety-critical engineering demonstrate the practical implementation and performance outcomes of such systems.
Hierarchical Data Verification in Ecological Citizen Science
In ecological citizen science, the verification of species identification records is a paramount concern for data quality. A large-scale systematic review of 259 citizen science schemes revealed that verification is a critical process for ensuring data quality and trust, enabling the use of these datasets in environmental research and policy [4]. The study found that while expert verification was the most widely used approach, particularly among longer-running schemes, many schemes are transitioning towards more scalable hierarchical methods [4].
The proposed idealized hierarchical system operates on a tiered principle: the bulk of records are first processed by automated filters or community consensus. Records that are ambiguous, flagged by the system, or belong to rare or critical species categories are then escalated to additional levels of verification by expert reviewers [4]. This structure optimizes the use of limited expert resources, accelerates the processing of straightforward records, and ensures that the most challenging identifications receive appropriate scrutiny. This is particularly vital for long-term species population time-series datasets, which play a key role in assessing anthropogenic pressures like climate change [4].
Conformal Taxonomic Validation for Species Identification
A recent innovation in hierarchical verification for citizen science is the Conformal Taxonomic Validation framework. This semi-automated approach leverages deep learning and hierarchical classification to verify species records [5]. The method uses conformal prediction, a statistical technique that provides a measure of confidence for each automated identification. This confidence score determines the subsequent verification pathway within the hierarchy.
Records with high confidence scores can be automatically validated and incorporated into the dataset with minimal human intervention. Records with low or ambiguous confidence scores are flagged and routed to human experts for definitive verification. This hybrid approach combines the speed and scalability of automation with the nuanced understanding of biological experts, creating a robust and efficient data quality pipeline [5].
Hierarchical Safety Analysis and Formal Verification in Safety-Critical Engineering
The principles of hierarchical verification extend beyond ecology into the engineering of safety-critical systems, such as Communications-Based Train Control (CBTC) systems. Here, a methodology integrating System-Theoretic Process Analysis (STPA) and Event-B formal verification has been developed [85]. This approach ensures that complex systems comply with stringent safety requirements.
The process is fundamentally hierarchical. It begins with the derivation of high-level, system-wide safety constraints from identified hazards. These system-level requirements are then decomposed into detailed, component-level safety requirements based on a hierarchical functional control structure [85]. Concurrently, the formal modeling in Event-B follows a refinement-based approach. It starts with an abstract system specification and progressively refines it into a concrete design, verifying that each refinement step preserves the safety properties established at the higher level [85]. This "middle-out" approach—simultaneous top-down requirement analysis and bottom-up modeling and verification—ensures that safety is rigorously demonstrated at every level of the system architecture, from the overall system down to atomic software and hardware elements [85].
Quantitative Performance Outcomes
The implementation of hierarchical systems has yielded measurable performance improvements across the cited case studies. The table below summarizes key quantitative outcomes and approaches.
Table 1: Performance Outcomes of Hierarchical Systems
| Case Example | Hierarchical Approach | Key Performance Outcomes |
|---|---|---|
| Ecological Citizen Science [4] | Tiered system: Automation/Community → Expert Review | • Increased data verification efficiency and scalability.• Optimized use of limited expert resources.• Enabled handling of large-volume, opportunistic datasets. |
| Conformal Taxonomic Validation [5] | Deep-learning → Confidence Scoring → Expert Routing | • Created a robust, semi-automated data quality pipeline.• Combined speed of automation with expert nuance. |
| Safety-Critical System Engineering (CBTC) [85] | STPA (Top-down) → Requirement Decomposition → Event-B (Bottom-up) Formal Verification | • Enhanced traceability of safety requirements.• Ensured correctness of requirements at each system level.• Addressed complexity in system development. |
Experimental Protocols
Protocol: Implementing a Hierarchical Verification System for Citizen Science Data
This protocol outlines the steps for establishing a hierarchical verification system for ecological citizen science data, as synthesized from current research [4] [5].
1. System Design and Tier Definition:
- Objective: Define the levels of verification and the criteria for routing records between them.
- Procedure: a. Establish a multi-tier verification structure (e.g., Tier 1: Automated/Community, Tier 2: Advanced Volunteers, Tier 3: Domain Experts). b. Define clear escalation rules. For example, records are escalated to a higher tier if they involve rare species, have low automated confidence scores, or lack community consensus.
2. Automation and Community Consensus (Tier 1):
- Objective: Filter the bulk of incoming records efficiently.
- Procedure: a. Automated Filtering: Implement algorithms (e.g., deep-learning models for image recognition) to provide an initial identification and a confidence score [5]. Records with confidence scores above a pre-defined threshold can be auto-validated. b. Community Consensus: For platforms with community features, use a voting or consensus mechanism where multiple independent identifications are required to validate a record.
3. Expert Verification (Tiers 2 & 3):
- Objective: Manually verify records that are ambiguous, critical, or flagged by the automated system.
- Procedure: a. Flagged records from Tier 1 are routed to a dedicated queue for expert review. b. Experts review the record (e.g., photograph, metadata, location) and provide a confirmed identification. c. The system's automated model can be retrained periodically using the expert-validated records to improve future accuracy.
Protocol: Hierarchical Safety Analysis and Formal Verification using STPA and Event-B
This protocol details the integrated methodology for applying hierarchical verification to safety-critical systems [85].
1. System-Level Hazard Analysis (STPA - Top-Down):
- Objective: Derive high-level safety requirements.
- Procedure: a. Based on system functional requirements, identify system-level hazards. b. Define corresponding system-level safety constraints to prevent these hazards. c. Construct a hierarchical functional control structure of the system.
2. Requirement Decomposition (STPA - Top-Down):
- Objective: Break down system-level constraints into component-level requirements.
- Procedure: a. Using the control structure, perform a detailed STPA to derive how unsafe actions could occur. b. Translate these into detailed, component-level safety requirements. c. Structure these requirements hierarchically in accordance with the system architecture.
3. Formal Modeling and Refinement (Event-B - Bottom-Up):
- Objective: Formally verify that the system design meets all safety requirements.
- Procedure: a. Abstract Model: Create an initial abstract Event-B model that captures the core system functionality and system-level safety constraints. b. Progressive Refinement: Develop a series of more concrete Event-B models. Each refinement step introduces more design detail. c. Verification: At each refinement step, use the Event-B proof obligation mechanism (or model checking) to mathematically verify that the detailed design preserves the safety constraints from the abstract model and incorporates the component-level requirements [85]. d. Establish traceability links between the STPA-derived requirements and the corresponding elements in the Event-B models.
Workflow Visualization
Hierarchical Verification Workflow
The Scientist's Toolkit: Research Reagent Solutions
Table 2: Essential Tools for Hierarchical Verification Research
| Tool / Solution | Function in Hierarchical Verification |
|---|---|
| Deep-Learning Models (CNNs) | Provides the initial, automated classification of data (e.g., species from images) and generates a confidence metric for routing within the hierarchy [5]. |
| Conformal Prediction Framework | A statistical tool that calculates the confidence level of a model's prediction, providing a rigorous basis for escalating records to human experts [5]. |
| System-Theoretic Process Analysis (STPA) | A top-down hazard analysis technique used to derive hierarchical safety requirements and constraints from a system's functional control structure [85]. |
| Event-B Formal Method | A system-level modeling language used for bottom-up, refinement-based development and the formal verification of system correctness against safety requirements [85]. |
| Community Consensus Platforms | Web-based platforms that facilitate the collection of multiple independent verifications from a community of volunteers, forming the first tier of data validation [4]. |
This document provides application notes and experimental protocols for implementing a hierarchical verification system in ecological citizen science. The framework is designed to optimize the trade-off between resource efficiency and data quality by employing a multi-tiered approach to data validation. The core principle involves routing data through different verification pathways based on initial quality assessments and complexity, ensuring robust data quality while conserving expert resources for the most challenging cases.
In citizen science, data verification is the critical process of checking submitted records for correctness, most commonly the confirmation of species identity [4]. The fundamental challenge for project coordinators is balancing the demand for high-quality, research-grade data with the finite resources—time, funding, and taxonomic expertise—available for the verification process.
Traditional reliance on expert verification, while accurate, is not scalable for projects generating large volumes of data [4]. A hierarchical verification system addresses this by creating an efficient workflow that leverages a combination of automated tools and community input before escalating difficult records to domain experts. This structured approach maximizes overall data quality and project trustworthiness without a proportional increase in resource expenditure.
Quantitative Comparison of Verification Approaches
A systematic review of 259 published citizen science schemes revealed the prevalence and application of different verification methods [4]. The following table summarizes the primary approaches.
Table 1: Primary Data Verification Methods in Ecological Citizen Science
| Verification Method | Description | Typical Use Case | Relative Resource Intensity |
|---|---|---|---|
| Expert Verification | Records are checked individually by a taxonomic expert or scheme organizer [4]. | Default for many schemes; essential for rare, sensitive, or difficult-to-identify species [4]. | High |
| Community Consensus | Records are validated through agreement among multiple community members (e.g., via voting or discussion forums) [4]. | Species with distinctive morphology; platforms with an active user community. | Medium |
| Automated Verification | Records are checked using algorithms, statistical models, or image recognition software [4]. | High-volume data streams; species with well-developed identification models. | Low (after setup) |
The review of 142 schemes for which verification information was available found that expert verification was the most widely used approach, particularly among longer-running schemes [4]. This underscores a historical reliance on expert labor, a resource that is often scarce and expensive. Community consensus and automated approaches present scalable alternatives but may require specific platform features or technological development.
Hierarchical Verification Protocol
This protocol outlines a semi-automated, hierarchical framework for taxonomic record validation, integrating concepts from current research and conformal prediction methods [4] [5].
Experimental Workflow
The following diagram illustrates the logical flow of records through the hierarchical verification system.
Detailed Experimental Methodology
Objective: To implement and validate a hierarchical system that optimizes resource efficiency while maintaining high data quality standards.
Materials & Dataset:
- Citizen Science Records: A dataset containing species occurrence records with associated metadata (e.g., images, geolocation, date, observer).
- Reference Data: A verified dataset for model training and calibration, sourced from repositories like the Global Biodiversity Information Facility (GBIF) [5].
- Computing Infrastructure: Hardware with GPU support for deep learning model training and inference.
- Software Platform: A web-based platform supporting community features (e.g., forums, voting systems) and integration with machine learning APIs.
Procedure:
Tier 1: Automated Pre-processing and Filtering
- Data Ingestion: Collect records from submission portals (web, mobile app).
- Automated Validation: Run automated checks on data fields (e.g., plausible coordinates, valid date).
- Conformal Taxonomic Prediction: Employ a deep-learning model for hierarchical species identification [5]. The model should output a prediction set for each record, calibrated to a pre-defined confidence level (e.g., 90%).
- Routing Logic:
- Records with a single species in the prediction set at high confidence are automatically verified.
- Records with an empty prediction set or multiple species in the prediction set are flagged and routed to Tier 2.
- Records identified as potential rare or sensitive species are automatically routed to Tier 3.
Tier 2: Community Consensus Verification
- Blinded Review: Flagged records are presented to a pool of experienced community volunteers without the automated prediction.
- Consensus Mechanism: Implement a voting system where a record is considered verified when a pre-defined threshold of agreement is reached (e.g., ≥80% of voters agree on the species ID).
- Escalation Protocol: Records that fail to reach consensus within a set time period, or that are flagged by the community as problematic, are escalated to Tier 3.
Tier 3: Expert Verification
- Expert Review: A domain expert (taxonomist or scheme organizer) makes a final determination on escalated records.
- Feedback Loop: The expert's decision is used to update the automated model's training data and to provide feedback to the community, creating a learning system.
Validation & Cost-Benefit Metrics:
- Data Quality: Measure the accuracy rate of verified records from each tier against a held-out expert-verified test set.
- Resource Efficiency: Track the personnel time (expert and community moderator hours) and computational cost required to verify 1000 records.
- Throughput: Measure the average time from record submission to final verification.
The Scientist's Toolkit: Research Reagent Solutions
Table 2: Essential Materials and Tools for Hierarchical Verification Systems
| Item | Function/Description | Relevance to Protocol |
|---|---|---|
| Conformal Prediction Framework | A statistical tool that produces prediction sets with guaranteed coverage, quantifying the model's uncertainty for each record [5]. | Core component of Tier 1 automation; enables reliable routing of uncertain records to higher tiers. |
| Pre-trained Deep Learning Model | A model (e.g., CNN) trained on a large, verified dataset (e.g., from GBIF) for general species identification from images [5]. | Provides the initial classification in Tier 1. Can be fine-tuned for specific taxonomic groups. |
| Community Engagement Platform | Web platform with features for record display, discussion, and blinded voting. | Essential infrastructure for implementing Tier 2 community consensus. |
| Verified Reference Dataset | A high-quality dataset of expert-verified species records, often with associated images. | Used for training and, crucially, for calibrating the conformal prediction model to ensure confidence levels are accurate [5]. |
| Data Management Pipeline | Scripted workflow (e.g., in Python/R) for handling data ingestion, pre-processing, model inference, and routing between tiers. | The "glue" that automates the flow of records through the entire hierarchical system. |
The hierarchical verification protocol provides a structured, resource-aware methodology for managing data quality in citizen science. By triaging data through automated, community, and expert tiers, the system minimizes the burden on scarce expert resources while maintaining robust overall data quality. The integration of advanced statistical methods like conformal prediction adds a layer of reliability to automated processes, ensuring that uncertainty is quantified and managed effectively. This framework offers a scalable and sustainable model for the future of data-intensive ecological monitoring.
Conclusion
Hierarchical verification systems represent a paradigm shift in managing citizen science data quality, offering a scalable, efficient, and robust framework that balances automation with expert oversight. By implementing tiered approaches that utilize automated validation for routine cases and reserve expert review for complex scenarios, biomedical researchers can harness the power of citizen-generated data while maintaining the rigorous standards required for drug development and clinical research. The future of citizen science in biomedicine depends on establishing trusted data pipelines through these sophisticated verification methods. Emerging opportunities include integrating blockchain for data provenance, developing AI-powered validation tools specific to clinical data types, and creating standardized validation protocols acceptable to regulatory bodies. As these systems mature, they will enable unprecedented scaling of data collection while ensuring the quality and reliability necessary for meaningful scientific discovery and therapeutic advancement.
References
- 1. Data verification – Knowledge and References [https://taylorandfrancis.com/knowledge/Engineering_and_technology/Computer_science/Data_verification/]
- 2. What Is Data Verification and Why Is It Important? [https://www.fanruan.com/en/glossary/big-data/data-verification]
- 3. What Is Data Verification? Ensuring Accuracy in Data ... [https://thunderbit.com/blog/what-is-data-verification]
- 4. The Verification of Ecological Citizen Science Data [https://theoryandpractice.citizenscienceassociation.org/articles/10.5334/cstp.351]
- 5. A semi-automated validation framework for citizen science ... [https://www.sciencedirect.com/science/article/pii/S1574954125002997]
- 6. Quantitative Data Quality Assurance, Analysis and Presentation [https://pmc.ncbi.nlm.nih.gov/articles/PMC12056448/]
- 7. Quantitative Data Analysis Methods & Techniques 101 [https://gradcoach.com/quantitative-data-analysis-methods/]
- 8. Major Big Data challenges and issues [https://www.future-processing.com/blog/major-big-data-challenges/]
- 9. Quality Assurance Handbook and Toolkit for Participatory ... [https://www.epa.gov/participatory-science/quality-assurance-handbook-and-toolkit-participatory-science-projects]
- 10. Data Management Trends and Challenges for 2025 [https://blog.atempo.com/en/blog/data-management-trends-and-challenges-in-2025]
- 11. Expert system [https://en.wikipedia.org/wiki/Expert_system]
- 12. Verification, Validation and Evaluation of Expert Systems ... [https://www.fhwa.dot.gov/publications/research/safety/aard/]
- 13. Using Design of Experiments in Validation [https://www.biopharminternational.com/view/using-design-experiments-validation]
- 14. Biomedical Citizen Science at the National Institutes of ... [https://theoryandpractice.citizenscienceassociation.org/articles/10.5334/cstp.543]
- 15. Research Infrastructures in Citizen Science: State of ... [https://theoryandpractice.citizenscienceassociation.org/articles/10.5334/cstp.831]
- 16. Increasing the credibility of conservation plans through ... [https://www.sciencedirect.com/science/article/pii/S0006320725005890]
- 17. Color contrast - Accessibility - MDN Web Docs - Mozilla [https://developer.mozilla.org/en-US/docs/Web/Accessibility/Guides/Understanding_WCAG/Perceivable/Color_contrast]
- 18. Understanding WCAG 2 Contrast and Color Requirements [https://webaim.org/articles/contrast/]
- 19. Text has minimum contrast[proposed] | ACT Rule | WAI [https://www.w3.org/WAI/standards-guidelines/act/rules/afw4f7/proposed/]
- 20. for Robust Models - PMC Deep Conformal Prediction [https://pmc.ncbi.nlm.nih.gov/articles/PMC7274351/]
- 21. valeman/awesome-conformal-prediction [https://github.com/valeman/awesome-conformal-prediction]
- 22. TorchCP: A Python Library for Conformal Prediction [https://arxiv.org/html/2402.12683v3]
- 23. The Ultimate Data Quality in Research Checklist [https://touchstoneresearch.com/the-ultimate-data-quality-in-research-checklist/]
- 24. Establishing Trust in Crowdsourced Data [https://arxiv.org/html/2511.03016]
- 25. graph_coloring [https://memgraph.com/docs/advanced-algorithms/available-algorithms/graph_coloring]
- 26. Discriminability of node colors in node-link diagrams and ... [https://www.sciencedirect.com/science/article/pii/S2468502X25000713]
- 27. Deep Taxonomic Networks for Unsupervised Hierarchical ... [https://arxiv.org/abs/2509.23602]
- 28. Data Reliability in a Citizen Science Protocol for Monitoring ... [https://pmc.ncbi.nlm.nih.gov/articles/PMC8467663/]
- 29. Ensuring scientific accuracy of citizen science for tropical ... [https://www.sciencedirect.com/science/article/pii/S1470160X16000455]
- 30. Citizen Science Data Verification → Term [https://prism.sustainability-directory.com/term/citizen-science-data-verification/]
- 31. Medication Reconciliation - Patient Safety and Quality - NCBI [https://www.ncbi.nlm.nih.gov/books/NBK2648/]
- 32. Implementation strategies in the context of medication ... [https://implementationsciencecomms.biomedcentral.com/articles/10.1186/s43058-021-00162-5]
- 33. Improve Data Quality With 5 Fundamentals of Clinical Data ... [https://www.advarra.com/blog/improve-data-quality-with-5-fundamentals-of-clinical-data-management/]
- 34. Data Management 101 for drug developers: A peek behind ... [https://pmc.ncbi.nlm.nih.gov/articles/PMC10499417/]
- 35. Quantitative Data Analysis: A Comprehensive Guide [https://hevodata.com/learn/quantitative-data-analysis/]
- 36. The Verification of Ecological Citizen Science Data [https://www.brc.ac.uk/biblio/verification-ecological-citizen-science-data-current-approaches-and-future-possibilities]
- 37. Improving big citizen science data: Moving beyond ... [https://pmc.ncbi.nlm.nih.gov/articles/PMC6619805/]
- 38. Implementing Data Management Workflows in Research ... [https://datascience.codata.org/articles/10.5334/dsj-2021-009]
- 39. RSpace - open source research data management [https://www.researchspace.com/]
- 40. Integrating clinical research into electronic health record ... [https://pmc.ncbi.nlm.nih.gov/articles/PMC11095974/]
- 41. Clinical Data Integration: Everything You Need to Know [https://www.medidata.com/en/life-science-resources/medidata-blog/clinical-data-integration/]
- 42. The Shift to Automated Workflows and Real-Time Data [https://mccreadiegroup.com/empowering-clinical-research-the-shift-to-automated-workflows-and-real-time-data/]
- 43. How to Build a Data Management Workflow [https://mammoth.io/blog/how-to-build-a-data-management-workflow/]
- 44. Understanding and detecting defects in healthcare ... [https://pmc.ncbi.nlm.nih.gov/articles/PMC7647275/]
- 45. Mastering Data Quality Metrics: A Comprehensive Guide to ... [https://www.arkondata.com/en/post/data-quality-metrics-a-comprehensive-guide]
- 46. The challenges and opportunities of continuous data quality ... [https://pmc.ncbi.nlm.nih.gov/articles/PMC11293638/]
- 47. Using fragmentation trees and mass spectral ... [https://pmc.ncbi.nlm.nih.gov/articles/PMC4509603/]
- 48. Citizen Science in Practice: How (not) to Fail? [https://theoryandpractice.citizenscienceassociation.org/en/articles/10.5334/cstp.769]
- 49. Laboratory protocols and methods - Research Guides [https://guides.lib.vt.edu/find/lab-methods]
- 50. Elements must meet minimum color contrast ratio thresholds [https://dequeuniversity.com/rules/axe/4.8/color-contrast]
- 51. 14 Comparing quantitative data between individuals [https://bookdown.org/pkaldunn/SRM-Textbook/BetweenQuantData.html]
- 52. Chapter 15 Experimental protocols | Lab Handbook [https://ccmorey.github.io/labHandbook/experimental-protocols.html]
- 53. A multi-dimensional hierarchical evaluation system for data ... [https://journalofbigdata.springeropen.com/articles/10.1186/s40537-024-00999-2]
- 54. Why AI Automation Will Replace 80% of Manual Tasks in ... [https://www.askui.com/blog-posts/automation-replace-manual-2025]
- 55. Leading AI-Driven Drug Discovery Platforms [https://www.sciencedirect.com/science/article/abs/pii/S0031699725075118]
- 56. AI-powered drug development: 2025 Revolution [https://lifebit.ai/blog/ai-powered-drug-development-2025-revolution/]
- 57. How to improve data quality: 8 steps and best practices [https://www.metaplane.dev/blog/how-to-improve-data-quality]
- 58. The AI report: How Work Management Has Evolved In 2025 [https://monday.com/blog/project-management/ai-report/]
- 59. How AI Is Transforming Clinical Trials | AHA [https://www.aha.org/aha-center-health-innovation-market-scan/2025-10-21-how-ai-transforming-clinical-trials]
- 60. HDP-FedCD: Data-Quality-Driven Hierarchical Federated ... [https://www.sciencedirect.com/science/article/pii/S0167739X25004340]
- 61. The Role of AI in Citizen Science Data Validation → Scenario [https://prism.sustainability-directory.com/scenario/the-role-of-ai-in-citizen-science-data-validation/]
- 62. Data Quality Solutions: Trends & Must-Have Capabilities in ... [https://atlan.com/know/data-quality-solutions/]
- 63. The Annual State Of Data Quality Survey, 2025 [https://www.montecarlodata.com/blog-data-quality-survey]
- 64. Data Quality Measurement 2025 Trends and Proven ... [https://www.bitechnology.com/data-quality-measurement-2025-trends-and-proven-improvement-methodologies/]
- 65. Best Data Quality Tools for 2025: Top 10 Choices [https://www.adverity.com/blog/data-quality-tools/]
- 66. Top 10 Data Quality Tools for Reliable Data in 2025 [https://www.synq.io/blog/top-10-data-quality-tools-for-reliable-data-in-2025]
- 67. Data Quality Tools 2025: The Complete Buyer's Guide to ... [https://www.ovaledge.com/blog/data-quality-tools/]
- 68. Top data quality tools in 2025: Options compared [https://www.datagalaxy.com/en/blog/top-data-quality-tools/]
- 69. Best data quality tools in 2025 (and how to pick the right one) [https://www.metaplane.dev/blog/best-data-quality-tools]
- 70. Method Validation vs Method Verification: Which is Better ... [https://www.labmanager.com/method-validation-vs-method-verification-which-is-better-for-use-in-laboratories-33982]
- 71. Analytical Method Quality & Pharmaceutical Development ... [https://www.rhoworld.com/analytical-method-quality-throughout-the-pharmaceutical-development-lifecycle/]
- 72. Best Practices for Document Verification: Traditional vs Digital ... [https://deepvue.ai/blog/best-practices-for-document-verification-traditional-vs-digital-approaches/]
- 73. 9 Trends That Will Define Identity Verification in 2025 [https://regulaforensics.com/blog/identity-verification-trends-2025/]
- 74. 2025 Trends in Digital ID Verification Technology [https://www.zyphe.com/resources/blog/2025-trends-in-digital-id-verification-tech]
- 75. Identity Verification Trends to Watch in 2025: The Future of ... [https://idenfo.com/identity-verification-trends-to-watch-in-2025-the-future-of-secure-onboarding/]
- 76. What Is Ground Truth in Machine Learning? [https://www.ibm.com/think/topics/ground-truth]
- 77. Ground truth generation and review best practices for ... [https://aws.amazon.com/blogs/machine-learning/ground-truth-generation-and-review-best-practices-for-evaluating-generative-ai-question-answering-with-fmeval/]
- 78. Systems of Assessments for Measuring Multidimensional ... [https://www.wested.org/blog/measuring-multidimensional-science-standards/]
- 79. Hi3DEval: Advancing 3D Generation Evaluation with ... [https://arxiv.org/html/2508.05609v1]
- 80. Continuous multidimensional assessment system of ... [https://pmc.ncbi.nlm.nih.gov/articles/PMC8982702/]
- 81. Introducing the Multidimensional Toolkit for ... [https://pmc.ncbi.nlm.nih.gov/articles/PMC12596566/]
- 82. Some recommendations for developing multidimensional ... [https://pmc.ncbi.nlm.nih.gov/articles/PMC5874279/]
- 83. Validation of multidimensional performance assessment ... [https://www.sciencedirect.com/science/article/pii/S0957417425020652]
- 84. The Three-Dimensional Learning Assessment Protocol [https://journals.plos.org/plosone/article?id=10.1371/journal.pone.0162333]
- 85. Hierarchical safety analysis and formal verification for ... [https://www.sciencedirect.com/science/article/abs/pii/S0925753524003345]