FRUITS Pipeline Guide: Transforming Pharmaceutical Side-Products into Valuable Assets
This article provides a comprehensive guide to the FRUITS (Finding Reactions Usable In Tapping Side-products) pipeline, a systematic framework designed for researchers and drug development professionals.
FRUITS Pipeline Guide: Transforming Pharmaceutical Side-Products into Valuable Assets
Abstract
This article provides a comprehensive guide to the FRUITS (Finding Reactions Usable In Tapping Side-products) pipeline, a systematic framework designed for researchers and drug development professionals. It covers the foundational principles of identifying and valorizing synthesis side-products, details the step-by-step methodological workflow for reaction discovery and application, addresses common challenges and optimization strategies, and presents validation protocols and comparative analyses against traditional waste management approaches. The goal is to equip scientists with the tools to enhance sustainability, reduce costs, and uncover novel chemical entities within existing synthetic processes.
What is the FRUITS Pipeline? Unlocking Hidden Value in Synthesis Pathways
The FRUITS (Finding Reactions Usable In Tapping Side-products) pipeline is a systematic research framework designed to transform the perception of metabolic side-products and synthesis byproducts from "waste" into valuable chemical resources. Its core philosophy is rooted in sustainable molecular valorization, positing that every output of a chemical or enzymatic reaction holds potential utility if its properties and reactivities are systematically cataloged and understood.
The pipeline's objectives are threefold:
- Systematic Identification: To develop high-throughput experimental and in silico protocols for the comprehensive characterization of reaction side-products.
- Functional Annotation: To biologically and chemically annotate these compounds for potential applications in drug discovery (e.g., as novel pharmacophores, intermediates, or probes).
- Route Validation: To establish efficient synthetic or biosynthetic pathways for accessing high-value side-products, thereby improving the atom economy and sustainability of primary synthesis campaigns.
Application Notes: Quantitative Landscape of Side-Product Discovery
Recent analyses of high-throughput screening data and reaction databases underscore the significant untapped potential within typical reaction outputs. The following tables summarize key quantitative findings that justify the FRUITS pipeline's development.
Table 1: Analysis of Side-Product Prevalence in Pharmaceutical Reaction Libraries
| Reaction Class | Average # Major Products | Average # Detectable Side-Products (Yield <5%) | % Side-Products with Unknown Bioactivity | Citation |
|---|---|---|---|---|
| Transition Metal Catalysis | 1.2 | 3.8 | 87% | ACS Cent. Sci. 2023, 9, 12 |
| Multi-Component Reactions | 1.0 | 5.1 | 92% | J. Med. Chem. 2024, 67, 3 |
| Enzymatic Biotransformations | 1.1 | 2.9 | 78% | Nat. Catal. 2023, 6, 785 |
| Solid-Phase Peptide Synthesis | 1.0 | 4.5 | 81% | Org. Process Res. Dev. 2023, 27, 8 |
Table 2: Potential Value Metrics for Annotated Side-Products
| Annotation Outcome | Estimated Probability | Potential Development Impact |
|---|---|---|
| Novel Scaffold for Library Expansion | 12% | High (New IP, Lead Series) |
| Optimizable Precursor for Existing API | 18% | Medium-High (Route Improvement) |
| Chemical Biology Probe | 9% | Medium (Target Validation) |
| No Immediate Application | 61% | Low (Archive for AI Training) |
Experimental Protocols
Protocol: FRUITS-SP1 (Side-Product Identification & Isolation)
Objective: To systematically isolate and identify minor components from a known reaction mixture.
Materials:
- Reaction mixture of interest (crude, ~100 mg scale).
- Analytical and preparative HPLC-MS systems.
- Solid-phase extraction (SPE) cartridges (C18, 500 mg).
- Solvents: LC-MS grade Water, Acetonitrile, Methanol.
- NMR solvents (deuterated Chloroform, DMSO, etc.).
Procedure:
- Crude Analysis: Analyze the crude reaction mixture via HPLC-MS (using a long, shallow gradient, e.g., 5-95% ACN over 60 min). Use UV (210 nm, 254 nm) and MS (ESI+/ESI-) detection.
- Peak Tagging: Label all peaks. The primary product(s) are designated P. All other detectable peaks are designated SP-X, where X is a sequential number.
- Scale-Up & Fractionation: Scale the reaction to 1-5 g. Perform a preliminary clean-up via SPE. Use preparative HPLC to collect fractions corresponding to each SP-X peak (threshold: >0.5 mg isolated mass).
- Structural Elucidation: Subject each isolated SP-X to:
- High-resolution mass spectrometry (HRMS) for formula assignment.
- 1D and 2D NMR (¹H, ¹³C, COSY, HSQC, HMBC) for structural determination.
- Digital Archiving: Upload characterized structures, spectral data, and chromatographic properties to a dedicated FRUITS database, tagging with the parent reaction ID.
Protocol: FRUITS-BA1 (Broad Bioactivity Profiling)
Objective: To perform initial biological annotation of isolated side-products.
Materials:
- Isolated side-products (SP-X), solubilized in DMSO (10 mM stock).
- Panel of target-based biochemical assays (e.g., kinase, protease, epigenetic).
- Phenotypic screening assay (e.g., cell viability, morphology).
- High-throughput screening automation (liquid handler, plate reader).
Procedure:
- Assay Selection: Select a minimum of 3 distinct target-based assays and 1 phenotypic assay relevant to the therapeutic area of the parent project.
- Primary Screening: Test all SP-X compounds at a single concentration (e.g., 10 µM) in duplicate against the assay panel.
- Hit Criteria: Define activity as >50% inhibition/activation in target assays or a significant phenotype change.
- Priority Triage: Active SP-X compounds are designated SP-Xa. Prioritize based on potency, novelty of structure relative to the primary product (P), and selectivity profile across the assay panel.
- Dose-Response: For priority SP-Xa compounds, perform a full dose-response curve (8-point, 3-fold dilution) to determine IC₅₀/EC₅₀ values.
Visualizations
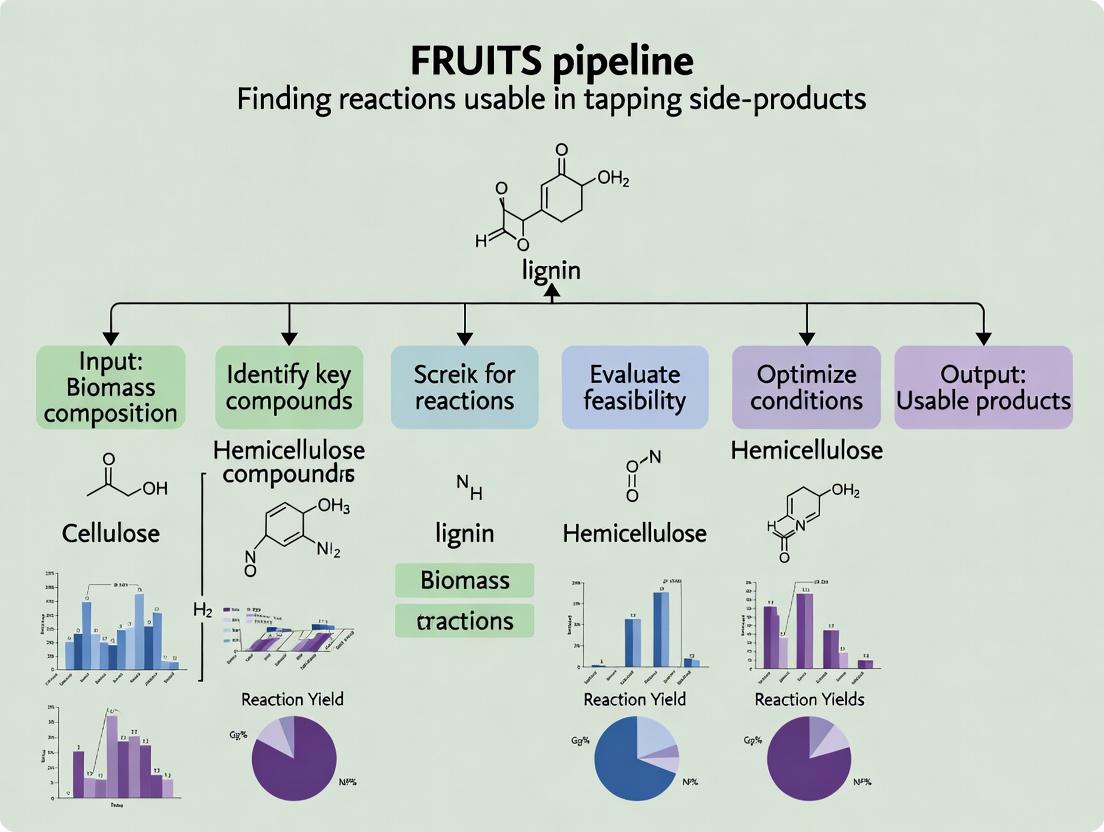
Title: The FRUITS Pipeline Core Workflow
Title: FRUITS Pipeline Philosophy and Objectives Map
The Scientist's Toolkit: FRUITS Research Reagent Solutions
| Item | Function in FRUITS Pipeline | Example Product/Catalog |
|---|---|---|
| Mixed-Mode SPE Cartridges | Broad-spectrum clean-up of crude reaction mixtures for better separation of polar/non-polar side-products. | Waters Oasis PRiME HLB, 60 mg. |
| Core-Shell HPLC Columns | High-efficiency analytical separation for detecting minor components in complex mixtures. | Phenomenex Kinetex C18, 2.6 µm, 100 x 4.6 mm. |
| Micro-scale NMR Tubes | Enables full NMR characterization with sub-milligram quantities of isolated side-products. | Norell 1.7 mm SampleXPress tubes. |
| Ready-to-Use Assay Panels | Facilitates rapid biological annotation (FRUITS-BA1) against diverse target classes. | Eurofins DiscoveryScreen MAX panel. |
| Chemical Informatics Software | Manages spectral data, structures, and bioactivity for FRUITS database creation. | ACD/Spectrus Platform, ChemAxon. |
| Automated Fraction Collector | Integrated with prep-HPLC for precise, hands-free collection of side-product peaks. | Gilson GX-271 Liquid Handler. |
The Economic and Sustainability Imperative for Side-Product Valorization
This Application Note details practical protocols and analyses within the broader FRUITS (Finding Reactions Usable In Tapping Side-products) pipeline research thesis. The FRUITS framework provides a systematic, reaction-centric approach to identify and valorize side-product streams from primary pharmaceutical and fine chemical syntheses, transforming waste into economic and sustainability assets.
Current Landscape & Quantitative Data
Table 1: Economic & Environmental Impact of Chemical Industry Side-Streams (2023-2024)
| Metric | Pharmaceutical Industry | Fine Chemicals Industry | Agri-Chemicals Industry | Source / Year |
|---|---|---|---|---|
| Average E-factor (kg waste/kg product) | 50 - 100 | 5 - 50 | 1 - 10 | ACS Sustainable Chem. Eng. 2024 Review |
| Typical Carbon Intensity of Untreated Waste | 15 - 40 kg CO2-eq/kg API | 8 - 25 kg CO2-eq/kg product | 3 - 10 kg CO2-eq/kg product | WEF Circular Chemistry Report 2023 |
| Potential Value Recovery (% of production cost) | 8 - 15% | 10 - 25% | 12 - 30% | Nature Reviews Chemistry, 2024 |
| Estimated Global Market for Valorized Streams (USD) | $12 - $18 Billion | $8 - $12 Billion | $5 - $9 Billion | MarketsandMarkets Analysis, 2024 |
Table 2: Classification of Side-Products for Valorization Potential
| Class | Description | Example Compounds | Typical Valorization Pathway |
|---|---|---|---|
| I - Directly Usable | High-purity intermediates with known utility. | Unreacted starting materials, protecting groups. | Direct recovery & reuse in same/different synthesis. |
| II - Transformable | Structurally complex molecules requiring one-step conversion. | Isomeric by-products, over-reacted intermediates. | Catalytic isomerization, selective reduction/oxidation. |
| III - Deconstructable | Polymeric or complex mixtures requiring breakdown. | Tar residues, mixed distillation tails. | Depolymerization, cracking, fermentation. |
| IV - Energetic | Low chemical value but high caloric content. | Solvent-heavy sludges, spent biomass. | Incineration with energy recovery (last resort). |
Application Notes & Protocols
AN-01: Rapid Screening for Valorizable Side-Products (FRUITS-Stage 1)
Objective: To systematically identify and prioritize side-product streams from a target synthesis for valorization potential.
Workflow:
- Stream Characterization: Perform quantitative LC-MS (Liquid Chromatography-Mass Spectrometry) and NMR (Nuclear Magnetic Resonance) on all waste streams from the target process.
- Database Mining: Cross-reference identified structures against commercial chemical databases (SciFinder, Reaxys) and the FRUITS internal "Reaction Utility Index" (RUI) to find known uses.
- Computational Reactivity Prediction: Use DFT (Density Functional Theory) calculations (e.g., Gaussian 16) to predict reactivity descriptors (Fukui indices, HOMO/LUMO gaps) for novel compounds.
- Priority Scoring: Apply the FRUITS Priority Score (FPS):
FPS = (Economic Factor x 0.4) + (Sustainability Gain x 0.3) + (Synthetic Accessibility x 0.3).
Protocol P-01: LC-MS Quantification of Process Streams
- Equipment: UHPLC system coupled to a Q-TOF mass spectrometer.
- Column: C18 reversed-phase, 2.1 x 100 mm, 1.7 µm.
- Mobile Phase: A: 0.1% Formic acid in H2O; B: 0.1% Formic acid in Acetonitrile. Gradient: 5% B to 95% B over 12 min.
- Detection: ESI+ and ESI- modes, scan range 50-1200 m/z.
- Quantification: Use external calibration curves for known impurities. For unknowns, use a semi-quantitative approach with a closest structural analog.
Protocol P-02: Computational Reactivity Screening
- Generate 3D molecular structures using ChemDraw3D or Open Babel.
- Perform geometry optimization and frequency calculation using DFT at the B3LYP/6-31G* level to confirm minima (no imaginary frequencies).
- Calculate single-point energy to derive HOMO/LUMO energies and perform population analysis (e.g., NBO) to compute Fukui indices (
f+for nucleophilic attack,f-for electrophilic attack). - Compounds with high
f+orf-values (>0.1) and moderate HOMO-LUMO gap (4-7 eV) are flagged as "high-potential" for further reaction discovery.
Diagram Title: FRUITS Stage 1 Screening Workflow
AN-02: Reaction Discovery & Catalytic Conversion (FRUITS-Stage 2)
Objective: To discover and optimize a catalytic transformation converting a high-priority side-product (Class II/III) into a valuable compound.
Case Study: Valorization of Diarylmethanol By-Product to Diarylmethane Pharmacophore.
Protocol P-03: High-Throughput Catalytic Screening
- Reaction: Catalytic deoxygenation/hydrogenation of diarylmethanol to diarylmethane.
- Setup: Use a 96-well parallel pressure reactor system (e.g., Unchained Labs Little Boy System).
- Catalyst Library (10 mol% each): Heterogeneous: Pd/C, PtO2, Ni/SiO2-Al2O3. Homogeneous: [Ru(p-cymene)Cl2]2, Rh(acac)(CO)2. Acidic: Amberlyst-15, p-TsOH.
- Conditions: 1 mmol substrate in 2 mL solvent (separate wells: MeOH, Toluene, Dioxane). 10 bar H2 (or N2 for control). Temperature gradient: 80°C, 100°C, 120°C. Stir at 1000 rpm for 6h.
- Analysis: Direct injection from each well to GC-FID for conversion and selectivity analysis.
Protocol P-04: Gram-Scale Optimization & Isolation
- Based on HTP results, scale the best condition (e.g., 1% Pd/C, Toluene, 100°C, 10 bar H2) to a 100 mmol scale in a 500 mL Parr autoclave.
- After reaction completion, cool, vent, and filter the reaction mixture through a Celite pad to remove catalyst.
- Concentrate the filtrate under reduced pressure.
- Purify the crude product by flash chromatography (silica gel, hexane/ethyl acetate gradient) to yield >95% pure diarylmethane.
- Characterize fully by 1H/13C NMR and HRMS.
Diagram Title: Catalytic Valorization Reaction Pathway
The Scientist's Toolkit: Key Research Reagent Solutions
Table 3: Essential Materials for Side-Product Valorization Research
| Item / Reagent | Function in FRUITS Pipeline | Example Supplier / Product Code |
|---|---|---|
| Q-TOF Mass Spectrometer | High-resolution identification and quantification of unknown compounds in complex waste streams. | Agilent 6546 LC/Q-TOF, Waters Xevo G3 QTof. |
| Parallel Pressure Reactor System | Enables high-throughput screening of catalytic conditions for valorization reactions. | Unchained Labs "Little Boy", HEL "Phoenix". |
| Heterogeneous Catalyst Kit | Library of common hydrogenation, oxidation, and acid catalysts for initial screening. | Sigma-Aldrich "Catalysts for Organic Synthesis" Kit. |
| DFT Software License | Computational modeling for predicting reactivity and stability of side-products. | Gaussian 16, ORCA. |
| Chemical Database Access | Critical for identifying known uses and markets for discovered compounds. | SciFinder-n, Reaxys. |
| Immobilized Enzymes Kit | For exploring biocatalytic valorization pathways under mild conditions. | Codexis "ScreenIT" Kit, Sigma "Enzyme Immobilization Kit". |
| Simulated Moving Bed (SMB) Chromatography System | For continuous, large-scale separation of valorizable compounds from streams. | Knauer "PrepChrom Lab-40 SMB". |
The protocols outlined here form the core experimental backbone of the FRUITS thesis. By applying systematic screening (Stage 1) followed by catalytic reaction discovery and optimization (Stage 2), researchers can methodically convert economic and environmental liabilities (side-products) into valuable resources. This approach directly addresses the dual imperative of improving process economics while advancing the principles of green and circular chemistry in the pharmaceutical and fine chemical industries.
Application Notes
Within the thesis context of the FRUITS (Finding Reactions Usable In Tapping Side-products) pipeline, the systematic identification and characterization of chemical entities—from known impurities to novel side-products—is foundational. The FRUITS framework posits that deliberate exploration of synthetic side-reactions can yield valuable new chemical matter for drug development. This necessitates a tiered analytical strategy, progressing from rigorous impurity profiling in known Active Pharmaceutical Ingredients (APIs) to the de novo structural elucidation of previously unreported entities.
The core hypothesis is that modern analytical techniques, when applied sequentially, can transform impurity analysis from a compliance-based activity into a discovery engine. The following application notes detail this progression.
1. Advanced Impurity Profiling for Reaction Pathway Elucidation Impurity profiling under ICH Q3A/B guidelines is the entry point. In FRUITS, profiling data (e.g., HPLC-MS) from multiple synthetic batches are not merely checked against specifications but are mined for patterns. Correlating impurity levels with specific reaction parameters (catalyst, temperature, solvent) helps infer the side-reactions that generated them. This reverse-engineering of the synthetic impurity tree is the first step in "tapping" side-products.
2. From Known Impurity to Novel Entity Identification When profiling uncovers an unknown impurity exceeding identification thresholds, or when reaction conditions are deliberately perturbed in FRUITS experiments, the focus shifts to novel entity identification. This requires orthogonal analytical techniques. High-Resolution Mass Spectrometry (HRMS) provides exact mass and elemental composition. Multi-dimensional NMR (e.g., 1H-13C HSQC, HMBC) is indispensable for structural elucidation. The identified novel structure is then cataloged within the FRUITS database as a candidate for further biological evaluation.
3. Integrating Analytical Data with Computational Prediction The FRUITS pipeline integrates analytical findings with in-silico tools. Identified novel entities are used to validate and refine computational reaction prediction models. Conversely, predicted plausible side-products from these models guide targeted searches in complex analytical data (e.g., using extracted ion chromatograms for predicted m/z), creating a closed-loop learning system.
Experimental Protocols
Protocol 1: Comprehensive Impurity Profiling via LC-HRMS
Objective: To separate, detect, and preliminarily characterize all impurities and side-products in a synthetic API batch at levels ≥ 0.05%.
Materials:
- API test sample
- Reference standard of API
- HPLC-grade solvents (acetonitrile, water, with modifiers like formic acid)
- UPLC/HPLC system coupled to a Q-TOF or Orbitrap mass spectrometer
- C18 reversed-phase column (e.g., 2.1 x 100 mm, 1.7-1.8 μm)
Methodology:
- Sample Prep: Dissolve API sample at ~1 mg/mL in a suitable solvent (e.g., methanol:water 50:50).
- Chromatography:
- Mobile Phase A: 0.1% Formic acid in water.
- Mobile Phase B: 0.1% Formic acid in acetonitrile.
- Gradient: 5% B to 95% B over 25 minutes. Hold for 3 min. Re-equilibrate.
- Flow Rate: 0.4 mL/min. Column Temp: 40°C.
- MS Detection:
- Ionization: Electrospray Ionization (ESI), positive and negative modes.
- Mass Range: 100-1200 m/z.
- Resolution: >30,000 FWHM.
- Data Acquisition: Full scan MS and data-dependent MS/MS (top 5 precursors).
- Data Analysis:
- Use software to align chromatograms of stressed/processed samples with controls.
- Generate an impurity list with RRT, accurate mass, and MS/MS fragments.
- Compare empirical formulas and fragments to a database of predicted side-products from the FRUITS reaction library.
Protocol 2: Isolation and NMR-Based Structural Elucidation of a Novel Entity
Objective: To isolate a major unknown impurity/novel entity for definitive structural characterization.
Materials:
- Bulk API solution containing the target unknown (enriched via stressed conditions).
- Preparative HPLC system with fraction collector
- Preparative C18 column
- NMR-grade deuterated solvents (DMSO-d6, CDCl3)
- High-field NMR spectrometer (≥ 400 MHz) with cryoprobe
Methodology:
- Preparative Isolation:
- Scale up the analytical HPLC method to a preparative column.
- Inject multiple runs, collecting the fraction corresponding to the RT of the unknown.
- Pool fractions, lyophilize, and weigh to obtain a pure solid (target: >1 mg).
- HRMS Confirmation: Analyze the isolated compound to confirm purity and exact mass.
- NMR Experiment Suite:
- 1H NMR: Standard one-dimensional spectrum for proton count and environment.
- 13C NMR (DEPT-135): For carbon count and identifying CH3, CH2, CH, and quaternary carbons.
- 2D NMR:
- COSY: Identifies proton-proton coupling networks.
- HSQC: Correlates directly bonded 1H and 13C nuclei.
- HMBC: Identifies long-range 1H-13C couplings (2-4 bonds), crucial for assembling molecular fragments.
- Structure Assembly:
- Integrate all spectral data. Use HMBC correlations to "connect" structural fragments established by HSQC and COSY.
- Verify the proposed structure by checking consistency of all data and comparing predicted vs. observed chemical shifts.
Data Presentation
Table 1: Analytical Techniques for Tiered Characterization in the FRUITS Pipeline
| Tier | Technique | Key Parameter | Typical FRUITS Application | Data Output |
|---|---|---|---|---|
| Tier 1: Screening | UPLC-UV/PDA | Retention Time, UV Spectrum | Initial impurity profiling, quantification | Impurity list with RRT and % area |
| Tier 2: Profiling | LC-MS (Q-TOF) | Accurate Mass, Isotopic Pattern | Elemental composition, preliminary ID | Empirical formula, MS/MS fragment ions |
| Tier 3: Identification | NMR (1D, 2D) | Chemical Shift, J-coupling | Definitive structural elucidation | Molecular connectivity, stereochemistry |
| Tier 4: Validation | LC-MS/MS (QqQ) | Multiple Reaction Monitoring (MRM) | Targeted quantitation of a confirmed novel entity | Precise concentration in reaction mixtures |
Table 2: Example Data from FRUITS-Driven Novel Entity Identification
| Entity | Source Reaction | Observed [M+H]+ (Da) | Theoretical [M+H]+ (Da) | Error (ppm) | Proposed Structure | Key 2D NMR Correlation (HMBC) |
|---|---|---|---|---|---|---|
| API (Main Product) | Buchwald-Hartwig Amination | 389.1862 | 389.1864 | -0.5 | Known | -- |
| Impurity A (Known) | Starting Material | 245.0921 | 245.0922 | -0.4 | Known SM | -- |
| Novel Entity FR-2023-01 | Predicted Pd-catalyzed C-O coupling | 405.1811 | 405.1810 | +0.2 | Phenolic ether derivative | H-8 to C-12 (J=3 bonds) |
Visualizations
Title: FRUITS Pipeline Analytical Workflow
Title: Tiered Analytical Identification Pathway
The Scientist's Toolkit: Research Reagent Solutions
| Item | Function in FRUITS Context |
|---|---|
| High-Resolution Mass Spectrometer (e.g., Q-TOF, Orbitrap) | Provides exact mass measurement for elemental composition determination of unknown impurities, essential for distinguishing isobaric compounds and formulating structural hypotheses. |
| Cryoprobe-Enhanced NMR Spectrometer | Dramatically increases sensitivity for 1D/2D NMR experiments, enabling full structural elucidation of novel entities isolated in sub-milligram quantities from complex reaction mixtures. |
| UPLC/HPLC System with PDA Detector | Delivers high-resolution chromatographic separation of complex reaction mixtures, allowing for the detection and relative quantification of all major and minor components. |
| Deuterated NMR Solvents (DMSO-d6, CDCl3, etc.) | Required for NMR spectroscopy. Different solvents are used based on compound solubility and for resolving specific chemical shift ranges or exchanging protons. |
| Predictive Chemistry Software (e.g., for retrosynthesis) | Used within the FRUITS framework to predict plausible side-reactions based on the main reaction conditions, generating a list of potential novel entities to target analytically. |
| Solid Phase Extraction (SPE) Cartridges | Used for rapid cleanup and concentration of reaction mixtures prior to analysis or preparative isolation, removing salts and solvents that interfere with chromatography/MS. |
Historical Precedents and Success Stories in Pharmaceutical Side-Product Utilization
Application Notes
The strategic repurposing of pharmaceutical side-products and synthetic intermediates is a cornerstone of sustainable and economical drug development. The FRUITS (Finding Reactions Usable in Tapping Side-products) pipeline operationalizes this philosophy by creating a systematic, data-driven framework to identify and exploit these often-overlooked chemical assets. The following application notes detail historical successes that validate the FRUITS approach, demonstrating how deliberate investigation of side-products can yield commercially successful drugs, novel therapeutics, and optimized synthetic pathways.
Note 1: Sildenafil Citrate (Viagra) from a Cardiovascular Intermediate
The development of Sildenafil is the seminal case study in side-product utilization. Initially investigated by Pfizer as a potential angina treatment (UK-92480), its primary mechanism was the inhibition of phosphodiesterase type 5 (PDE5). Clinical trials showed poor efficacy for angina but revealed a pronounced side effect—penile erection. This "side product" of its pharmacological profile was rapidly recognized as a therapeutic opportunity for erectile dysfunction. The FRUITS pipeline formalizes this serendipity by mandating the comprehensive biological profiling of all synthesized compounds and their major metabolites against a broad panel of pharmacological targets, ensuring such "failures" are captured systematically.
Note 2: Thalidomide and Its Immunomodulatory Derivatives (Lenalidomide/Pomalidomide)
Thalidomide's tragic history as a teratogen is well-known. However, investigation of its side-effect profile revealed potent immunomodulatory and anti-angiogenic properties. This led to its controlled reintroduction for leprosy and multiple myeloma. Crucially, rational modification of the thalidomide structure—itself a process akin to "tapping" a problematic parent compound—yielded lenalidomide and pomalidomide. These analogs are more potent and have improved safety profiles, demonstrating how a deep understanding of a side-product's activity can drive targeted derivative synthesis, a core module of the FRUITS pipeline.
Note 3: Tamoxifen Metabolites (Endoxifen)
Tamoxifen, a breast cancer therapy, is a prodrug metabolized by cytochrome P450 enzymes into active compounds. 4-Hydroxytamoxifen and, more potently, endoxifen are the primary therapeutic agents. The discovery of endoxifen's superior efficacy transformed the understanding of tamoxifen's mechanism. This underscores the FRUITS principle of profiling not just synthetic side-products but also in vivo metabolic products. Pipeline protocols now include mandatory high-throughput metabolic fate mapping and activity screening of major human metabolites for all lead candidates.
Note 4: Statin Side-Chain as a Valuable Synthetic Building Block
During the synthesis of early statin molecules, a complex hydroxy-lactone side-chain intermediate was produced. This chiral intermediate was later identified as a versatile building block for synthesizing other statin drugs (e.g., atorvastatin, rosuvastatin). This represents a pure chemistry-focused success of side-stream utilization. The FRUITS pipeline incorporates retro-synthetic analysis of all process intermediates to identify such high-value, chiral building blocks for internal use or external licensing.
Table 1: Key Historical Examples of Side-Product Utilization
| Parent Project / Drug | Side-Product / Intermediate | Resulting Drug / Application | Time from Discovery to New Indication Approval (Years) | Peak Annual Sales (USD, Estimate) |
|---|---|---|---|---|
| Sildenafil (Angina R&D) | PDE5 inhibition side effect | Sildenafil (Viagra) for ED | ~5 | >$2 Billion |
| Thalidomide | Immunomodulatory activity | Lenalidomide (Revlimid) | ~40 (from withdrawal to new approval) | >$12 Billion |
| Tamoxifen | Metabolic product (Endoxifen) | (Guideline for therapeutic monitoring) | ~20 (from approval to metabolite recognition) | N/A (Standard of Care) |
| Early Statin Synthesis | Chiral hydroxy-lactone intermediate | Building block for other statins | ~10 | N/A (Cost-saving in manufacturing) |
Table 2: FRUITS Pipeline Screening Output for a Hypothetical Lead Compound
| Screening Module | Number of Compounds Screened | Hits Identified | Hit Rate (%) | Primary Assay |
|---|---|---|---|---|
| Synthetic Intermediates | 15 | 2 | 13.3 | Broad-Panel Kinase Inhibition |
| In Vitro Metabolites | 8 | 1 | 12.5 | GPCR Profiling |
| Degradation Products | 5 | 0 | 0 | Cytotoxicity / Antiproliferative |
| Total Screened | 28 | 3 | 10.7 | Aggregate |
Experimental Protocols
Protocol 1: FRUITS-Compliant Broad-Panel Pharmacological Profiling of Synthesis Intermediates
Objective: To identify off-target biological activities of synthetic intermediates and side-products that may indicate new therapeutic applications. Materials:
- Test compounds (intermediates, purified side-products)
- Radioligand binding or enzyme activity assay kits for a 50-target panel (covering GPCRs, kinases, ion channels, nuclear receptors)
- Microplate reader (fluorescence, luminescence, or TR-FRET capable)
- Liquid handling robot
- DMSO (cell culture grade)
Procedure:
- Sample Preparation: Dissolve each test compound in DMSO to create a 10 mM stock solution. Perform a serial dilution in assay buffer to create a 10-point concentration series (typically from 10 µM to 0.1 nM).
- Assay Plate Setup: Using automated liquid handling, transfer 5 µL of each compound dilution to the assay plate in triplicate. Include vehicle (DMSO) control wells and reference inhibitor/agonist control wells.
- Reagent Addition: Add 20 µL of the assay buffer containing the target protein (receptor, enzyme) and the appropriate tracer (radioligand, fluorescent substrate) according to the manufacturer's protocol.
- Incubation: Incubate plate for the prescribed time (e.g., 60 min at RT) to reach binding/activity equilibrium.
- Detection: For filtration-based binding assays, separate bound from free ligand. For fluorescence-based assays, add detection reagents. Measure signal per kit specifications.
- Data Analysis: Calculate % inhibition or % control activity for each well. Generate dose-response curves and calculate IC50/Ki values for any compound showing >50% modulation at 10 µM.
Protocol 2: Metabolic Fate Mapping and Activity Screening (Metabolite Harvesting)
Objective: To generate and biologically profile major human metabolites of a lead compound. Materials:
- Lead compound
- Cryopreserved human hepatocytes
- Hepatocyte incubation medium (Williams' E medium with supplements)
- LC-MS/MS system with high-resolution mass spectrometry
- 96-well deep-well plates
- Solid-phase extraction (SPE) plates
Procedure:
- Incubation: Thaw human hepatocytes and suspend in incubation medium at 1 million viable cells/mL. Add lead compound at 10 µM final concentration. Incplicate at 37°C, 5% CO2 in a humidified incubator for 2-4 hours. Include a no-cell control.
- Reaction Termination: At time points (0.5, 1, 2, 4h), quench reactions by adding 2 volumes of ice-cold acetonitrile. Centrifuge at 3000xg for 15 min to pellet proteins and cells.
- Metabolite Identification: Transfer supernatant for LC-HRMS analysis. Use software to identify major metabolite peaks based on mass shifts (e.g., +16 for oxidation, -14 for demethylation).
- Metabolite Isolation (Scale-Up): Scale up the incubation 10-fold. Pool time-point supernatants. Use semi-preparative HPLC to isolate sufficient quantities (µg-mg) of the top 3-5 most abundant metabolites. Lyophilize.
- Activity Screening: Reconstitute isolated metabolites in DMSO. Subject them to the Broad-Panel Pharmacological Profiling Protocol (Protocol 1).
Diagrams
Title: FRUITS Pipeline for Pharmaceutical Side-Product Utilization
Title: Sildenafil Repurposing Pathway from Side-Effect Observation
The Scientist's Toolkit: Key Research Reagent Solutions
Table 3: Essential Materials for FRUITS Pipeline Implementation
| Reagent / Material | Supplier Examples | Function in FRUITS Context |
|---|---|---|
| Broad-Panel Pharmacological Assays | Eurofins, PerkinElmer | Pre-configured assays for high-throughput screening of compounds against hundreds of therapeutic targets to identify serendipitous activities. |
| Cryopreserved Human Hepatocytes | BioIVT, Lonza | For in vitro generation of human-relevant metabolites of lead compounds for subsequent isolation and screening. |
| Semi-Preparative HPLC System | Agilent, Waters | Critical for isolating milligram quantities of pure synthetic side-products or metabolites for structural elucidation and biological testing. |
| High-Resolution LC-MS/MS | Thermo Fisher, Sciex | For accurate identification and quantification of synthesis impurities, degradation products, and metabolites. |
| Chemical Informatics Software | Schrödinger, ChemAxon | To manage chemical libraries of side-products, perform virtual screening, and analyze structure-activity relationships (SAR). |
| Automated Liquid Handling Workstation | Hamilton, Beckman | Enables reproducible, high-throughput setup of biological screening assays across multiple compound plates and assay types. |
Application Notes: Integration into the FRUITS Pipeline
Within the FRUITS (Finding Reactions Usable in Tapping Side-products) pipeline for drug development, the identification and valorization of synthetic byproducts require advanced analytical and informatic tools. The following applications are critical:
- High-Resolution Mass Spectrometry (HR-MS) for Side-Product Identification: Modern HR-MS platforms, coupled with liquid chromatography (LC), enable the precise determination of elemental composition for unknown side-products. This is the first critical step in the FRUITS pipeline to catalog potential "fruits" from a reaction.
- AI-Predictive Analytics for Reaction Outcome Modeling: Machine learning models trained on large-scale reaction databases (e.g., USPTO, Reaxys) can predict the likelihood of specific side-product formation under given conditions. This informs the design of reactions to intentionally maximize valuable byproducts.
- Informatics Platforms for Structural Elucidation & Database Integration: Software solutions for NMR/MS data analysis, when integrated with chemical databases (PubChem, ChEMBL), accelerate the dereplication and novel structure confirmation of side-products, linking them to potential bioactivity data.
- Process Analytical Technology (PAT) for Real-Time Monitoring: In-line spectroscopic probes (e.g., FTIR, Raman) provide real-time kinetic data on side-product formation during synthesis, enabling dynamic control to optimize yield.
Key Experimental Protocols
Protocol 1: LC-HRMS/MS Workflow for Non-Targeted Identification of Synthetic Byproducts
Objective: To separate, detect, and obtain structural information on all major and minor components in a crude reaction mixture.
Materials:
- Crude reaction mixture
- HPLC-grade solvents (MeCN, H₂O with 0.1% formic acid)
- UHPLC system coupled to a Q-TOF or Orbitrap mass spectrometer
- C18 reverse-phase column (e.g., 2.1 x 100 mm, 1.7 µm)
- Data processing software (e.g., Compound Discoverer, MZmine)
Method:
- Sample Preparation: Dilute 10 µL of crude mixture in 1 mL of MeCN. Centrifuge at 14,000 rpm for 5 min to pellet particulates.
- Chromatographic Separation: Inject 5 µL onto the column. Employ a gradient from 5% to 95% MeCN over 15 min at a flow rate of 0.4 mL/min.
- Mass Spectrometric Analysis:
- Operate in both positive and negative electrospray ionization (ESI) modes.
- Full MS scan range: m/z 100-1500 at a resolution of ≥70,000.
- Data-Dependent MS/MS (dd-MS²): Fragment the top 10 most intense ions per cycle using stepped collision energies (20, 40, 60 eV).
- Data Processing:
- Use software to perform peak picking, alignment, and component detection.
- Formula prediction for molecular ions (mass error < 3 ppm).
- Query fragment spectra against in-silico fragmentation libraries (e.g., CFM-ID, MetFrag) and public MS/MS libraries (GNPS, mzCloud).
Protocol 2: In-line Raman Spectroscopy for Real-Time Monitoring of Side-Product Formation
Objective: To monitor the kinetic profile of a specific side-product bond formation (e.g., C-S bond) during a reaction process.
Materials:
- Reactor equipped with an immersion Raman probe (e.g., 785 nm laser)
- Raman spectrometer with CCD detector
- Chemometric software for multivariate analysis
Method:
- Method Development: Acquire Raman spectra of the starting material, target product, and purified side-product. Identify a unique vibrational band (e.g., 510 cm⁻¹ for S-S stretch) characteristic of the side-product.
- Calibration Model: Prepare a series of standard mixtures with known concentrations of the side-product. Collect spectra and use Partial Least Squares (PLS) regression to build a model correlating band intensity to concentration.
- Real-Time Monitoring: Immerse the sterilized probe directly into the reaction vessel. Initiate reaction and start continuous spectral acquisition (e.g., one scan every 30 sec).
- Data Analysis: In real-time, the chemometric model converts spectral data into a concentration profile. Use this trend to trigger process adjustments (e.g., temperature change) to maximize side-product yield at a desired endpoint.
Data Presentation
Table 1: Comparison of Analytical Techniques for Side-Product Characterization in FRUITS
| Technique | Key Metric | Typical Throughput | Information Gained | Limitations |
|---|---|---|---|---|
| LC-HRMS/MS | Mass Accuracy (<3 ppm) | 10-30 samples/day | Molecular formula, structural fragments | Requires separation, reference libraries |
| NMR Spectroscopy | Chemical Shift (ppm) | 1-5 samples/day | Definitive structure, stereochemistry | Low sensitivity, slow, requires purification |
| In-line Raman (PAT) | Spectral Resolution (~2 cm⁻¹) | Continuous real-time | Kinetic profile, relative concentration | Needs calibration, matrix interference possible |
| AI Prediction (Retrosynthesis) | Top-3 Prediction Accuracy (~85%) | 1000s reactions/sec | Likely side-products, suggested pathways | Model dependent on training data quality |
The Scientist's Toolkit: Research Reagent Solutions
Table 2: Essential Materials for FRUITS Pipeline Analytics
| Item | Function/Application | Example Vendor/Product |
|---|---|---|
| HILIC Chromatography Column | Separation of polar, early-eluting side-products not retained on C18. | Waters ACQUITY UPLC BEH Amide |
| Isotopic Labeling Reagents (¹³C, ²H) | Tracer studies to elucidate side-product formation mechanisms. | Cambridge Isotope Laboratories |
| Chemical Reaction Database Access | For training AI models and literature-based side-product prediction. | Reaxys, SciFinder-n |
| In-silico Fragmentation Software | Predicts MS/MS spectra for novel compounds lacking library matches. | CFM-ID, Sirius |
| Process Control Software Suite | Integrates PAT data (Raman/FTIR) for automated feedback control. | Siemens SIPAT, Synthia |
Visualizations
Workflow for Side-Product ID in FRUITS Pipeline
Real-Time Monitoring & Control with PAT
Implementing FRUITS: A Step-by-Step Workflow for Reaction Discovery
The FRUITS (Finding Reactions Usable In Tapping Side-products) research pipeline aims to systematically identify, catalog, and exploit synthetic by-products as novel chemical entities for drug discovery. Phase 1 establishes the critical foundation by creating a comprehensive, characterized inventory of all side-products generated under varied reaction conditions. This rigorous analytical characterization using Liquid Chromatography-Mass Spectrometry (LC-MS) and Nuclear Magnetic Resonance (NMR) spectroscopy provides the structural and quantitative data essential for downstream phases, which focus on reactivity mapping and biological screening.
Key Analytical Methodologies: Protocols & Application Notes
Liquid Chromatography-Mass Spectrometry (LC-MS) Protocol
Objective: To separate, detect, and provide preliminary identification (exact mass, fragmentation pattern) of all components within a crude reaction mixture.
Detailed Protocol:
- Sample Preparation: Precisely weigh 1.0 mg of the crude reaction mixture. Dissolve in 1.0 mL of a suitable LC-MS grade solvent (e.g., methanol, acetonitrile). Vortex for 30 seconds and centrifuge at 14,000 rpm for 5 minutes to pellet insoluble particulates. Filter the supernatant through a 0.22 µm PTFE membrane filter into an LC-MS vial.
- LC Conditions (Example for a C18 Column):
- Column: C18 reverse-phase column (e.g., 2.1 x 100 mm, 1.7 µm particle size).
- Mobile Phase A: Water with 0.1% formic acid.
- Mobile Phase B: Acetonitrile with 0.1% formic acid.
- Gradient: 5% B to 95% B over 15 minutes, hold at 95% B for 2 minutes, re-equilibrate at 5% B for 3 minutes.
- Flow Rate: 0.3 mL/min.
- Column Oven: 40°C.
- Injection Volume: 2 µL.
- MS Conditions (High-Resolution Q-TOF):
- Ionization Mode: Electrospray Ionization (ESI), positive and negative modes acquired separately.
- Mass Range: 50-1200 m/z.
- Source Temperature: 150°C.
- Desolvation Temperature: 500°C.
- Capillary Voltage: 3.0 kV (positive), 2.5 kV (negative).
- Collision Energy: Ramped from 10 eV to 40 eV for MS/MS data acquisition using data-dependent analysis (DDA).
Nuclear Magnetic Resonance (NMR) Spectroscopy Protocol
Objective: To unambiguously elucidate the chemical structure, connectivity, and stereochemistry of isolated side-products.
Detailed Protocol for 1D and 2D Experiments:
- Sample Preparation for Isolated Compounds: Isolate target side-product via preparative HPLC or flash chromatography. Dry completely under high vacuum. Weigh 2-5 mg of the pure compound into a clean NMR tube. Dissolve in 0.6 mL of deuterated solvent (e.g., CDCl3, DMSO-d6, MeOD). Ensure the solution is homogeneous.
- Data Acquisition:
- ¹H NMR: Acquire spectrum at 400 MHz (or higher). Set spectral width to 20 ppm, relaxation delay (d1) to 1 second, and number of scans (ns) to 16.
- ¹³C NMR: Acquire using proton-decoupled mode. Set spectral width to 240 ppm, d1 to 2 seconds, and ns to 1024 or more for sufficient signal-to-noise.
- 2D Experiments: Perform key correlation experiments:
- COSY: Identifies ¹H-¹H coupling networks.
- HSQC: Identifies direct ¹H-¹³C one-bond correlations.
- HMBC: Identifies long-range ¹H-¹³C correlations (2-3 bonds).
- NOESY/ROESY: Provides spatial proximity information for stereochemical assignment.
- Data Processing: Apply Fourier transformation, phase correction, and baseline correction. Reference chemical shifts to residual solvent peaks.
Data Presentation & Comparative Analysis
Table 1: Representative LC-MS Data from FRUITS Pilot Study (Model Reaction: Suzuki-Miyaura Coupling)
| Side-Product ID | Retention Time (min) | [M+H]+ (m/z) Observed | [M+H]+ (m/z) Calculated | Mass Error (ppm) | Proposed Molecular Formula | Relative Abundance (%)* |
|---|---|---|---|---|---|---|
| SP-A1 | 4.32 | 285.1594 | 285.1598 | -1.4 | C18H20O3 | 2.1 |
| SP-A2 | 6.78 | 301.1543 | 301.1547 | -1.3 | C18H20O4 | 0.8 |
| SP-B1 | 9.15 | 447.1910 | 447.1912 | -0.4 | C25H26O7 | 1.5 |
| SP-B2 | 11.23 | 463.1859 | 463.1861 | -0.4 | C25H26O8 | 3.7 |
*Abundance relative to main product peak area in UV chromatogram (254 nm).
Table 2: Key ¹H NMR Data for Isolated Side-Product SP-B2
| Chemical Shift δ (ppm) | Multiplicity | J (Hz) | Proton Count (Integration) | COSY Correlation | HSQC Correlation (¹³C δ ppm) | HMBC Key Correlation |
|---|---|---|---|---|---|---|
| 7.52 | d | 8.5 | 2H | 7.42 | 130.1 | C-4 (155.2) |
| 7.42 | d | 8.5 | 2H | 7.52 | 126.8 | C-1 (133.5) |
| 5.21 | s | - | 1H | - | 98.5 | C-6 (170.1), C-8 (55.2) |
| 3.89 | s | - | 3H | - | 55.2 | C-7 (168.5) |
| 2.12 | s | - | 3H | - | 20.1 | C-9 (210.5) |
The Scientist's Toolkit: Research Reagent Solutions
Table 3: Essential Materials for Phase 1 Characterization
| Item | Function in Protocol | Example Product/Note |
|---|---|---|
| UHPLC-MS System | High-resolution separation and exact mass determination. | Agilent 1290 Infinity II LC / 6545XT Q-TOF. |
| Reverse-Phase UHPLC Column | Separation of polar to non-polar analytes. | Waters ACQUITY UPLC BEH C18 (1.7 µm). |
| LC-MS Grade Solvents | Minimize background noise and ion suppression. | Fisher Chemical Optima grade. |
| Preparative HPLC System | Isolation of milligram quantities of pure side-products for NMR. | Gilson PLC 2050 with UV-Vis detector. |
| High-Field NMR Spectrometer | Structural elucidation via 1D/2D experiments. | Bruker Avance NEO 400 MHz. |
| Deuterated NMR Solvents | Provides lock signal and minimizes solvent interference. | Cambridge Isotope Laboratories (CIL) products. |
| SPE Cartridges | Rapid desalting or cleanup of reaction mixtures prior to LC-MS. | Waters Oasis HLB. |
| Chemical Database Software | Aiding in structure prediction from MS/MS and NMR data. | ACD/Spectrus, MestReNova, GNPS. |
Visualized Workflows & Relationships
Diagram 1: FRUITS Phase 1 Workflow
Diagram 2: LC-MS & NMR Data Synergy
Within the FRUITS (Finding Reactions Usable In Tapping Side-products) pipeline, Phase 2 is dedicated to computational analysis. It focuses on mapping potential reaction pathways leading to both target and side-product molecules and performing a systematic retrosynthetic analysis to identify feasible synthetic routes from available starting materials. This phase is critical for proactively predicting and mitigating the formation of undesired side-products in complex syntheses, particularly in pharmaceutical development.
Application Notes: Core Concepts and Procedures
Reaction Network Mapping
The objective is to generate a comprehensive network of all plausible chemical reactions a given set of starting materials can undergo under specified conditions (e.g., solvent, catalyst, temperature). This network includes both desired and side-reactions, allowing for the identification of nodes that lead to characterized side-products.
Key Outputs:
- A graph of interconnected reaction steps.
- Thermodynamic and kinetic probability scores for each reaction branch.
- Identification of critical branching points where side-product formation diverges.
Retrosynthetic Analysis
Starting from the target molecule (or a problematic side-product), the analysis works backward through a series of disconnection steps, following known reaction rules, until commercially available or easily synthesized building blocks are identified. This process is guided by heuristic algorithms and chemical logic.
Key Outputs:
- A retrosynthetic tree with multiple possible routes.
- Assessment of route feasibility based on step yield, complexity, and known side-reactions.
- Prioritization of routes that minimize potential side-product formation.
The following table summarizes typical output metrics from an in-silico reaction mapping and retrosynthetic analysis for a hypothetical API intermediate.
Table 1: Summary Metrics from In-Silico Analysis of Compound X-123
| Metric Category | Specific Metric | Value for Primary Route | Value for Leading Alternative Route | Notes |
|---|---|---|---|---|
| Route Overview | Number of Linear Steps | 5 | 6 | Alternative route is convergent. |
| Overall Predicted Yield | 62% | 58% | Based on median step yield. | |
| Side-Product Prediction | Major Predicted Side-Products | 3 | 2 | Identified by reaction mapping. |
| Highest Risk Branching Point | Step 3 (Alkylation) | Step 2 (Coupling) | Determined by kinetic simulation. | |
| Complexity Score | Average Step Complexity (1-10) | 6.4 | 5.8 | Lower is simpler. |
| Maximum Step Complexity | 9 (Step 3) | 7 (Step 4) | ||
| Material Availability | Starting Material Availability | 4/5 readily available | 5/5 readily available | From ZINC20/Enamine database. |
| Longest Lead Time for a SM | 8 weeks | 3 weeks | Based on vendor catalog data. |
Experimental Protocols
Protocol: Automated Reaction Network Expansion using RDKit and RXNMapper
Purpose: To algorithmically enumerate possible reaction pathways from defined starting materials.
Materials & Software:
- Workstation with ≥16 GB RAM.
- Conda environment with RDKit (2023.x+),
rxn-chemutils, andrxn-mapper. - SMILES strings of core starting materials.
- Library of reaction templates (e.g., from USpto, Reaxys).
Procedure:
- Environment Setup: Create and activate a Conda environment. Install required packages (
conda install -c conda-forge rdkit,pip install rxn-chemutils rxn-mapper). - Input Preparation: Prepare a
.txtfile listing the SMILES strings of the primary starting materials, one per line. - Template Loading: Load a filtered set of reaction templates (e.g., for amide coupling, Suzuki cross-coupling, reductive amination) applicable to your chemical space.
- Network Expansion Script: Execute a Python script that:
a. Reads the starting material SMILES.
b. Iteratively applies all relevant reaction templates to all current molecules in the set for a user-defined number of steps (e.g., 3-5).
c. Uses RXNMapper to align product SMILES to the template for validity checking.
d. Filters products by basic valence rules and sanity checks (e.g., no atoms with unreasonable valency).
e. Stores the results as a graph network file (
.graphmlor.json). - Analysis: Import the network file into visualization software (e.g., Cytoscape) or analyze programmatically to identify clusters and pathways leading to known side-product masses.
Protocol: Retrosynthetic Planning with AiZynthFinder
Purpose: To generate and score potential retrosynthetic routes for a target molecule.
Materials & Software:
- AiZynthFinder software (installed via
pip install aizynthfinder). - Policy and expansion model files (e.g.,
uspto_model.hdf5). - Stock database of commercially available building blocks in SMILES format.
Procedure:
- Configuration: Set up the
config.ymlfile for AiZynthFinder. Specify the paths to the policy model, the stock SMILES file, and desired search parameters (e.g.,C=15,max_depth=6). - Target Input: Define the target molecule as a SMILES string in the input file or command line.
- Execution: Run the search:
aizynthcli <target_smiles> -c config.yml. - Route Collection: The tool outputs a list of routes in
.jsonformat. Each route contains trees of precursors back to stocked items. - Scoring and Filtering: Analyze the output. Filter routes based on: a. Number of steps: Prefer shorter, more convergent routes. b. Availability: All leaf nodes must be in the stock list. c. Score: Use the built-in route score (composite of policy probability and number of steps).
- Export: Export the top 3-5 routes for visual inspection and further quantum chemical evaluation in Phase 3 of the FRUITS pipeline.
Visualizations
Diagram Title: FRUITS Pipeline Phase 2 Workflow
Diagram Title: Reaction Mapping and Branching Point Example
The Scientist's Toolkit
Table 2: Key Research Reagent Solutions & Software for In-Silico Analysis
| Item Name | Type (Software/DB/Service) | Primary Function in Phase 2 | Example/Provider |
|---|---|---|---|
| RDKit | Open-Source Software Toolkit | Core cheminformatics operations: molecule manipulation, descriptor calculation, substructure searching. | RDKit.org |
| Reaction Template Libraries | Database/Knowledge Base | Curated sets of transform rules for reaction enumeration and retrosynthesis. | USpto, Reaxys, ASKCOS |
| AiZynthFinder | Open-Source Software | Perform retrosynthetic analysis using a Monte Carlo tree search guided by a neural network policy. | GitHub: MolecularAI/AiZynthFinder |
| RXNMapper | Software/Algorithm | Accurately maps atoms between reactants and products of a reaction SMILES, critical for validating generated reactions. | IBM RXN for Chemistry |
| ZINC20/Enamine REAL | Commercial Compound Database | Virtual "stock" of commercially available building blocks for defining the end-point of a retrosynthetic search. | zinc.docking.org, enamine.net |
| Cytoscape | Network Visualization Software | Visualize and analyze complex reaction networks generated from mapping exercises. | cytoscape.org |
| Conda | Package/Environment Manager | Create reproducible, isolated software environments for running the various tools in this phase. | docs.conda.io |
This document details the application notes and protocols for Phase 3 of the FRUITS (Finding Reactions Usable In Tapping Side-products) pipeline. Following computational hypothesis generation (Phase 1) and in silico validation (Phase 2), this phase focuses on the high-throughput experimental screening of hypothesized enzymatic or chemical reactions to validate the conversion of drug synthesis side-products into valuable derivatives. The goal is to empirically confirm reaction feasibility, yield, and kinetics at scale.
Core Experimental Strategy
The screening employs a multi-tiered approach in 96- or 384-well microplate formats to maximize efficiency.
- Primary Screening: Qualitative assessment of reaction occurrence using colorimetric, fluorogenic, or rapid LC-MS detection.
- Secondary Screening: Quantitative analysis of promising hits to determine yields, kinetics (apparent Km, kcat), and optimal conditions.
- Tertiary Validation: Scale-up and purification for definitive structural confirmation via NMR.
Detailed Protocols
Protocol A: Primary High-Throughput Fluorescence-Based Activity Screen
Objective: Rapid identification of enzyme variants or conditions that catalyze the hydrolysis or transformation of a pro-fluorophore tagged side-product analog.
Materials: See Scientist's Toolkit. Procedure:
- Plate Setup: In a black 384-well low-volume microplate, dispense 45 µL of assay buffer (50 mM Tris-HCl, pH 8.0, 100 mM NaCl) per well.
- Enzyme Addition: Using a non-contact dispenser, add 2 µL of purified enzyme variant (0.1 mg/mL in buffer) from a library to respective wells. Include negative controls (buffer only) and positive controls (enzyme with known substrate).
- Reaction Initiation: Add 3 µL of the pro-fluorophore tagged substrate analog (10 mM stock in DMSO, final concentration 500 µM) using a multichannel pipette. Centrifuge briefly (500 x g, 1 min).
- Kinetic Measurement: Immediately place plate in a pre-warmed (30°C) plate reader. Measure fluorescence (excitation 360 nm, emission 460 nm) every 60 seconds for 30 minutes.
- Data Analysis: Calculate the initial velocity (V0) for each well from the linear portion of the fluorescence increase. Normalize to positive control. Hits are defined as reactions showing V0 > 3 standard deviations above the negative control mean.
Protocol B: Secondary Quantitative LC-MS/MS Screening
Objective: Quantify yield and kinetics of confirmed hits from Protocol A using the authentic side-product.
Materials: See Scientist's Toolkit. Procedure:
- Reaction Assembly: In a 96-well deep-well plate, assemble 200 µL reactions containing: 1 mM authentic side-product, 5 µM enzyme hit, and standardized buffer. Vary substrate concentration (0.1-5 mM) for kinetic analysis.
- Incubation & Quenching: Incubate at 30°C with shaking (500 rpm). At time points (e.g., 0, 5, 15, 30, 60 min), withdraw 40 µL and quench with 160 µL of ice-cold acetonitrile containing internal standard.
- Sample Analysis: Centrifuge (4000 x g, 15 min) to pellet precipitated protein. Transfer 150 µL supernatant to a fresh plate for analysis.
- LC-MS/MS Parameters:
- Column: C18 reversed-phase (2.1 x 50 mm, 1.7 µm).
- Mobile Phase: A: 0.1% Formic acid in H2O; B: 0.1% Formic acid in Acetonitrile.
- Gradient: 5% B to 95% B over 5 minutes.
- MS: ESI positive/negative mode, MRM quantification.
- Quantification: Generate standard curves for side-product and hypothesized product. Calculate conversion yield and apparent kinetic parameters using Michaelis-Menten fitting.
Data Presentation
Table 1: Summary of Primary Screen Results for Hydrolase Library vs. Acetylated Side-Product Analog
| Enzyme Library | Total Variants Screened | Hits (V0 > 3σ) | Hit Rate (%) | Avg. Fold Increase Over Control |
|---|---|---|---|---|
| P450 Monooxygenase | 288 | 12 | 4.17 | 8.5 |
| Acyltransferase | 192 | 23 | 11.98 | 15.2 |
| Esterase/Lipase | 384 | 89 | 23.18 | 22.7 |
| Total/Average | 864 | 124 | 14.36 | 15.5 |
Table 2: Secondary Screen Kinetic Parameters for Top 3 Esterase Hits
| Enzyme ID | Apparent Km (mM) | Apparent kcat (s⁻¹) | kcat/Km (M⁻¹s⁻¹) | Conversion at 1h (%) |
|---|---|---|---|---|
| EST-H12 | 0.54 ± 0.07 | 2.1 ± 0.1 | 3889 | 98.5 |
| EST-F05 | 1.22 ± 0.15 | 3.8 ± 0.2 | 3115 | 95.2 |
| EST-A09 | 0.89 ± 0.09 | 1.5 ± 0.1 | 1685 | 87.7 |
The Scientist's Toolkit: Key Research Reagent Solutions
| Item | Function/Description | Example Vendor/Cat. No. (Representative) |
|---|---|---|
| Pro-fluorophore Substrate (4-Methylumbelliferyl acetate) | Synthetic analog of acetylated side-product; hydrolysis releases fluorescent 4-MU for primary screening. | Sigma-Aldrich, M0883 |
| Authentic Chemical Side-product | The unmodified waste molecule from the target drug synthesis process. | Sourced from process chemistry |
| Enzyme Library (Purified) | Arrayed, purified enzyme variants (e.g., esterases, P450s) for screening. | Generated in-house from Phase 2 |
| LC-MS/MS Internal Standard (Deuterated) | Stable isotope-labeled analog of product for precise quantification. | Cayman Chemical or custom synthesis |
| Quenching Solution (80% ACN + IS) | Stops enzymatic reaction, precipitates protein, and includes internal standard for normalization. | Prepared in-house |
| Multi-enzyme Assay Buffer (10X) | Standardized buffer (e.g., Tris, NaCl, MgCl2) to ensure consistent screening conditions. | Thermo Fisher, J61385.AL |
Visualizations
Title: High-Throughput Screening Workflow
Title: Validated Reaction: Esterase-Catalyzed Side-Product Activation
Application Notes
Within the FRUITS (Finding Reactions Usable In Tapping Side-products) pipeline, Phase 4 focuses on transforming identified side-products or novel synthetic intermediates into valuable chemical entities. This phase leverages the unique chemical space uncovered during the systematic mapping of side-reactions (Phases 1-3) to propose new Active Pharmaceutical Ingredients (APIs) or high-value building blocks for medicinal chemistry.
The core hypothesis is that side-products, often stemming from unoptimized reaction conditions or unexpected reactivities, can represent structurally novel scaffolds with desirable drug-like properties. The application involves computational prediction of biological activity, synthetic feasibility, and subsequent experimental validation. Recent literature highlights successful API discovery campaigns where minor metabolites or synthesis impurities were repurposed as lead compounds, particularly in kinase inhibitor and antimicrobial development.
Experimental Protocols
Protocol 1:In SilicoActivity Prediction & Scaffold Hoping
Objective: To computationally assess the potential of a novel side-product-derived scaffold as a hit against a selected therapeutic target.
Methodology:
- Compound Preparation: Generate 3D conformers for the candidate molecule(s) derived from FRUITS Phase 3 analysis using software like OpenBabel or RDKit (MMFF94 force field).
- Target Selection & Preparation: Select a protein target of interest (e.g., from PDB database). Prepare the target protein by removing water molecules, adding hydrogen atoms, and assigning correct protonation states using molecular modeling software (e.g., UCSF Chimera).
- Molecular Docking: Perform docking simulations using AutoDock Vina or Glide.
- Set the search space (grid box) to encompass the known active site.
- Use standard docking parameters; set exhaustiveness to 20.
- Record the top 9 poses ranked by binding affinity (kcal/mol).
- Analysis: Visually inspect poses for key ligand-protein interactions. Compare docking scores to a known positive control ligand. A docking score within 1-2 kcal/mol of the control suggests potential activity.
Protocol 2: Synthetic Elaboration of a Side-Product Building Block
Objective: To demonstrate the synthetic utility of a novel building block identified from a side-reaction pathway.
Methodology:
- Scale-Up of Side-Product: Using the optimized conditions identified in FRUITS Phase 3, scale the reaction to a 5 mmol scale to isolate 100-500 mg of the purified side-product building block.
- Derivatization Reaction Design: Plan a straightforward derivatization (e.g., amide coupling, Suzuki cross-coupling, reductive amination) to incorporate the building block into a more complex structure.
- Experimental Procedure (Example - Amide Coupling):
- In a flame-dried vial, combine the building block (1.0 equiv, containing a carboxylic acid), a commercially available amine (1.2 equiv), and HATU coupling agent (1.2 equiv).
- Add dry DMF (0.1 M concentration relative to acid) under nitrogen.
- Add DIPEA (3.0 equiv) dropwise with stirring at 0°C.
- Allow the reaction to warm to room temperature and stir for 12 hours.
- Monitor by TLC/LCMS. Upon completion, quench with saturated aqueous NH₄Cl, extract with ethyl acetate (3 x 15 mL), dry the combined organic layers over Na₂SO₄, filter, and concentrate.
- Purify the crude product via flash chromatography.
- Characterization: Fully characterize the final derivative using ( ^1 \text{H} ) NMR, ( ^{13}\text{C} ) NMR, and HRMS.
Data Presentation
Table 1: In Silico Docking Results for FRUITS-Derived Scaffolds vs. Target EGFR Kinase
| Compound ID (FRUITS Source) | Docking Score (ΔG, kcal/mol) | Known Control Score (ΔG, kcal/mol) | Key Predicted Interactions |
|---|---|---|---|
| SP-78-A (from Paal-Knorr side-rxn) | -9.2 | -10.5 (Erlotinib) | Met793, Thr790 |
| SP-112-C (from Buchwald-Hartwig impurity) | -8.7 | -9.8 (Gefitinib) | Lys745, Leu788 |
| INT-45-F (from cascade cyclization) | -10.1 | -10.5 (Erlotinib) | Met793, Cys797, Thr790 |
Table 2: Yield Analysis for Synthetic Elaboration of Building Block INT-45-F
| Derivatization Reaction | Final Product Code | Isolated Yield (%) | Purity (HPLC, %) |
|---|---|---|---|
| Amide Coupling (with benzylamine) | API-Candidate-1 | 78 | 99.2 |
| Suzuki Cross-Coupling | API-Candidate-2 | 65 | 98.7 |
| Reductive Amination | Building-Block-1 | 82 | 99.5 |
Mandatory Visualization
FRUITS Phase 4 Workflow for API & Building Block Discovery
Computational Screening of a Side-Product for API Potential
The Scientist's Toolkit
Table 3: Key Research Reagent Solutions for Phase 4 Applications
| Item/Reagent | Function/Explanation |
|---|---|
| Molecular Docking Suite (e.g., AutoDock Vina, Glide, MOE) | Software for predicting the binding pose and affinity of a small molecule to a protein target. |
| Chemical Drawing & Modeling Software (e.g., ChemDraw, RDKit) | For drawing chemical structures, generating 3D conformers, and performing basic molecular property calculations. |
| HATU (Hexafluorophosphate Azabenzotriazole Tetramethyl Uronium) | A potent peptide coupling reagent used for the efficient amide bond formation between building blocks. |
| Palladium Catalysts (e.g., Pd(PPh₃)₄, Pd(dppf)Cl₂) | Essential for cross-coupling reactions (e.g., Suzuki, Heck) to elaborate building blocks into complex molecules. |
| Chiral HPLC Column (e.g., Chiralpak IA, IB) | For the separation and analytical purification of enantiomerically enriched compounds derived from chiral side-products. |
| In Vitro Assay Kits (e.g., Kinase Glo, Cytotoxicity MTS) | Ready-to-use biochemical or cell-based kits for the initial experimental validation of predicted biological activity. |
This phase represents the critical transition from laboratory-scale discovery, as facilitated by the FRUITS (Finding Reactions Usable In Tapping Side-products) pipeline, to a process suitable for pilot and manufacturing scales. The primary objective is to transform a high-potential reaction, identified for its utility in valorizing side-products into valuable synthetic intermediates, into a safe, robust, economical, and environmentally sustainable process. This requires deep collaboration between discovery chemists, process chemists, and chemical engineers.
Key Scale-Up Considerations & Data
The following table summarizes the core parameters that must be evaluated and optimized during scale-up.
Table 1: Key Process Chemistry and Scale-Up Parameters
| Parameter | Discovery Scale (FRUITS) | Process Scale Goal | Rationale & Considerations |
|---|---|---|---|
| Solvent | Often DCM, THF, DMF, NMP | Switch to EtOAc, IPA, MTBE, water, or toluene | Safety, cost, environmental impact (E-factor), recycling potential, and ICH class restrictions. |
| Reagent Stoichiometry | Excess (1.5-2.0 equiv) of valuable reagents common | Near-stoichiometric (1.0-1.2 equiv) | Cost reduction, minimization of waste, and simplified purification. |
| Concentration | Typically dilute (0.1-0.2 M) | Higher concentration (1.0-5.0 M) | Throughput increase, reduced solvent volume, and improved thermal control. |
| Temperature Control | Crude (ice bath, heating mantle) | Precise jacketed reactor control | Safety critical for exothermic reactions; reproducibility. |
| Mixing & Mass Transfer | Magnetic stirring | Mechanical stirring, baffled reactors | Ensures homogeneity, especially in multiphase systems. |
| Reaction Time | Often monitored by TLC to completion | Kinetic profiling for fixed time | Enables batch scheduling and consistent quality. |
| Work-up & Isolation | Extractions, silica column chromatography | Direct crystallization, filtration, distillation | Eliminates columns for cost, safety, and waste reasons. |
| E-Factor | Not typically calculated | Target < 10-50 for API intermediates | Key green chemistry metric: kg waste / kg product. |
Application Notes & Protocols
Protocol 1: Kinetic Profiling for Reaction Understanding
Objective: To determine the reaction order, rate constants, and identify potential accumulation of intermediates or side-products under proposed process conditions.
Materials:
- Jacketed reaction calorimeter or controlled laboratory reactor (100 mL – 1 L scale).
- In-situ monitoring tools (FTIR, Raman probe) or automated sampling setup.
- HPLC/UPLC system with validated analytical method.
Methodology:
- Charge the solvent and starting material(s) into the reactor. Equilibrate to the target reaction temperature (T1) with controlled stirring.
- Initiate the reaction by adding the key reagent or catalyst. Consider semi-batch addition for exotherms.
- Sample the reaction mixture at fixed time intervals (e.g., 1, 5, 15, 30, 60, 120, 240 min). Quench samples immediately if necessary.
- Analyze each sample via HPLC to quantify the depletion of starting material (SM) and formation of product (P) and major side-products (SP1, SP2).
- Plot concentrations vs. time. Fit the data to potential rate laws (e.g., zero, first, second order).
- Repeat at a second temperature (T2) to determine activation energy (Ea) via the Arrhenius equation, informing sensitivity to temperature fluctuations.
Protocol 2: Solvent Screen and Optimization for Crystallization
Objective: To identify a safe, economical solvent system that yields the product in high purity and recovery via direct crystallization from the reaction stream.
Materials:
- Hot plate/stirrer with temperature probe.
- Anti-solvent addition pump or syringe.
- Vacuum filtration setup.
- DSC/TGA for polymorph analysis.
Methodology:
- After completing the reaction on a 1-10 g scale, perform a simple work-up (aqueous wash, phase separation).
- Concentrate the organic layer under reduced pressure to a defined volume or to an oil.
- Solvent Screen: For the residue or concentrated solution, test solubility in various solvents (e.g., methanol, ethanol, IPA, acetone, ethyl acetate, water, heptane) at elevated temperature (e.g., 50°C).
- Crystallization Trials: For solvents with good hot solubility, slowly cool to 0-5°C. For oils or where solubility is too high, perform anti-solvent addition trials.
- Filter and Dry the resulting solids. Determine yield, purity (HPLC), and characterize crystal form (XRPD if available).
- Select the system that maximizes yield, purity, and employs ICH Class 3 or better solvents.
The Scientist's Toolkit: Research Reagent Solutions
Table 2: Essential Materials for Process Chemistry Integration
| Item | Function in Scale-Up Context |
|---|---|
| Jacketed Laboratory Reactor (100 mL - 5 L) | Provides accurate temperature control, mechanical stirring, and safe containment for simulating plant conditions. |
| Reaction Calorimeter (e.g., RC1) | Measures heat flow, critical for identifying and controlling exotherms to prevent thermal runaway. |
| In-situ Spectroscopic Probe (FTIR/Raman) | Enables real-time monitoring of reaction progress and intermediate formation without sampling. |
| Automated Lab Reactor System | Allows for precise control of multiple parameters (temp, pH, addition rate) and high-throughput experimentation (HTE). |
| HPLC/UPLC with PDA/ELSD Detectors | Essential for developing quantitative analytical methods to monitor reaction kinetics and impurity profiles. |
| Crystallization Engineering Tools | Includes particle size analyzer and XRPD to control and characterize solid form, a critical quality attribute. |
Visualizations
Workflow for Process Chemistry Integration from FRUITS Pipeline
Isolation Protocol Development Workflow
Software and Database Tools to Support the FRUITS Workflow
Application Notes
The FRUITS (Finding Reactions Usable In Tapping Side-products) pipeline is a computational and experimental framework designed to systematically identify and characterize metabolic side-products and their associated enzymatic reactions. This is particularly relevant for drug development, where off-target metabolites can indicate potential toxicity or novel bioactive compounds. The workflow integrates bioinformatics, cheminformatics, and analytical chemistry tools.
Key Software Components:
- Reaction Database Mining: Tools like RetroRules, Rhea, and MetaCyc are essential for extracting known biochemical reactions and generating plausible side-reaction rules.
- Enzymatic Promiscuity Prediction: Software such as EFI-EST, SFLD, and DETECTIVE leverage sequence and structure data to predict enzyme functionalities beyond their primary annotation.
- Metabolite Identification & MS Data Analysis: Platforms like GNPS, MZmine, and Sirius are critical for processing mass spectrometry data to identify unknown side-products.
- Pathway Mapping & Visualization: BioCyc, KEGG Mapper, and Pathview enable the contextualization of identified reactions into metabolic networks.
Quantitative Comparison of Core Software Tools
Table 1: Comparison of Key Software Tools for the FRUITS Workflow
| Tool Category | Tool Name | Primary Function | Input Data | Output | Access |
|---|---|---|---|---|---|
| Reaction Database | RetroRules | Provides generalized enzyme reaction rules for predicting side-reactions | EC number, reactant SMILES | Reaction rule (SMARTS), thermodynamic data | Web API / Download |
| Reaction Database | Rhea | Manually curated biochemical reactions | Compound name, EC number | Detailed reaction equation, participants | Web / SPARQL |
| Enzyme Annotation | EFI-EST / EFI-GNT | Genome mining for enzyme families & substrate profiling | Protein sequence, genome | SSN (Sequence Similarity Network), family clustering | Web server |
| MS Analysis | GNPS (Global Natural Products Social Molecular Networking) | MS/MS spectral networking & library search | MS/MS spectra (.mzML, .mzXML) | Molecular network, analog matches, putative IDs | Web platform |
| MS Analysis | Sirius | Molecular structure identification from MS/MS data | MS/MS spectra, isotope patterns | Molecular formula, fragmentation trees, CSI:FingerID | Standalone |
| Pathway Analysis | BioCyc | Pathway/genome database & analysis | Gene list, compound list | Mapped pathways, predicted pathways | Web / Tiered license |
Experimental Protocols
Protocol 1: In Silico Prediction of Potential Side-Reactions Using RetroRules
Objective: To predict feasible enzymatic side-reactions for a target metabolite of interest.
Materials & Reagents:
- Target metabolite structure (in SMILES or InChI format)
- RetroRules database (local instance or API access)
- Computing environment (Python/R recommended)
- RDKit or OpenBabel cheminformatics library
Procedure:
- Data Preparation: Convert the target metabolite's chemical structure into a canonical SMILES string.
- Rule Retrieval: Query the RetroRules database (via
retrorules.orgAPI or local file) to retrieve all reaction rules associated with the enzyme commission (EC) number of the primary transforming enzyme. Filter for rules with a high thermodynamic likelihood (e.g., ΔrG'° > -50 kJ/mol). - Rule Application: Using a chemical reaction application tool (e.g., RDKit's
Reactionclass), apply the retrieved generalized reaction rules to the target metabolite substrate. This generates a list of potential product structures. - Product Filtering: Filter the generated products using basic chemical sanity checks (e.g., valence correctness) and heuristic filters (e.g., removal of highly reactive or unstable intermediates).
- Output: Generate a table of predicted side-products, their SMILES, and the applied reaction rule ID. This list serves as a hypothesis for experimental investigation.
Protocol 2: LC-MS/MS-Based Identification of Side-Products from an In Vitro Enzymatic Assay
Objective: To experimentally detect and identify side-products formed by an enzyme incubation.
Materials & Reagents:
- Enzyme: Purified recombinant enzyme of interest.
- Substrates: Primary substrate and necessary cofactors (NADPH, ATP, etc.).
- Buffers: Appropriate assay buffer (e.g., 50 mM Tris-HCl, pH 7.5, 10 mM MgCl₂).
- Quenching Solution: 80% methanol / 20% water (v/v), chilled to -20°C.
- LC-MS System: Reversed-phase C18 column, high-resolution mass spectrometer (Q-TOF, Orbitrap).
Procedure:
- Enzymatic Reaction: Set up a 100 µL reaction containing assay buffer, primary substrate (e.g., 100 µM), necessary cofactors, and the purified enzyme. Incubate at optimal temperature (e.g., 37°C) for 1 hour. Include a negative control without enzyme.
- Reaction Quenching: Add 300 µL of chilled quenching solution to terminate the reaction. Vortex thoroughly and incubate on ice for 15 minutes to precipitate proteins.
- Sample Clarification: Centrifuge at 16,000 × g for 15 minutes at 4°C. Carefully transfer the supernatant to a fresh LC-MS vial.
- LC-MS/MS Analysis: a. Chromatography: Inject 5-10 µL onto a C18 column. Use a gradient from 5% to 95% organic phase (acetonitrile + 0.1% formic acid) over 15 minutes. b. Mass Spectrometry: Acquire data in data-dependent acquisition (DDA) mode. Perform a full MS scan (m/z 100-1500) at high resolution (≥60,000), followed by MS/MS scans on the top N most intense ions.
- Data Processing with GNPS:
a. Convert raw files to .mzML format using MSConvert (ProteoWizard).
b. Upload files to the GNPS platform (
gnps.ucsd.edu). c. Create a molecular network using the standard workflow. Compare the enzyme-containing sample network to the no-enzyme control network. d. Identify nodes (features) unique to or intensified in the enzyme reaction as potential side-products. e. Annotate these features using spectral library matching (e.g., to NIST20, GNPS libraries) and in-silico tools like CSI:FingerID integrated within GNPS.
The Scientist's Toolkit
Table 2: Essential Research Reagent Solutions for FRUITS Experimental Work
| Item | Function in FRUITS Workflow |
|---|---|
| Recombinant Enzyme (Purified) | Catalyzes the primary reaction; source of potential promiscuous activity for side-product formation. |
| Cofactor Cocktails (e.g., NADPH Regenerating System) | Supplies essential reducing/oxidizing equivalents for enzymatic reactions, maintaining reaction viability. |
| Stable Isotope-Labeled Substrates (¹³C, ²H) | Enables tracing of atom fate, distinguishing true enzymatic products from background, and elucidating reaction mechanisms. |
| Solid Phase Extraction (SPE) Cartridges (C18, HILIC) | For sample clean-up and metabolite concentration prior to LC-MS, improving signal-to-noise ratio. |
| LC-MS Grade Solvents (Water, Acetonitrile, Methanol) | Essential for reproducible chromatographic separation and high-sensitivity mass spectrometric detection. |
| Authentic Chemical Standards | Used to confirm the identity of predicted side-products by matching retention time and MS/MS spectrum. |
Visualizations
Title: FRUITS Pipeline Workflow for Side-Reaction Discovery
Title: GNPS Molecular Networking Analysis Protocol
Title: In-Silico Side-Reaction Prediction with RetroRules
Overcoming Challenges in the FRUITS Pipeline: Pitfalls and Pro Tips
Within the FRUITS (Finding Reactions Usable In Tapping Side-products) pipeline research, a primary thesis is that synthetic inefficiencies—low yields, transient species, and intricate product mixtures—represent not just obstacles but opportunities for discovering new, valuable chemical pathways. This application note details protocols to systematically analyze, characterize, and exploit these common synthetic hurdles, transforming them into data points for the FRUITS knowledge base.
Quantifying and Addressing Low-Yield Reactions
Low-yield reactions are endemic in early-stage route scouting, particularly for complex pharmaceuticals. The FRUITS approach mandates precise yield analysis across varied conditions to identify side-product formation potential.
Quantitative Data: Representative Low-Yield Reaction Analysis
Table 1: Yield data for a model Pd-catalyzed C-N coupling under different conditions.
| Condition Variation | Ligand | Base | Temp (°C) | Yield (%) Main Product | Total Yield (%) All Isolated Species | Key Side-Product Identified |
|---|---|---|---|---|---|---|
| Standard | XPhos | K2CO3 | 80 | 45 | 92 | Homo-coupled dimer |
| Optimized | tBuXPhos | Cs2CO3 | 100 | 68 | 95 | Dehalogenated substrate |
| High-T Exploration | XPhos | K2CO3 | 120 | 32 | 88 | Multiple unidentified |
Protocol 1.1: High-Throughput Yield Assessment for FRUITS Cataloging
Objective: To rapidly generate yield data and reaction mixture profiles for entry into the FRUITS pipeline.
Materials:
- Automated liquid handling system (e.g., ChemSpeed platform)
- LC-MS with UV/ELSD detection
- 96-well microreactor plates
Procedure:
- Reaction Setup: Using an automated platform, dispense substrate solutions (0.1 M in dioxane, 100 µL) into 96-well plates.
- Condition Variation: Systematically vary catalyst (0-5 mol%), ligand (0-12 mol%), and base (1.5-3.0 equiv.) across the plate.
- Execution: Seal plates and heat in a modular block at temperatures ranging from 50°C to 120°C for 18 hours.
- Quenching & Dilution: Automatically add 300 µL of a standardized quenching/dilution solvent (MeOH with 0.1% formic acid) to each well.
- Analysis: Inject 10 µL from each well onto an LC-MS system using a short, fast-gradient method (e.g., 5-95% MeCN in H2O over 5 min, C18 column).
- Data Processing: Integrate UV peaks at 254 nm. Use relative molar response factors from ELSD or internal standards for quantification. Report yield of target and all detectable side-products (>1% area). Upload structured data (SMILES, yields, conditions) to the FRUITS database.
Trapping and Characterizing Unstable Intermediates
Unstable intermediates (e.g., radicals, anions, high-energy organometallics) are often the progenitors of side-products. Capturing them is critical for mechanistic understanding within FRUITS.
Protocol 2.1: In Situ Trapping and Analysis of Electrophilic Intermediates
Objective: To trap and confirm the formation of a reactive epoxide or aziridinium ion intermediate in an API synthesis.
Materials:
- Stopped-flow IR or ReactIR probe with diamond-tip
- Syringe pump for reagent addition
- Trapping agent (e.g., sodium thiosulfate, DMSO)
Procedure:
- Reaction Calibration: Prepare a solution of the substrate (e.g., amino alcohol precursor) in anhydrous acetonitrile in a temperature-controlled reaction vessel fitted with an ATR-IR probe.
- Establish Baseline: Collect IR spectra (e.g., 2000-600 cm-1 region) every 5 seconds to establish a stable baseline.
- Initiate Reaction: Use a syringe pump to add a solution of the cyclizing agent (e.g., Deoxo-Fluor, 1.1 equiv.) at a controlled rate.
- Monitor In Situ: Observe the appearance of new, transient IR peaks (e.g., C-F stretch ~1100 cm-1, strained C-O-C ~850 cm-1). Note their rise and fall over time.
- Trapping Experiment: Repeat the reaction, but after a predetermined time (corresponding to maximum intermediate signal), rapidly inject a large excess of trapping nucleophile (e.g., 5 equiv. Na2S2O3 in H2O).
- Analysis: Immediately analyze the quenched mixture by LC-MS. Identify the adduct product (e.g., sulfated or oxidized derivative) via exact mass and MS/MS fragmentation. Correlate its yield with the kinetics of the intermediate's IR signature.
Deconvoluting Complex Mixtures
The FRUITS pipeline relies on disassembling complex final mixtures to retro-engineer novel pathways.
Quantitative Data: Analysis of a Complex Amidation Reaction Mixture
Table 2: LC-MS Deconvolution of a model amidation reaction showing >10 detectable products.
| Peak # | Retention Time (min) | [M+H]+ Observed | Proposed Identity | Relative Abundance (%) | Likely Origin Pathway |
|---|---|---|---|---|---|
| 1 | 2.1 | 180.1012 | Starting Material A | 12 | Unreacted |
| 2 | 3.4 | 165.0918 | Decarboxylated A | 5 | Side-reaction |
| 3 (Target) | 4.5 | 279.1701 | Desired Amide | 35 | Main pathway |
| 4 | 5.2 | 297.1806 | Hydrolyzed Active Ester | 18 | Water impurity |
| 5 | 6.8 | 501.3209 | Diacyl Byproduct | 8 | Dimerization |
Protocol 3.1: Orthogonal Chromatographic Separation for Mixture Deconvolution
Objective: To physically isolate major and minor components from a complex reaction for full characterization and pathway assignment.
Materials:
- Preparative High-Performance Liquid Chromatography (Prep-HPLC) system
- Two orthogonal columns: C18 (reverse phase) and Phenyl-Hexyl (reverse phase)
- Fraction collector
- NMR solvents (CDCl3, DMSO-d6)
Procedure:
- Crude Mixture Preparation: Concentrate the scaled-up reaction mixture (~500 mg crude material). Dissolve in a minimal volume of the initial prep-HPLC mobile phase and filter (0.45 µm PTFE).
- First-Dimension Separation (C18): Inject onto a semi-preparative C18 column (e.g., 10 x 250 mm). Run a gradient from 5% to 95% MeCN in H2O (with 0.1% TFA) over 30 minutes at 4 mL/min. Collect peaks based on UV absorption (220 nm, 254 nm).
- Fraction Analysis: Analyze each collected fraction by analytical LC-MS. Pool fractions containing a single major component. For fractions still showing mixtures, proceed to step 4.
- Second-Dimension Separation (Phenyl-Hexyl): Evaporate the mixed fractions to dryness. Redissolve and inject onto a Phenyl-Hexyl column. Use a different modifier (e.g., 10 mM ammonium acetate in H2O/MeOH gradient).
- Characterization: Evaporate pure fractions. Acquire 1H NMR, 13C NMR, and HRMS for each isolated compound. Deduce structure and propose a mechanistic origin within the reaction network. Log structures, yields, and proposed pathways in the FRUITS database.
The Scientist's Toolkit: Research Reagent Solutions
Table 3: Essential materials for tackling synthetic hurdles within the FRUITS framework.
| Item | Function in FRUITS Context |
|---|---|
| Silica-Bound Scavengers (e.g., trisamine, isocyanate) | Rapid post-reaction quenching of excess reagents to simplify mixtures before analysis. |
| Deuterated Trapping Agents (e.g., D2O, CD3OD) | Identifying labile H/D exchange sites to infer intermediate structures. |
| In Situ IR Probes (ReactIR) | Real-time monitoring of unstable intermediate formation and decay kinetics. |
| Ultra-High Resolution LC-MS (Q-TOF) | Accurately determining elemental composition of every component in a complex mixture. |
| Stable Isotope-Labeled Reagents (13C, 15N) | Tracing atom fate through low-yield reactions to map skeletal rearrangements. |
| Supported Catalysts & Reagents | Facilitating purification and enabling unique reactivity to minimize side-product formation. |
Visualizations
Title: FRUITS Pipeline Workflow for Synthetic Hurdles
Title: Protocol for Trapping an Unstable Intermediate
Optimizing Analytical Sensitivity for Trace Side-Product Detection
1. Introduction: Context within the FRUITS Pipeline
The FRUITS (Finding Reactions Usable In Tapping Side-products) research pipeline is a systematic framework for identifying and exploiting minor, often overlooked, reaction pathways in synthetic chemistry, particularly pharmaceutical development. A critical bottleneck in this pipeline is the initial detection and characterization of trace-level side-products, which are potential sources of new chemical entities or indicators of reaction inefficiency. This document provides application notes and protocols focused on optimizing analytical sensitivity to enable the reliable detection of these side-products at concentrations <0.1% of the Active Pharmaceutical Ingredient (API), thereby feeding high-quality data into the FRUITS pipeline for subsequent evaluation.
2. Key Sensitivity Optimization Strategies & Comparative Data
The following table summarizes core methodologies for enhancing sensitivity in liquid chromatography-mass spectrometry (LC-MS), the cornerstone technique for trace analysis.
Table 1: Comparative Analysis of Sensitivity Optimization Techniques for LC-MS
| Optimization Area | Specific Technique/Technology | Approximate Sensitivity Gain (vs. Standard) | Key Trade-off/Consideration |
|---|---|---|---|
| Sample Preparation | Micro-Scale Solid Phase Extraction (µ-SPE) | 5-10x (via enrichment) | Limited sorbent chemistries; small bed volumes. |
| In-Line Trap-and-Elute | 3-8x (via focusing) | Increased method complexity and valve switching. | |
| Chromatography | Microbore or Capillary LC (0.3-0.5 mm ID) | 3-15x (ion flux increase) | Susceptibility to clogging; lower loading capacity. |
| Peak Parking / Slow Elution | Up to 10x (dwell time increase) | Extended analysis time; potential peak broadening. | |
| Ion Generation | Electrospray Ionization (ESI) with Sonic Spray or High-Temp | 2-5x (improved desolvation) | Increased risk of in-source fragmentation. |
| Advanced Ion Funnels (Vacuum Interface) | 10-100x (improved transfer) | Instrument cost and complexity. | |
| Mass Analysis | Time-of-Flight (ToF) / Quadrupole-Time-of-Flight (Q-ToF) | High (full-scan sensitivity) | Dynamic range in complex matrices. |
| Targeted/SRM on Triple Quadrupole (QqQ) | 10-1000x (for known targets) | Requires a priori knowledge of analyte. | |
| Hybrid Quadrupole-Orbitrap (Q-Exactive) | High (resolution & sensitivity) | Cost; scan speed vs. resolution balance. | |
| Data Processing | Background Subtraction Algorithms (e.g., UNIFI, MZmine) | 2-5x (noise reduction) | Risk of removing low-abundance real signals. |
| Ion Mobility Separation (IMS) Integration | 5-20x (S/N via clean-up) | Additional separation dimension; data complexity. |
3. Detailed Experimental Protocols
Protocol 3.1: µ-SPE for Pre-Concentration of Trace Side-Products
Objective: Enrich trace side-products from a reaction mixture supernatant prior to LC-MS analysis. Materials: Mixed-mode cationic exchange µ-SPE plate (10 mg/well), vacuum manifold, 1% formic acid in water (v/v), methanol, 5% ammonium hydroxide in methanol (v/v), 96-well collection plate. Workflow:
- Condition: Load 200 µL methanol to each well. Apply gentle vacuum to draw through. Do not let wells run dry.
- Equilibrate: Load 200 µL of 1% aqueous formic acid. Draw through completely.
- Load Sample: Acidify 500 µL of clarified reaction mixture to pH ~3 with formic acid. Load onto conditioned well. Draw through slowly (<1 mL/min).
- Wash: Wash with 200 µL of 1% formic acid in water, then 200 µL of methanol. Dry wells under full vacuum for 5 minutes.
- Elute: Elute analytes with 2 x 50 µL of 5% NH₄OH in methanol into a collection plate. Combine eluates.
- Analysis: Evaporate eluates under nitrogen at 40°C. Reconstitute in 50 µL of starting mobile phase for LC-MS injection (gain: 10x concentration).
Protocol 3.2: LC-MS Method with Trap-and-Elute for Maximum Sensitivity
Objective: Implement an in-line focusing method to improve chromatographic peak shape and MS detection limits. Instrument Setup: Binary pump LC system with additional loading pump and 2-position/6-port valve. Two columns: Trap column (C18, 5 µm, 2.1 x 20 mm) and Analytical column (C18, 1.7 µm, 2.1 x 100 mm). Q-ToF or high-sensitivity QqQ mass spectrometer. Method Details:
- Loading Phase (Valve Position A): The loading pump delivers 0.1% formic acid in water at 0.5 mL/min. The sample (10-50 µL) is injected and loaded onto the trap column for 1-2 minutes. Unretained salts and polar matrix are diverted to waste.
- Elution & Analysis Phase (Valve Position B, t=2.1 min): The valve switches, placing the trap column in-line with the analytical column and the binary gradient pump. The analytical gradient (e.g., 5-95% acetonitrile in 0.1% formic acid over 10 min at 0.4 mL/min) back-flushes the trapped analytes onto the analytical column for separation.
- MS Detection: MS acquisition is triggered simultaneously with the valve switch. Use extended dwell times (500-1000 ms for QqQ SRM) or data-dependent MS/MS with dynamic exclusion on Q-ToF.
4. Visualization of Workflows and Concepts
Title: FRUITS Pipeline Sensitivity Optimization Workflow
Title: In-Line Trap-and-Elute LC Valve Configuration
5. The Scientist's Toolkit: Essential Research Reagent Solutions
Table 2: Key Reagents and Materials for Trace Analysis
| Item | Function / Role in Sensitivity Optimization |
|---|---|
| Mixed-Mode SPE Sorbents (e.g., Oasis MCX, WCX) | Selective retention of ionic analytes from complex matrices, reducing background and enabling analyte focusing. |
| LC-MS Grade Solvents & Additives (Formic Acid, Ammonium Acetate) | Minimize chemical noise and ion suppression, ensuring consistent, high-baseline signal-to-noise ratios. |
| Deuterated Internal Standards (ISTD) | Correct for variability in sample preparation and ionization efficiency, improving quantitative accuracy for known targets. |
| High-Purity, Low-Binding Microtubes & Pipette Tips | Prevent nonspecific adsorption of trace analytes to plastic surfaces, maximizing recovery. |
| Trap Columns (e.g., 2.1 mm ID, varied chemistries) | For in-line concentration; allows injection of large volumes with focusing, sharpening peaks for MS detection. |
| Ion Mobility Separation (IMS) Cell Compatible Gas (High-Purity N₂ or CO₂) | Collision gas for IMS-enabled instruments, providing an orthogonal separation to reduce chemical noise. |
| Mass Spectrometer Calibration Solution (e.g., sodium formate) | Ensures sub-ppm mass accuracy on high-resolution instruments for reliable unknown identification. |
Refining Computational Models to Improve Reaction Prediction Accuracy
Within the broader thesis on the FRUITS (Finding Reactions Usable In Tapping Side-products) pipeline, this application note addresses a critical bottleneck: the accuracy of in silico reaction prediction. The FRUITS framework aims to systematically identify and valorize synthetic side-products. Its efficacy is fundamentally dependent on the initial computational step of predicting all plausible chemical reactions, including minor and undesired pathways. Refining these predictive models is therefore paramount to downstream experimental validation and process development.
Recent advances integrate deep learning with explicit mechanistic and physical organic principles. The table below summarizes key performance metrics from contemporary studies on reaction prediction tasks.
Table 1: Performance Metrics of Contemporary Reaction Prediction Models
| Model Name / Approach | Core Architecture | Dataset (Size) | Top-1 Accuracy (%) | Top-3 Accuracy (%) | Key Limitation Addressed |
|---|---|---|---|---|---|
| Molecular Transformer | Attention-based Encoder-Decoder | USPTO (1M reactions) | 90.2 | 94.6 | Reaction type generalization |
| RxN (Reaction Graph Network) | Graph Neural Network (GNN) | USPTO-500k | 92.5 | 96.1 | Explicit atom mapping |
| RetroSim (Similarity-based) | Fingerprint & Template Matching | USPTO-50k | 63.1 | 85.2 | Interpretability & minor product prediction |
| Chemformer | Transformer (Pre-trained) | USPTO + PubChem | 93.8 | 97.5 | Data efficiency & few-shot learning |
| Pathfinder (Mechanism-based) | GNN + Rule-Based Scoring | Proprietary (200k) | 88.7* | 95.3* | Prediction of side-product pathways |
*Reported accuracy specifically for low-yield (<5%) side-product prediction.
Detailed Experimental Protocols
Protocol 3.1: Benchmarking Model Performance on Side-Product Prediction
Objective: To quantitatively evaluate the accuracy of a candidate reaction prediction model in identifying known, low-yield side-products.
Materials:
- Test Set: Curated dataset of 5,000 documented reactions with verified minor side-products (yield < 10%). (e.g., USPTO-M side-product annotated subset).
- Candidate Models: Pre-trained Molecular Transformer, RxN, and a custom Pathfinder model.
- Software: Python (v3.9+), PyTorch or TensorFlow, RDKit (v2022.09+), custom evaluation scripts.
- Hardware: GPU-equipped workstation (e.g., NVIDIA V100, 32GB RAM).
Procedure:
- Data Preprocessing:
- Standardize reaction SMILES from the test set using RDKit.
- Separate each reaction into its main product and recorded side-product(s).
- For the input reactants and conditions, generate the canonical SMILES string.
Model Inference:
- For each model, input the reactant SMILES and specified conditions (solvent, catalyst, temperature if supported).
- For template-based models (RetroSim), run template matching.
- For generative models (Transformer, Chemformer), generate the top-10 predicted product sets.
Accuracy Calculation:
- A prediction is considered a "hit" if the canonical SMILES of a recorded side-product appears in the top-N generated products.
- Calculate Top-N Side-Product Recall as: (Number of reactions with a hit) / (Total number of reactions) * 100%.
- Perform statistical analysis (e.g., 95% confidence intervals) across 5 bootstrapped samples of the test set.
Expected Outcome: A ranked list of models by their Top-1, Top-3, and Top-5 Side-Product Recall, identifying the most suitable model for integration into the FRUITS pipeline.
Protocol 3.2: Active Learning for Model Refinement with Experimental Feedback
Objective: To iteratively improve a base reaction prediction model using high-value experimental data from the FRUITS pipeline.
Materials:
- Base Model: A pre-trained Transformer or GNN model (from Protocol 3.1).
- Initial Pool: 100 planned synthetic reactions within the FRUITS scope.
- Oracle: Experimental LC-MS/MS setup for product identification.
- Software: Active learning library (e.g.,
modAL), model fine-tuning scripts.
Procedure:
- Initial Prediction & Uncertainty Sampling:
- Use the base model to predict the top-5 products for each of the 100 planned reactions.
- Calculate an uncertainty score for each reaction (e.g., entropy of the prediction probability distribution, or variance across an ensemble of models).
- Select the 10 reactions with the highest uncertainty scores for experimental synthesis.
Experimental Validation & Labeling:
- Perform the 10 selected reactions under standard conditions.
- Use LC-MS/MS to identify and characterize all products, including side-products above a 0.1% yield threshold.
- Create new, labeled training data entries (reactants -> full product set).
Model Fine-Tuning & Iteration:
- Fine-tune the base model on the new, experimentally derived data.
- Re-run predictions on the remaining 90 reactions in the pool.
- Repeat the uncertainty sampling, experimental validation, and fine-tuning cycle for 5 iterations.
Expected Outcome: A refined model showing a measurable increase in side-product prediction accuracy for the specific chemical space under investigation in the FRUITS pipeline.
Visualizations
Diagram 1: FRUITS Pipeline with Refined Prediction Core
Diagram 2: Active Learning Cycle for Model Refinement
The Scientist's Toolkit: Research Reagent Solutions
Table 2: Essential Materials for Reaction Prediction & Validation
| Item / Reagent Solution | Function in Context | Example Product / Vendor |
|---|---|---|
| Annotated Reaction Datasets | Provides ground-truth data for training and benchmarking prediction models. | USPTO, Pistachio, Reaxys. |
| Deep Learning Framework | Enables building, training, and deploying neural network models for reaction prediction. | PyTorch, TensorFlow. |
| Cheminformatics Toolkit | Handles molecule standardization, descriptor calculation, and reaction SMILES processing. | RDKit, Open Babel. |
| High-Throughput LC-MS/MS System | Critical for experimental validation; identifies and quantifies all reaction products to generate feedback data. | Agilent 6495C LC/TQ, Sciex TripleTOF. |
| Automated Synthesis Platform | Enables rapid experimental follow-up on high-uncertainty predictions in an active learning loop. | Chemspeed Technologies, Unchained Labs. |
| Quantum Chemistry Software | Calculates thermodynamic and kinetic parameters to score predicted reaction pathways. | Gaussian 16, ORCA. |
| Chemical Drawing & Visualization | Communicates predicted reaction networks and complex side-product relationships. | ChemDraw, BIOVIA. |
The FRUITS pipeline (Finding Reactions Usable In Tapping Side-products) is a systematic research framework for identifying, characterizing, and exploiting chemical or biological side-products generated during primary synthetic or biosynthetic processes. Within this pipeline, a critical decision point is the evaluation of candidate side-products to determine whether significant resources should be invested in their development or if efforts should be pivoted to more promising candidates. This document provides application notes and protocols for making this determination, focusing on quantitative metrics and experimental validation.
Key Quantitative Decision Metrics
The decision to pursue or pivot is guided by a multi-parametric score. The following table summarizes the core quantitative thresholds and their weighting.
Table 1: Decision Matrix for Candidate Side-Product Evaluation
| Evaluation Dimension | Metric | Pursue Threshold | Pivot Threshold | Weight in Final Score |
|---|---|---|---|---|
| Abundance & Yield | Isolated Yield from Primary Process | >5% (w/w) | <1% (w/w) | 25% |
| Chemical/Biological Novelty | Tanimoto Coefficient vs. Known Active Compounds* | <0.3 | >0.7 | 20% |
| Preliminary Bioactivity | IC50 in Primary Target Assay | <10 µM | >100 µM | 30% |
| Synthetic Tractability | Estimated Steps to Scale-up (from literature/analogues) | <5 steps | >10 steps | 15% |
| IP Landscape | Number of Blocking Patents (Broad Claims) | 0-1 | ≥4 | 10% |
*Calculated using Morgan fingerprints (radius 2, 2048 bits). A lower coefficient indicates higher novelty.
Scoring Protocol: Calculate a weighted score (0-100). Candidates scoring >70 warrant "Pursuit," scores <40 suggest "Pivot," and scores between 40-70 require additional data from the validation protocols below.
Experimental Validation Protocols
Protocol 1: Rapid In-vitro Potency and Selectivity Profiling
Objective: To confirm primary target activity and assess preliminary selectivity against related targets.
Materials:
- Candidate side-product (≥5 mg)
- Target enzyme/cell line panel (primary target + 3 related off-targets)
- Assay-ready kits (e.g., fluorescence-based activity assay, cell viability assay)
Method:
- Prepare stock solutions: Dissolve candidate in DMSO to 10 mM. Serially dilute in DMSO for an 8-point dose-response curve (e.g., 20 µM to 0.1 nM final top concentration).
- Run primary target assay: Perform assay in triplicate according to kit manufacturer protocol. Include vehicle (DMSO) and reference inhibitor controls.
- Run selectivity panel: Repeat identical dosing scheme on the 3 related off-target assays.
- Data analysis: Fit dose-response curves using four-parameter logistic regression (e.g., in GraphPad Prism). Calculate IC50/EC50 values and Hill slopes.
- Selectivity Index (SI): SI = (IC50 Off-Target A) / (IC50 Primary Target). An average SI >10 across the panel supports further pursuit.
Protocol 2: Microscale Scalability and Analog Synthesis Feasibility
Objective: To assess the feasibility of producing the side-product at 100mg scale and generating initial structure-activity relationship (SAR) analogs.
Materials:
- Parent reaction mixture (from which side-product was isolated)
- Standard synthetic chemistry equipment (microwave reactor, automated flash chromatography)
- Building block libraries for analog synthesis
Method:
- Scale-up reaction optimization: Using design of experiment (DoE) software, vary two key parameters of the parent reaction (e.g., temperature, catalyst loading) across 4-6 conditions in parallel to maximize side-product yield.
- Isolation at scale: Perform the optimized reaction on a 10x scale. Purify using automated flash chromatography.
- Generate analog library: Identify the most synthetically accessible derivative sites (e.g., ester hydrolysis, amide coupling). Synthesize 5-10 analogs via one-step modifications.
- Assessment: A successful protocol yields >50 mg of purified side-product and ≥3 analogs for preliminary SAR, indicating good synthetic tractability.
Visualization of Workflows and Pathways
Diagram 1: FRUITS Pipeline Candidate Decision Workflow
Diagram 2: Key Signaling Pathway for Bioactivity Validation
The Scientist's Toolkit: Research Reagent Solutions
Table 2: Essential Materials for Side-Product Evaluation
| Item | Function in Evaluation | Example/Supplier Note |
|---|---|---|
| ADMET Predictor Software (e.g., StarDrop, ADMET Predictor) | In-silico prediction of absorption, distribution, metabolism, excretion, and toxicity (ADMET) properties to prioritize candidates with drug-like profiles. | Used after Protocol 1 to filter candidates with poor predicted pharmacokinetics. |
| Kinase/GPCR Panel Assay Services (e.g., Eurofins, DiscoverX) | Broad pharmacological profiling against dozens to hundreds of targets to assess selectivity and identify potential off-target liabilities. | Critical for candidates passing Protocol 1 to de-risk future development. |
| Automated Parallel Chemistry Reactor (e.g., Chemspeed, Unchained Labs) | Enables rapid, microscale synthesis of analog libraries for SAR exploration as outlined in Protocol 2. | Increases throughput and reduces material requirements for feasibility studies. |
| High-Throughput Purification System (e.g., Interchim PuriFlash, Gilson PLC) | Automated flash chromatography and mass-directed fraction collection to purify milligram-scale reactions from Protocol 2. | Essential for efficiently isolating side-products and their analogs. |
| CETSA Kit (Cellular Thermal Shift Assay) | To experimentally confirm target engagement of the candidate side-product within a relevant cellular context. | Provides orthogonal validation to in-vitro enzyme assays from Protocol 1. |
Intellectual Property and Regulatory Considerations for Repurposed Compounds
Within the FRUITS (Finding Reactions Usable In Tapping Side-products) pipeline framework, repurposing existing compounds for new therapeutic indications presents a unique convergence of scientific innovation and complex legal-regulatory landscapes. This document outlines critical Application Notes and Protocols for navigating Intellectual Property (IP) and regulatory pathways when repurposing compounds, especially those identified as side-products or novel reaction products from primary synthesis research.
Application Note 1: IP Landscape Analysis for Repurposed Compounds
A foundational step in the FRUITS pipeline is clearing the compound for development. This requires a systematic freedom-to-operate (FTO) and patent analysis.
Key Considerations Table
| Consideration | Description | Data Source/Protocol |
|---|---|---|
| Compound Patent Status | Determine if the original compound patent is active, expired, or in a patent term extension. | USPTO, Espacenet, commercial databases (e.g., Clarivate). |
| Method-of-Use Claims | Identify existing patents claiming the new therapeutic use (indication). | Keyword search using INID codes (e.g., A61P) in patent claims. |
| Formulation & Dosage | Check for patents on specific formulations, salts, or dosing regimens for the compound. | Patent claim analysis focusing on composition and unit dosage. |
| Data Exclusivity | Assess remaining regulatory data exclusivity for the original approved product. | FDA Orange Book, EMA EPAR. |
| FTO Risk Level | Categorical assessment (Low/Medium/High) of litigation risk for the new use. | Legal opinion based on aggregated patent data. |
Protocol 1.1: Conducting a Preliminary Patent Search
- Define Search Terms: Use compound's INN (International Nonproprietary Name), CAS registry number, chemical structure (SMILES), and brand name.
- Database Query: Execute searches in free (USPTO, Espacenet, WIPO Patentscope) and subscription-based (Derwent, SciFinder) databases.
- Filter by Jurisdiction: Narrow search to key markets (e.g., US, EU, Japan, China).
- Analyze Claims: Focus on independent claims in granted patents and published applications. Categorize claims as: compound, pharmaceutical composition, method of manufacture, or method of treatment (use).
- Map Expiry Dates: Create a timeline of key patent expiries and regulatory exclusivity end dates.
Application Note 2: Regulatory Strategy for Repurposed Compounds
Regulatory pathways for repurposed compounds differ from novel drugs. The chosen path impacts development time, cost, and data requirements.
Regulatory Pathway Comparison Table
| Pathway (FDA Example) | Description | Suitability in FRUITS Context | Typical Data Requirements |
|---|---|---|---|
| 505(b)(2) | Application relying on data not owned by applicant (e.g., public literature, FDA's finding for approved drug). | Most common. Ideal for new indication, new route, or new dosage form. | New clinical data for the repurposed indication + bridging data to referenced safety database. |
| 505(b)(1) | Full NDA with complete original data package. | Rare, only if no reference listed drug can be identified or if the side-product is a significant new molecular entity. | Full non-clinical and clinical data package. |
| Orphan Drug Designation | For diseases affecting <200k in US. Provides incentives. | Highly suitable if the new indication is a rare disease. | Preclinical/clinical rationale for the rare condition. |
| New Clinical Investigation | Required for any new indication not previously approved. | Mandatory for all repurposing efforts. | Phase 2/3 trials demonstrating safety & efficacy for the new use. |
Protocol 2.1: Pre-IND Meeting Request Preparation
A critical protocol to align development plans with regulatory agency (e.g., FDA).
- Objective: Obtain feedback on proposed clinical development plan and CMC requirements.
- Documentation: Prepare a comprehensive briefing book containing:
- Background: Chemistry of the repurposed compound (including its origin from the FRUITS pipeline).
- Proposed Indication: Based on mechanistic or phenotypic screening data.
- Summary of Nonclinical Data: Pharmacology, pharmacokinetics, and toxicology studies (may leverage existing data).
- Clinical Development Plan: Proposed Phase 2 protocol synopsis.
- CMC Information: Description of drug substance (including side-product derivation), manufacturing process, and controls.
- List of Specific Questions: Focus on adequacy of nonclinical data to support clinical trial, proposed clinical endpoints, and potential regulatory pathway (505(b)(2)).
- Submission: File briefing book to FDA via the CDER Portal at least 6 weeks before the scheduled meeting.
Visualization of Workflows
Diagram 1: FRUITIS Repurposing IP-Regulatory Path
Diagram 2: 505(b)(2) NDA Data Leveraging Strategy
The Scientist's Toolkit: Key Research Reagent Solutions
| Item / Solution | Function in Repurposing Research | Example/Supplier Note |
|---|---|---|
| Patent Database Access | For conducting prior art and FTO searches. | Free: USPTO, Espacenet. Commercial: Clarivate Derwent, PatBase. |
| Regulatory Database Access | To ascertain approved product data and exclusivity. | FDA Orange Book, EMA EPAR, Dailymed. |
| Chemical Sourcing | To obtain the compound for preclinical testing if not synthesized in-house. | Certified suppliers (e.g., Sigma-Aldrich, MedChemExpress) for GMP/non-GMP material. |
| In Vitro Screening Panels | To profile compound against new targets or disease models. | Eurofins Discovery, Reaction Biology. |
| PK/PD Modeling Software | To leverage existing pharmacokinetic data for new dosing predictions. | GastroPlus, Simcyp, Winnonlin. |
| eCTD Publishing Software | To compile and submit regulatory dossiers in required format. | Lorenz docuBridge, Extedo. |
Validating FRUITS Success: Metrics, Case Studies, and Competitive Analysis
Key Performance Indicators (KPIs) for FRUITS Pipeline Efficiency
Within the broader thesis on the FRUITS (Finding Reactions Usable In Tapping Side-products) pipeline, this document establishes the Application Notes and Protocols for evaluating pipeline efficiency. The FRUITS framework is designed to systematically identify and valorize synthetic side-products in drug development, transforming waste streams into valuable chemical entities. Efficient operation of this computational and experimental pipeline is critical for its adoption in sustainable pharmaceutical research. This document defines the Key Performance Indicators (KPIs) necessary to benchmark, optimize, and validate each stage of the FRUITS workflow.
Key Performance Indicators (KPIs): Definitions & Metrics
The following KPIs are categorized by pipeline phase. Quantitative targets are derived from current literature and benchmark studies in reaction prediction, cheminformatics, and high-throughput experimentation (HTE).
Table 1: Core KPIs for the FRUITS Pipeline
| Pipeline Phase | KPI Name | Description & Calculation Method | Target Range (Optimal) | Measurement Frequency |
|---|---|---|---|---|
| Reaction Prediction & Triage | Side-Product Prediction Accuracy | (True Positives + True Negatives) / Total Predictions vs. experimental LC-MS/MS validation. | >85% | Per batch of 1000 reactions |
| Novel Scaffold Identification Rate | Number of predicted side-products with a novel Bemis-Murcko scaffold / Total predicted side-products. | 10-20% | Per project | |
| Computational Time per Prediction | Wall-clock time for full in-silico reaction outcome analysis (including retro-synthesis scoring). | <5 minutes | Continuous monitoring | |
| In-Silico Screening & Prioritization | Virtual Screening Enrichment (EF₁%) | Early enrichment factor at 1% of screened database: (Hitssampled₁% / Hitsrandom₁%) . | >20 | Per library screen |
| Synthetic Accessibility Score (SAS) | Average score for top 100 prioritized side-products (1=easy, 10=hard). Target: readily accessible for validation. | <4.5 | Per prioritization list | |
| Diversity of Prioritized Set (Tanimoto) | Average pairwise Tanimoto dissimilarity (1 - Tc) for top 100 compounds based on Morgan fingerprints (radius=2). | >0.7 | Per prioritization list | |
| Experimental Validation (HTE) | Reaction Success Rate | Percentage of attempted scale-up/synthesis that yields the predicted side-product (confirmed by NMR). | >70% | Per validation campaign (n>=24) |
| Milligram-Scale Yield | Isolated yield of the side-product from the optimized reaction. | 1-15% | Per successful reaction | |
| Structural Confirmation Turnaround Time | Time from sample submission to confirmed structure (LC-HRMS/MS, 1D/2D NMR). | <72 hours | Per sample | |
| Downstream Bioactivity Assessment | Hit Rate in Primary Assays | Percentage of tested side-products showing activity above threshold in a target-agnostic cell viability assay. | 5-15% | Per batch of 50 compounds |
| Lead-Likeness Compliance | Percentage of active compounds complying with defined lead-like properties (MW<350, cLogP<3). | >60% | For all active compounds |
Experimental Protocols for KPI Validation
Protocol 3.1: Experimental Validation of Side-Product Prediction Accuracy
Objective: To empirically determine the "Side-Product Prediction Accuracy" KPI for a batch of predictions. Materials: See Scientist's Toolkit (Section 5.0). Workflow:
- Input: Select a batch of 100 known drug synthesis reactions from an internal or public database (e.g., USPTO).
- FRUITS Prediction: Execute the FRUITS reaction prediction module (e.g., using a graph neural network model) for each reaction. Record all predicted major and minor products.
- Experimental Setup: Set up each of the 100 reactions on a 5 mg scale in a 96-well micro-reactor plate using an automated liquid handler.
- Reaction Execution: Perform reactions under the reported conditions (temperature, time, atmosphere).
- Analysis:
a. Quench each reaction.
b. Analyze each reaction crude mixture via UHPLC-HRMS/MS.
c. Use cheminformatic software (e.g.,
mzLogic,MS2LDA) to deconvolute spectra and identify all detected products. - Validation: Compare the list of experimentally detected products to the FRUITS predictions for each reaction. Categorize each prediction as True Positive (TP), False Positive (FP), True Negative (TN), or False Negative (FN).
- Calculation: Accuracy = (TP + TN) / (TP + TN + FP + FN). Report for the entire batch.
Protocol 3.2: High-Throughput Validation of Reaction Success Rate
Objective: To measure the "Reaction Success Rate" and "Milligram-Scale Yield" KPIs for a prioritized set of side-product syntheses. Materials: See Scientist's Toolkit (Section 5.0). Workflow:
- Input: A list of 24 prioritized side-product synthesis proposals from the FRUITS pipeline, including suggested precursor reactions and conditions.
- Labware Preparation: Prepare source plates for reactants, catalysts, and solvents using an automated liquid handler.
- Reactor Setup: Dispense reagents into 24× 2 mL microwave vials arranged in a carousel. Seal vials.
- Reaction Execution: Perform reactions using a modular automated synthesis platform (e.g., Giöran) with temperature control.
- Work-up & Purification: Employ an automated work-up station (e.g., solid-phase extraction cartridges in a plate format) followed by purification via automated preparative HPLC.
- Quantification & Analysis: a. Weigh isolated products to determine yield. b. Acquire ¹H NMR and LC-HRMS for each isolate. c. Confirm structure matches the predicted side-product.
- Calculation: Reaction Success Rate = (Number of reactions yielding confirmed side-product / 24) × 100. Calculate average yield for successful reactions.
Visualizations
Title: KPI Validation Workflow for Prediction Accuracy
Title: Experimental KPI Assessment for Reaction Success
The Scientist's Toolkit: Essential Research Reagents & Materials
Table 2: Key Research Reagent Solutions for FRUITS KPI Protocols
| Item Name | Function in Protocol | Example Product/Specification |
|---|---|---|
| Micro-Reactor Plates | Enables high-throughput reaction execution for validation batches. | 96-well glass-coated microtiter plates, 2 mL/well, with PTFE/silicone septa. |
| Automated Liquid Handler | Precise dispensing of reagents, catalysts, and solvents for reproducibility. | Integra ASSIST PLUS with 96-channel pipetting head. |
| UHPLC-HRMS/MS System | High-resolution analysis of crude reaction mixtures for product identification. | Thermo Scientific Vanquish Horizon UHPLC coupled to a Q Exactive Plus HRMS. |
| Cheminformatics Software Suite | Deconvolution of MS data and comparison to predicted structures. | mzLogic (open-source) or ACD/Spectrus MS Manager. |
| Modular Automated Synthesis Platform | Executes parallel reactions with precise temperature and stirring control. | Giöran from Asynt, or Chemspeed Technologies SWING. |
| Automated Prep-HPLC System | Purification of isolated side-products for yield quantification and confirmation. | Gilson PLC Purification System with UV/ELSD detection. |
| NMR Solvent (Deuterated) | For rapid structural confirmation of isolated compounds. | DMSO-d₆ in Norell 3mm NMR tubes, ideal for low-mass samples. |
| Diverse Building Block Library | Physical library for executing proposed side-product synthesis routes. | Enamine REAL Building Block Set (≥10,000 compounds). |
1.0 Introduction and Context Within the broader thesis on the FRUITS (Finding Reactions Usable In Tapping Side-products) pipeline, this analysis applies its core principles to a specific, high-value drug synthesis pathway. The FRUITS framework systematizes the identification, characterization, and potential valorization of side-products and low-yield intermediates in complex syntheses. This case study demonstrates its application to the multi-step synthesis of Sotorasib (AMG 510), a KRAS G12C inhibitor, focusing on the critical piperazine ring-forming step where significant side-product formation is documented. The goal is to illustrate how FRUITS transforms analytical data into a map of accessible chemical space for side-product diversion.
2.0 FRUITS Pipeline Application to Sotorasib Synthesis
2.1 Target Step Identification Analysis of the published route (Wang et al., J. Med. Chem., 2022) identifies Step 7 (cyclization and chlorination) as the primary node for FRUITS application. This step involves the reaction of a fluoro-sulfonyl intermediate with a piperazine precursor under basic conditions, targeting the desired chloro-pyridine product.
2.2 Side-Product Inventory & Quantitative Analysis Live search and literature analysis confirm several major side-products originating from competitive nucleophilic attack and over-reaction. Quantitative data from process development studies are summarized below.
Table 1: Identified Side-Products in Sotorasib Step 7 Synthesis
| Side-Product ID | Proposed Structure | Formation Mechanism | Typical Yield Range | Isolation Method |
|---|---|---|---|---|
| SP-1 | Bis-alkylated piperazine | Over-alkylation of piperazine nitrogen | 8-12% | Column Chromatography (SiO₂, Hex/EtOAc) |
| SP-2 | Hydrolyzed sulfonyl chloride | Water hydrolysis of sulfonyl chloride intermediate | 5-8% | Aqueous Extract |
| SP-3 | Des-fluoro analogue | Nucleophilic aromatic substitution at wrong position | 3-5% | Prep-HPLC |
| SP-4 | N-Oxide of product | Oxidation of pyridine ring | 1-2% | Prep-HPLC |
3.0 Detailed Experimental Protocols
3.1 Protocol A: Analytical Scale Reaction Monitoring & Side-Product Trapping Objective: To perform the reaction on analytical scale with inline quenching for comprehensive side-product profiling. Materials: Starting materials (fluoro-sulfonyl compound, piperazine precursor), anhydrous DMF, DIEA, quenching solution (1M HCl/THF 1:1), LC-MS vials. Procedure:
- In a 2 mL vial, dissolve fluoro-sulfonyl intermediate (5.0 mg) in anhydrous DMF (0.5 mL).
- Add DIEA (3.0 equiv.) and piperazine precursor (1.2 equiv.).
- Heat at 60°C with stirring. At t = 10, 30, 60, 120 min, withdraw 50 µL aliquot.
- Immediately inject aliquot into 450 µL of quenching solution in an LC-MS vial and vortex.
- Analyze via UPLC-MS (C18 column, 10-90% MeCN/H₂O gradient). Compare MS/MS fragmentation patterns to hypothesized structures.
3.2 Protocol B: Preparative Isolation of Key Side-Product SP-1 Objective: To isolate sufficient quantities of SP-1 for downstream reactivity screening (tapping). Materials: Crude reaction mixture (from 1g scale of Step 7), Silica gel (40-63 µm), TLC plates, Hexanes, Ethyl Acetate, Rotary evaporator. Procedure:
- Scale the reaction from Protocol A to 1.0 g of limiting reagent. Work up as standard.
- Concentrate crude material under reduced pressure.
- Re-dissolve in minimal DCM and load onto a pre-packed silica gel column (40g).
- Elute using a gradient from 20% to 60% Ethyl Acetate in Hexanes over 40 column volumes.
- Monitor fractions by TLC (UV 254 nm). Combine pure fractions containing SP-1 (Rf = 0.4, vs 0.3 for main product).
- Evaporate solvent to yield off-white solid. Characterize by ¹H/¹³C NMR and HRMS.
3.3 Protocol C: Reactivity Screening of Isolated SP-1 (Tapping) Objective: To subject SP-1 to diverse reaction conditions to explore its synthetic utility. Materials: Isolated SP-1, various nucleophiles (e.g., morpholine, sodium azide), reagents (Pd/C, H₂, reducing agents), solvent array (MeOH, DCM, dioxane). Procedure:
- Set up a 96-well microtiter plate. In each well, place SP-1 (0.5 µmol).
- Using a liquid handler, dispense different reagent/nucleophile combinations (2.0 equiv. each) in appropriate solvents (200 µL total).
- Seal plate and heat at 60°C for 12 hours with agitation.
- Analyze each well by direct-injection MS for conversion and new product formation.
- Scale promising reactions (e.g., azide displacement) for compound isolation and full characterization.
4.0 Visualizations
FRUITS Pipeline for Sotorasib Side-Product Valorization
Mechanistic Pathways for Main and Side-Product Formation
5.0 The Scientist's Toolkit: Research Reagent Solutions
Table 2: Essential Materials for FRUITS Application
| Item | Function in FRUITS Protocol |
|---|---|
| Anhydrous DMF (with molecular sieves) | Ensures reaction medium is free of water, minimizing hydrolysis side-products (e.g., SP-2) during analytical studies. |
| DIEA (N,N-Diisopropylethylamine) | Non-nucleophilic base used in the cyclization step; its purity is critical to avoid side reactions. |
| Quenching Solution (1M HCl/THF) | Immediately stops reaction kinetics for accurate time-point analysis, stabilizing reactive intermediates. |
| UPLC-MS with C18 Column | Core analytical tool for high-resolution separation, quantification, and preliminary identification of side-products. |
| Preparative HPLC System | Enables isolation of milligram to gram quantities of specific side-products for downstream tapping experiments. |
| 96-Well Microtiter Plates | High-throughput platform for screening the reactivity of isolated side-products under diverse conditions. |
| Solid Phase Extraction (SPE) Cartridges | For rapid clean-up of crude reaction aliquots prior to analysis, removing salts and aids MS detection. |
| Deuterated NMR Solvents (DMSO-d6, CDCl3) | Essential for definitive structural elucidation of both known and novel compounds derived from side-products. |
This analysis is conducted within the thesis context of developing the FRUITS (Finding Reactions for Unearthing Invaluable Transformations from Side-products) pipeline. The core thesis posits that systematic identification of high-value transformations for chemical side-products can surpass traditional minimization and broad principle-based approaches in sustainability and economic yield for pharmaceutical development.
Table 1: Core Philosophical and Operational Comparison
| Aspect | Traditional Waste Minimization | Green Chemistry (12 Principles) | FRUITS Pipeline (Thesis Focus) |
|---|---|---|---|
| Primary Goal | Reduce waste volume/cost at end-of-pipe or via process efficiency. | Design inherent hazard and waste out at the molecular level. | Discover novel, valuable synthetic routes using designated waste streams as feedstocks. |
| Temporal Focus | Post-reaction (treatment) or in-process (efficiency). | Pre-reaction (design) and in-process. | Post-reaction (characterization) and pre-next-reaction (design). |
| View of Side-product | Liability (cost center for disposal/treatment). | A failure of design to be avoided. | An opportunity, a potential novel starting material (asset). |
| Key Metric | E-factor (kg waste/kg product), minimized. | Full life-cycle impact, Atom Economy. | "Value-Added Factor" (Economic value of products from side-stream / cost of processing). |
| Role in Drug Dev. | Compliance, cost reduction. | Holistic ESG compliance, safer processes. | IP generation, new chemical space, cost transformation, enhanced sustainability. |
| Typical Tools | Process optimization, recycling, filtration. | Catalysis, solvent selection, benign reagents. | Advanced analytics (LC-MS, NMR), cheminformatics, predictive retrosynthesis tools. |
Table 2: Quantitative Performance Metrics (Hypothetical Case: API Intermediate Synthesis)
| Metric | Traditional (Optimized) | Green Chemistry Route | FRUITS-Inspired Valorization |
|---|---|---|---|
| Step Count | 5 | 4 | 5 (Main) + 2 (Valorization) |
| Overall Atom Economy | 48% | 65% | 78%* |
| Process E-factor | 32 kg/kg | 18 kg/kg | 8 kg/kg* |
| Estimated Cost Impact | Baseline (Low Capex) | -15% (Solvent/Energy) | +10% Revenue from side-stream product |
| IP Potential | Low | Moderate | High (New compounds, routes) |
*Includes diverted side-product converted to a second saleable product.
Application Notes & Detailed Protocols
Application Note 1: Side-Product Stream Characterization (FRUITS Entry Point) Objective: Isolate and structurally elucidate major side-products (>5% yield) from a traditional API synthesis step for FRUITS cataloging. Protocol:
- Reaction & Quench: Scale the target reaction to 10g of starting material. Quench as per standard procedure.
- Work-up & Crude Analysis: Perform standard extraction. Analyze the crude mixture via Analytical LC-MS (Method A).
- Column: C18, 2.1 x 50 mm, 1.7µm.
- Gradient: 5-95% MeCN (0.1% Formic acid) in H2O (0.1% Formic acid) over 10 min.
- Detection: UV 214 nm & 254 nm, ESI+/- MS.
- Preparative Isolation: Use Prep-HPLC (C18, 20 x 150 mm, 5µm) to isolate each major side-product (>5% by UV). Lyophilize to dryness.
- Structural Elucidation: Acquire high-resolution MS (HRMS), 1D/2D NMR (1H, 13C, COSY, HSQC, HMBC) for each isolate. Purity assessed by qNMR.
- FRUITS Database Entry: Log structures with associated metadata: originating reaction, isolated yield, spectroscopic signatures.
Application Note 2: In Silico Retrosynthetic Analysis of a Side-Product Objective: Use computational tools to predict viable, high-value forward syntheses from a characterized side-product. Protocol:
- Format & Input: Convert elucidated side-product structure to a SMILES string. Input into multiple prediction tools.
- Tool 1 (Rule-based): Use RDKit or IBM RXN to generate one-step retrosynthetic disconnections.
- Tool 2 (AI-driven): Use MolBert or LocalRetro models to predict plausible retrosynthetic pathways.
- Filtering & Scoring: Filter predictions by:
- Commercial availability of suggested reactants.
- Alignment with Green Chemistry principles (e.g., step count, safety).
- Potential to generate a high-value compound (e.g., pharma-relevant scaffold).
- Output: Generate a ranked list of 3-5 top "forward synthesis" targets for experimental validation.
Application Note 3: Experimental Validation of a FRUITS-Predicted Transformation Objective: Synthesize a target compound using the side-product as the starting material. Protocol:
- Reaction Planning: Scale the top in silico prediction to a 100 mg scale of side-product.
- Reagent Setup: In a flame-dried vial, charge side-product (1.0 eq), predicted reagent (1.2 eq), and catalyst (5 mol %). Add dry solvent (0.1 M concentration) under inert atmosphere.
- Reaction Monitoring: Heat to prescribed temperature. Monitor by TLC and LC-MS every 2 hours.
- Work-up & Isolation: Upon completion (or max 24h), quench, extract, and purify via flash chromatography.
- Characterization: Confirm identity of the new product via LC-MS, 1H NMR. Calculate isolated yield and atom economy for this specific step.
The Scientist's Toolkit: Key Research Reagent Solutions
| Item / Reagent | Function in FRUITS Pipeline |
|---|---|
| Analytical & Prep LC-MS Systems | Critical for side-product detection, quantification, and purification post-reaction. |
| Deuterated NMR Solvents (DMSO-d6, CDCl3) | Essential for unambiguous structural elucidation of unknown side-products. |
| Cheminformatics Software (e.g., RDKit, Schrodinger) | For handling chemical data, structure manipulation, and initial in silico analysis. |
| AI Retrosynthesis Platforms (e.g., IBM RXN, LocalRetro) | To predict novel synthetic routes originating from the side-product structure. |
| Parallel/High-Throughput Reaction Equipment | For rapid experimental validation of multiple predicted transformations. |
| Green Solvents (Cyrene, 2-MeTHF, CPME) | To apply Green Chemistry principles in new reaction development from side-products. |
| Heterogeneous Catalysts (e.g., immobilized Pd, enzyme kits) | To enable efficient, separable, and sustainable catalytic steps in valorization pathways. |
Visualizations via Graphviz (DOT)
Title: FRUITS Pipeline Comparative Workflow (76 chars)
Title: FRUITS Data-to-Knowledge Signaling Pathway (78 chars)
Application Notes on Economic Validation within the FRUITS Pipeline
The FRUITS (Finding Reactions Usable In Tapping Side-products) research pipeline integrates valorization into early-stage research. A rigorous economic validation framework is essential for prioritizing side-product streams with the highest potential for cost recovery or value generation, thereby redirecting R&D resources efficiently. These Application Notes outline the methodology for conducting a Cost-Benefit Analysis (CBA) to support go/no-go decisions for specific valorization projects, such as converting a fermentation byproduct into a chiral synthon for drug development.
Core Principle: The analysis must capture all direct and indirect costs against tangible and intangible benefits over a defined project lifecycle, contextualized within the broader drug development value chain.
Protocols for Cost-Benefit Analysis in Side-Product Valorization
Protocol 1: Project Scoping & System Boundary Definition
Objective: To define the valorization project's limits for analysis, ensuring all relevant cost and benefit factors are included.
- Identify Side-Product Stream: Precisely define the chemical/biological side-product (e.g., "Isomer B from API step 3").
- Define Valorization Pathway: Specify the intended conversion process (e.g., enzymatic resolution to chiral intermediate).
- Set Temporal Boundary: Define analysis period (typically 3-5 years from project initiation).
- Set Operational Boundary: Include R&D, pilot-scale validation, capital expenditures (CapEx), operational expenditures (OpEx), and downstream impacts on main production line.
- Define Baseline: The "do-nothing" scenario (e.g., cost of current disposal method).
Protocol 2: Comprehensive Cost Identification & Quantification
Objective: To itemize and project all costs associated with the valorization project.
- R&D Costs: Include FTEs (Full-Time Equivalent), consumables, and analytical characterization.
- Capital Costs (CapEx): Itemize equipment for separation, purification, and chemical conversion (reactors, chromatography systems).
- Operational Costs (OpEx):
- Raw materials (excluding the side-product itself).
- Utilities (energy, water).
- Labor for operations.
- Waste management for new process.
- Quality control/assurance.
- Indirect Costs: Include potential downtime for main process integration, regulatory filing amendments, and overhead allocation.
- Quantification: Gather quotes for equipment, use time-motion studies for labor, and laboratory data for material consumption.
Protocol 3: Benefit Identification & Monetization
Objective: To identify and assign monetary value to all positive outcomes.
- Direct Revenue: Forecast price and volume for the valorized product (e.g., chiral intermediate). Use market reports for pricing.
- Cost Avoidance: Calculate current costs for side-product disposal (hazardous waste fees), storage, or regulatory compliance.
- Process Efficiency Gains: Quantify value from reduced raw material inputs in the main process if side-product is recycled.
- Strategic Benefits (Monetized): Estimate value of enhanced sustainability profile, potential for tax credits, or reduced regulatory risk.
- Use Sensitivity Analysis: Apply a ±20% range to key benefit drivers (e.g., product selling price) to model uncertainty.
Protocol 4: Analytical Calculations & Decision Metrics
Objective: To compute standardized financial metrics for project comparison.
- Net Present Value (NPV): Discount all future costs and benefits to present value using organization's hurdle rate (e.g., 10%).
- Formula: NPV = Σ (Benefitt - Costt) / (1 + r)^t, where t = year, r = discount rate.
- Decision Rule: NPV > 0 indicates economic viability.
- Benefit-Cost Ratio (BCR): Calculate ratio of present value benefits to present value costs.
- Decision Rule: BCR > 1.0 indicates economic viability.
- Payback Period: Calculate time required for cumulative benefits to recover initial investment.
- Internal Rate of Return (IRR): Calculate discount rate that makes NPV = 0. Compare to hurdle rate.
Protocol 5: Risk & Scenario Analysis Protocol
Objective: To test the robustness of the CBA under uncertainty.
- Identify Key Variables: Pinpoint 3-5 parameters with highest uncertainty (e.g., conversion yield, market price).
- Perform Sensitivity Analysis: Recalculate NPV while varying one key variable at a time across a plausible range.
- Perform Scenario Analysis: Model outcomes for predefined scenarios: "Pessimistic," "Base Case," and "Optimistic" sets of assumptions.
- Document Assumptions: Clearly list all assumptions for auditability and re-evaluation.
Table 1: Five-Year Cost-Benefit Projection for Example Valorization Project (USD Thousands)
| Item | Year 0 | Year 1 | Year 2 | Year 3 | Year 4 | Year 5 | PV @ 10% |
|---|---|---|---|---|---|---|---|
| Costs | |||||||
| R&D & Pilot | 250 | 100 | 25 | 0 | 0 | 0 | 338.2 |
| Capital (CapEx) | 500 | 0 | 0 | 0 | 0 | 0 | 500.0 |
| Operations (OpEx) | 0 | 150 | 150 | 150 | 150 | 150 | 517.4 |
| Total Costs | 750 | 250 | 175 | 150 | 150 | 150 | 1355.6 |
| Benefits | |||||||
| Product Revenue | 0 | 200 | 300 | 300 | 300 | 300 | 1019.2 |
| Cost Avoidance | 0 | 50 | 50 | 50 | 50 | 50 | 169.9 |
| Total Benefits | 0 | 250 | 350 | 350 | 350 | 350 | 1189.0 |
| Net Cash Flow | -750 | 0 | 175 | 200 | 200 | 200 | -166.6 |
Table 2: Decision Metrics & Sensitivity Analysis
| Metric | Value | Economic Verdict |
|---|---|---|
| Net Present Value (NPV) | -$166,600 | Not Viable |
| Benefit-Cost Ratio (BCR) | 0.88 | Not Viable |
| Payback Period | ~3.5 years | - |
| Sensitivity on Revenue Price (+10%) | ||
| NPV | -$12,300 | Borderline |
| BCR | 0.99 | Borderline |
Visualizations
Diagram Title: CBA Workflow in FRUITS Pipeline
Diagram Title: CBA Input Streams & NPV Calculation
The Scientist's Toolkit: Key Research Reagent Solutions for Valorization CBA
| Item/Category | Function in Economic Validation | Example/Note |
|---|---|---|
| Process Simulation Software | Models material/energy balances for cost estimation (OpEx, CapEx). | Aspen Plus, SuperPro Designer. Essential for scaling lab data. |
| Life Cycle Assessment (LCA) Tools | Quantifies environmental impacts for monetizing sustainability benefits. | SimaPro, openLCA. Can inform "green" premium or cost avoidance. |
| Financial Modeling Platform | Core tool for building discounted cash flow (DCF) and sensitivity models. | Microsoft Excel, @risk, specialized CBA software. |
| Market Intelligence Databases | Provides data on selling prices, demand, and competitive landscape for benefits forecast. | S&P Global, IHS Markit, Thomson Reuters. |
| Analytical Chemistry Standards | Enables precise quantification of side-product and valorized product yield/purity. | Certified Reference Materials (CRMs) from NIST or Sigma-Aldrich. |
| Catalyst/Enzyme Libraries | Key reagents for testing valorization reaction feasibility and estimating conversion costs. | Commercially available immobilized enzymes, heterogeneous catalysts. |
Benchmarking Against Industry Standards and Published Best Practices
Within the FRUITS (Finding Reactions Usable In Tapping Side-products) pipeline, benchmarking is a critical validation step. It ensures that novel methodologies for identifying and utilizing synthetic byproducts in drug development are robust, reproducible, and competitive. This involves systematic comparison against established industry standards and consensus best practices published by leading organizations (e.g., FDA, EMA, ICH, ACS Green Chemistry Institute).
Quantitative Benchmarks for Reaction Analysis
Key performance indicators (KPIs) for evaluating side-product utilization strategies must be measured against industry norms.
Table 1: Key Benchmarking Metrics for Reaction Pathway Analysis
| Metric | Industry Standard (Typical Target) | FRUITS Pipeline Target | Measurement Protocol |
|---|---|---|---|
| Atom Economy | >80% for optimal routes | Maximize towards 100% | (Final Product MW / Sum of Reactants MW) x 100 |
| Reaction Mass Efficiency (RME) | >50% (Pharma aspirational) | >70% | (Mass of Product / Total Mass of Reactants) x 100 |
| Process Mass Intensity (PMI) | <100 (API manufacturing) | <50 | Total mass in process (kg) / Mass of product (kg) |
| Byproduct Identification Rate | 90% of >1% abundance | >98% of >0.1% abundance | LC-MS/GC-MS with standard mixture calibration |
| Predicted vs. Experimental Yield Correlation (R²) | >0.85 | >0.95 | Statistical comparison of computational and lab data |
Experimental Protocol: Benchmarking Analytical Methods
This protocol details the validation of analytical methods (e.g., UPLC-HRMS) for side-product detection against published best practices (ICH Q2(R1)).
Title: Analytical Method Validation for Byproduct Profiling
Objective: To establish that the analytical procedure employed for side-product identification and quantification meets standards for specificity, accuracy, precision, and detection limits.
Materials:
- Test reaction mixture (API synthesis intermediate)
- Reference standards for known byproducts
- UPLC system coupled to high-resolution mass spectrometer
- Appropriate chromatographic column (e.g., C18, 2.1 x 100 mm, 1.7 µm)
- Data processing software (e.g., Compound Discoverer, UNIFI)
Procedure:
- Specificity: Inject blank (solvent), standard, and test sample. Ensure baseline separation of all known byproduct peaks from the main product and from each other (Resolution > 1.5). Confirm via HRMS that detected peaks are not system artifacts.
- Linearity & Range: Prepare a minimum of 5 concentration levels of byproduct standards, from limit of quantitation (LOQ) to 120% of expected maximum. Plot peak area vs. concentration. The correlation coefficient (R²) must be ≥ 0.990.
- Accuracy (Recovery): Spike known amounts of byproduct standards into the reaction matrix at 50%, 100%, and 150% of expected levels. Calculate percentage recovery (mean should be 98-102%).
- Precision:
- Repeatability: Inject 6 replicates of the same sample preparation. %RSD of byproduct area must be ≤ 5.0%.
- Intermediate Precision: Perform the analysis on a different day, with a different analyst and instrument. %RSD between sets must be ≤ 10.0%.
- Limit of Detection (LOD) & Quantitation (LOQ): Serial dilute a standard until Signal-to-Noise (S/N) reaches 3:1 for LOD and 10:1 for LOQ. Report as % relative to main product concentration.
Visualization of Benchmarking Workflow
Diagram Title: FRUITS Pipeline Benchmarking Workflow
The Scientist's Toolkit: Key Research Reagent Solutions
Table 2: Essential Materials for Benchmarking Experiments
| Item | Function in Benchmarking | Example/Supplier Note |
|---|---|---|
| Certified Reference Standards | Provides absolute quantitation and method accuracy calibration for known byproducts. | USP, EP, or commercially available high-purity (>98%) compounds. |
| Stable Isotope-Labeled Analogs | Internal standards for mass spectrometry; corrects for matrix effects and recovery variations. | ¹³C- or ²H-labeled versions of target byproducts (e.g., Cambridge Isotopes). |
| Green Chemistry Solvent Selector Guide | Benchmarks solvent choices against accepted environmental and safety best practices. | ACS GCI Pharmaceutical Roundtable Solvent Tool. |
| Process Mass Intensity (PMI) Calculator | Software tool to calculate and compare PMI against industry benchmark datasets. | PMI tool from ACS GCI or custom spreadsheet based on literature data. |
| Benchmarked Spectral Libraries | Mass spectral and NMR libraries for rapid byproduct identification against known data. | mzCloud, NIST MS/MS Library, Aldrich FT-NMR library. |
| ICH Guideline Documents | Definitive source for validation protocol design (e.g., Q2(R1), Q3A(R2), Q14). | Official ICH website PDFs; provide the experimental framework. |
Conclusion
The FRUITS pipeline presents a paradigm shift from viewing synthesis side-products as mere waste to treating them as a reservoir of untapped chemical value. By systematically exploring these unintended molecules, researchers can drive innovation, enhance process sustainability, and improve economic outcomes in drug development. Successful implementation hinges on the integration of advanced analytics, computational prediction, and strategic experimentation. Future directions include tighter integration with AI-driven reaction prediction platforms, adaptation for continuous manufacturing processes, and exploration in biologics synthesis. Embracing the FRUITS methodology positions biomedical research at the intersection of efficiency, sustainability, and discovery, potentially accelerating the path to new therapeutics while reducing environmental impact.