PCR Bias in 16S rRNA Sequencing: Overcoming Amplification Challenges for Accurate Marinisomatota Detection
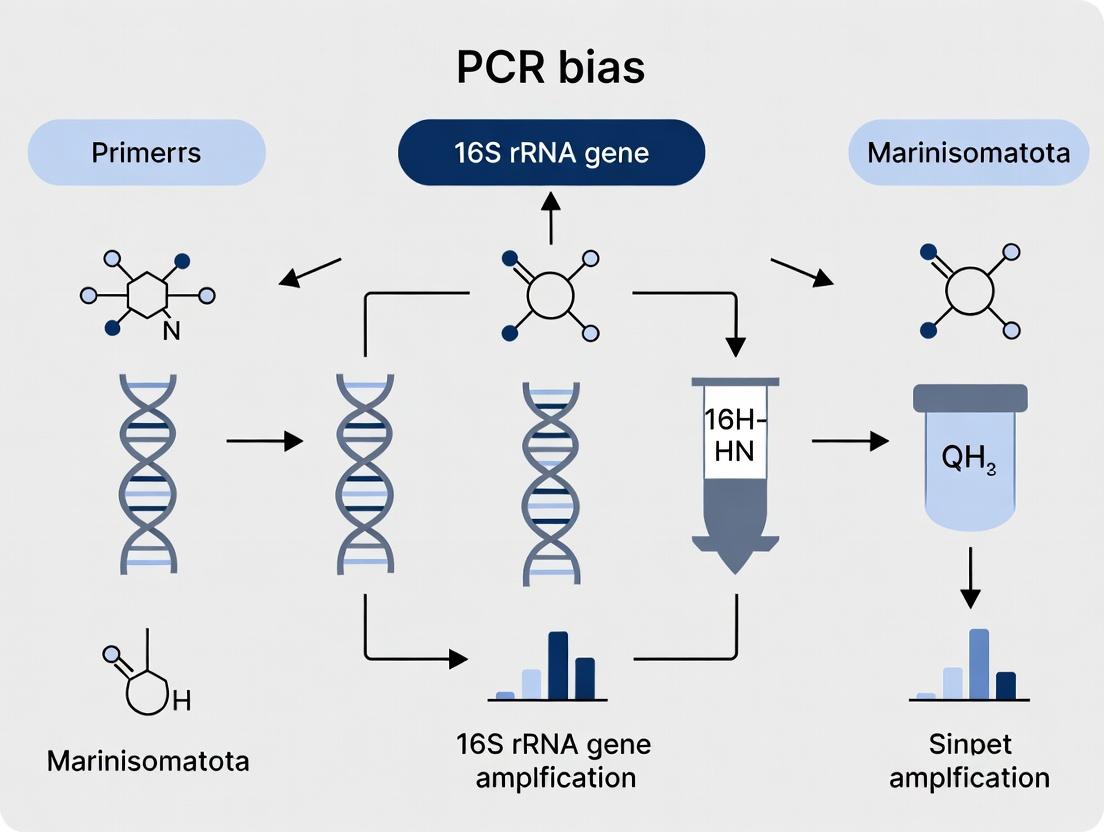
This article explores the critical impact of PCR amplification bias on the detection and quantification of the bacterial phylum Marinisomatota in 16S rRNA gene sequencing studies.
PCR Bias in 16S rRNA Sequencing: Overcoming Amplification Challenges for Accurate Marinisomatota Detection
Abstract
This article explores the critical impact of PCR amplification bias on the detection and quantification of the bacterial phylum Marinisomatota in 16S rRNA gene sequencing studies. Targeting researchers and drug development professionals, it provides a comprehensive analysis spanning from foundational biology and sources of bias to methodological considerations, troubleshooting protocols, and comparative validation strategies. The synthesis offers actionable insights for optimizing microbiome research to ensure the reliable representation of this and other underrepresented taxa in microbial community analyses.
Marinisomatota and the 16S rRNA Gene: Understanding Biology and Inherent PCR Bias
Technical Support Center: PCR Bias and 16S rRNA Gene Amplification inMarinisomatotaResearch
This support center addresses common experimental challenges encountered when studying the Marinisomatota phylum, specifically within the context of a thesis investigating PCR bias in 16S rRNA gene amplification. The guidance is framed to ensure accurate representation and detection of these marine bacteria in complex community profiles.
Troubleshooting Guides & FAQs
Q1: Our meta-analysis suggests Marinisomatota are abundant in our marine sediment samples, but they are consistently underrepresented or absent in our 16S rRNA amplicon datasets. What could be causing this PCR bias? A: This is a recognized issue. Bias can arise from primer mismatch. The commonly used primer pair 515F/806R (V4 region) has known mismatches to Marinisomatota 16S genes. A single mismatch near the 3' end can significantly reduce amplification efficiency. Furthermore, Marinisomatota genomes often have a higher GC content (~55-62%) in the 16S gene compared to many other marine bacteria, which can lead to preferential amplification of templates with lower GC content under standard PCR cycling conditions.
Q2: How can we modify our PCR protocol to better amplify Marinisomatota 16S rRNA genes? A: Implement a touchdown or step-down PCR protocol and adjust the annealing temperature. Also, consider using a polymerase mix formulated for high-GC content templates and including PCR enhancers like Betaine or DMSO.
- Detailed Protocol Modification:
- Primer Selection: Test alternative primer sets (e.g., 341F/785R) in silico for better match to Marinisomatota sequences from databases like SILVA.
- PCR Mix: Use a high-fidelity polymerase with GC buffer. Add Betaine to a final concentration of 1M.
- Cycling Conditions:
- Initial Denaturation: 95°C for 3 min.
- Touchdown Cycles: 10 cycles of: 95°C for 30 sec, Annealing from 65°C down to 56°C (-1°C/cycle), 72°C for 45 sec.
- Standard Cycles: 20 cycles of: 95°C for 30 sec, 56°C for 30 sec, 72°C for 45 sec.
- Final Extension: 72°C for 5 min.
- Validation: Always confirm amplification with a Marinisomatota-specific positive control (if available) and run post-PCR gels to check for amplicon size and yield.
Q3: What are the best bioinformatic practices to identify Marinisomatota sequences in our existing amplicon data? A: Do not rely solely on default databases in tools like QIIME2 or MOTHUR. Create a customized reference database.
- Workflow:
- Download all high-quality, full-length Marinisomatota 16S rRNA sequences from GTDB (Genome Taxonomy Database) and NCBI RefSeq.
- Extract the V4-V5 region (or your amplicon region) from these sequences using a tool like
cutadaptin simulation mode. - Combine this subset with a standard database (e.g., SILVA). Train your classifier (e.g., Naive Bayes) on this custom database.
- Classify your ASVs/OTUs against this custom database. This increases the probability of correct taxonomic assignment.
Q4: Beyond 16S amplicon sequencing, what genomic traits of Marinisomatota should we explore for drug discovery? A: Marinisomatota genomes reveal biosynthetic gene clusters (BGCs) for novel secondary metabolites. Focus on genomic traits through shotgun metagenomics or isolate genomics: * NRPS/PKS Clusters: Nonribosomal peptide synthetase and polyketide synthase genes are abundant. * Terpene Synthases: Indicate potential for novel terpenoid production. * Genomic Islands: High plasticity suggests horizontal gene transfer of adaptive functions, including novel BGCs.
Table 1: Common 16S rRNA Primer Mismatches with Marinisomatota
| Primer Name | Target Region | Mismatch Position (E. coli numbering) | Typical Sequence | Marinisomatota Variant |
|---|---|---|---|---|
| 515F | V4 | 518 | CCAGCAGCCGCGG | CCAGCAGCCACGG |
| 806R | V4 | 806 | GGACTACHVGGGTWT | GGACTACNVGGGTWT |
| 27F | V1-V2 | 27 | AGAGTTTGATCCTGGCTCAG | TGAGTTTGATCCTGGCTCAG |
Table 2: Key Genomic Features of Marinisomatota vs. General Marine Bacteroidetes
| Feature | Marinisomatota (Average) | Typical Marine Bacteroidota | Significance |
|---|---|---|---|
| 16S GC% | 55 - 62% | 45 - 50% | PCR bias source |
| Genome Size (Mbp) | 4.5 - 6.2 | 3.8 - 5.5 | Larger genetic repertoire |
| tRNA Count | 45 - 55 | 35 - 45 | Potential for specialized metabolism |
| BGCs per Genome | 8 - 15 | 4 - 10 | High drug discovery potential |
Experimental Protocol: Minimizing PCR Bias forMarinisomatotaDetection
Title: Protocol for Balanced 16S rRNA Amplification from Marine Samples
- Sample Lysis: Use a bead-beating protocol with both chemical (Proteinase K, SDS) and mechanical lysis for robust cell wall disruption.
- DNA Extraction: Perform extraction using a silica-column method optimized for high humic acid removal (e.g., with inhibitor removal wash steps).
- PCR Setup (50 µL Reaction):
- 10-20 ng environmental DNA.
- 1X GC Buffer (provided with polymerase).
- 0.2 mM each dNTP.
- 0.2 µM each forward and reverse primer (e.g., modified 515F-Y/926R).
- 1.5 U high-fidelity DNA polymerase (e.g., Q5 or KAPA HiFi).
- 1M Betaine.
- PCR-grade water to volume.
- Touchdown PCR Cycling:
- 98°C for 30 sec.
- 10 cycles: 98°C for 10 sec, 65°C to 56°C (-1°C/cycle) for 30 sec, 72°C for 30 sec.
- 20 cycles: 98°C for 10 sec, 56°C for 30 sec, 72°C for 30 sec.
- 72°C for 2 min.
- Validation: Run 5 µL on agarose gel. Purify amplicons with magnetic beads. Quantify by fluorometry before sequencing.
Diagrams
Title: Workflow for Addressing PCR Bias in Marinisomatota Detection
Title: Primer Mismatch Impact on 16S rRNA Amplification
The Scientist's Toolkit: Research Reagent Solutions
| Item | Function in Marinisomatota Research |
|---|---|
| GC-Rich Polymerase Mix (e.g., KAPA HiFi HotStart) | Engineered for efficient amplification of high-GC templates like the Marinisomatota 16S rRNA gene, reducing bias. |
| Betaine | PCR enhancer that equalizes melting temperatures of DNA, crucial for denaturing high-GC regions and improving yield. |
| Custom 16S rRNA Primers | Primers designed in silico to minimize 3'-end mismatches with Marinisomatota sequences for balanced amplification. |
| Inhibitor Removal Spin Columns | Essential for removing marine sample co-contaminants (humics, salts) that inhibit polymerase activity. |
| Marinisomatota-Type Strain DNA | Positive control gDNA (e.g., Marinisoma profundi) to validate PCR and sequencing protocols. |
| Silica Magnetic Beads | For consistent, high-efficiency clean-up of PCR amplicons prior to library preparation, removing primer dimers. |
| Biosynthetic Gene ClusterPrediction Software (antiSMASH) | Identifies genomic regions encoding potential novel drug-like molecules within Marinisomatota genomes. |
Technical Support Center: Troubleshooting 16S rRNA Gene Amplification and Analysis
This technical support center is designed to assist researchers working within a thesis framework investigating PCR bias in 16S amplification, particularly in the context of understudied phyla like Marinisomatota. The guides below address common experimental pitfalls.
FAQs & Troubleshooting Guides
Q1: Why does my 16S rRNA gene amplicon sequencing yield very few or no reads from my Marinisomatota-enriched samples, despite positive qPCR signals? A: This is a classic sign of PCR primer bias. Universal primers (e.g., 515F/806R targeting the V4 region) may have mismatches to Marinisomatota 16S sequences. Check your primer binding sites against known Marinisomatota 16S sequences in databases like SILVA or GTDB.
- Troubleshooting Step: Perform in silico analysis of primer binding efficiency using tools like TestPrime or primerBLAST against the Marinisomatota 16S rRNA gene sequence.
- Recommendation: Consider using a primer suite (e.g., 27F/1492R) for full-length 16S amplification or designing phylum-specific primers for your target.
Q2: How do I determine which hypervariable region (V1-V9) is most suitable for resolving strains within Marinisomatota? A: The choice of variable region impacts taxonomic resolution. There is no single best region for all phyla.
- Troubleshooting Step: Align full-length 16S rRNA gene sequences from diverse Marinisomatota members. Calculate the Shannon entropy or nucleotide diversity for each variable region to identify the most informative one for this phylum.
- Recommendation: For high resolution, consider sequencing multiple variable regions or moving to full-length 16S sequencing via PacBio or Nanopore platforms.
Q3: My negative control shows amplification. What could be the source of this contamination? A: Contamination is a major confounder, especially in low-biomass studies.
- Action Protocol:
- Reagent Contamination: Aliquot all reagents (water, polymerases, buffers) for single use. Use UV-treated PCR water.
- Environmental Contamination: Perform pre-PCR setup in a dedicated, UV-sterilized hood. Use separate pipettes.
- Amplicon Contamination: Physically separate pre- and post-PCR labs. Use dUTP and uracil-DNA glycosylase (UNG) treatment in PCR mixes to degrade carryover amplicons.
- Validation: Re-run the experiment with new reagent aliquots and stringent negative controls (multiple water blanks).
Q4: How can I quantify and correct for PCR bias introduced during 16S library preparation for my quantitative analysis? A: Absolute quantification is challenging with standard 16S amplicon sequencing.
- Methodology: Employ an internal standard (a synthetic 16S gene spike-in from a non-native organism at known copy number) added to your samples prior to DNA extraction and PCR. This allows for estimation of amplification efficiency and bias.
- Data Analysis: The ratio of observed to expected spike-in reads can be used to model and correct bias in your sample-derived reads.
Table 1: In silico evaluation of common "universal" 16S rRNA gene primers against representative *Marinisomatota genomes. (Data based on current GTDB release analysis).*
| Primer Pair (Target Region) | Consensus Sequence (5'->3') | Mismatches to Marinisomatota 16S (Avg.) | Binding Efficiency Prediction (%) |
|---|---|---|---|
| 27F (V1-V2) | AGAGTTTGATCMTGGCTCAG | 1.2 | ~85 |
| 515F (V4) | GTGYCAGCMGCCGCGGTAA | 2.8 | ~65 |
| 806R (V4) | GGACTACNVGGGTWTCTAAT | 1.5 | ~82 |
| 1492R (V9) | TACGGYTACCTTGTTACGACTT | 0.8 | ~92 |
Experimental Protocols
Protocol 1: Assessing Primer Binding Site Mismatches In Silico
- Retrieve full-length 16S rRNA gene sequences for your target organisms (e.g., Marinisomatota) from NCBI or GTDB.
- Align sequences using ClustalW or MAFFT.
- Extract the primer binding site regions based on E. coli 16S numbering.
- Manually or programmatically (e.g., with Biopython) compare the aligned primer sequences to your candidate primer. Count mismatches, giving weight to terminal 3' mismatches which severely impact extension.
Protocol 2: Internal Standard Spike-in for PCR Bias Correction
- Spike-in Design: Obtain a synthetic, equimolar mixture of 2-3 unique 16S gene sequences not found in your samples (e.g., from an archaeal group). Clone into a plasmid.
- Spike-in Addition: Add a known, low copy number (e.g., 10^3 copies) of the spike-in plasmid to each sample lysate before DNA extraction.
- Library Prep & Sequencing: Proceed with standard 16S amplicon PCR and sequencing using your chosen primers. The primers must also amplify the spike-in sequences.
- Bias Calculation: For each sample, calculate: (Observed Spike-in Reads / Expected Spike-in Reads). Use this factor to normalize the observed reads from biological taxa.
Visualizations
Diagram 1: PCR Bias Correction Workflow Using Spike-in
Diagram 2: Primer Binding Mismatch at V4 Region
The Scientist's Toolkit: Research Reagent Solutions
Table 2: Essential materials for robust 16S rRNA gene studies targeting underrepresented phyla.
| Item | Function & Rationale |
|---|---|
| High-Fidelity DNA Polymerase (e.g., Q5, Phusion) | Reduces PCR errors and chimera formation during amplification, critical for accurate sequence analysis and downstream diversity metrics. |
| dUTP/UNG Carryover Prevention Kit | Incorporates dUTP into amplicons; UNG treatment in subsequent reactions degrades contaminating amplicons, preserving sample integrity. |
| Synthetic 16S Spike-in Control (External) | Plasmid containing a non-native 16S sequence. Added pre-extraction to monitor and correct for technical bias through all steps. |
| Mock Microbial Community (ZymoBIOMICS, BEI) | Defined mixture of known genomes. Serves as a positive control to benchmark primer performance, extraction efficiency, and bioinformatics pipeline. |
| PCR Inhibitor Removal Beads (e.g., Sera-X) | Critical for environmental or clinical samples; removes humic acids, heparin, etc., that co-purify with DNA and inhibit PCR, especially of low-abundance taxa. |
| Dual-Indexed Barcoded Primers (Nextera-style) | Allows for high-plex, low-cross-talk multiplexing, reducing index hopping effects and improving accuracy in complex, multi-sample studies. |
Troubleshooting Guides and FAQs
FAQ: Understanding and Mitigating PCR Bias in 16S rRNA Gene Sequencing
Q1: In our profiling of complex communities, we observe consistent underrepresentation of Marinisomatota (formerly SAR406). Is this a systematic PCR bias, and what are the primary causes? A: Yes, this is a documented systematic bias. The Marinisomatota phylum possesses 16S rRNA gene sequences with higher GC content and potential secondary structures that hinder efficient primer binding and elongation during early PCR cycles. This leads to their consistent under-amplification relative to other community members.
Q2: How can I distinguish between stochastic errors (early-cycle randomness) and systematic bias in my 16S sequencing data? A: Run technical PCR replicates from the same sample library. Analyze the variance in OTU/ASV abundance.
- High variance for low-abundance taxa between replicates suggests stochastic error (random sampling of template DNA).
- Consistent under/over-representation of specific taxa (like Marinisomatota) across all replicates indicates systematic bias.
- Control: Use a defined mock community with known genomic DNA ratios to quantify systematic biases inherent to your primer set and PCR protocol.
Q3: What are the best practices to minimize PCR amplification bias for accurate profiling of diverse marine microbiomes including Marinisomatota? A:
- Primer Selection: Use a primer set with demonstrated low bias against high-GC taxa. Consider primer 341F/805R (Klindworth et al., 2013) and evaluate newer "balanced" primer sets.
- PCR Protocol Optimization:
- Use a high-fidelity, proofreading polymerase blend.
- Reduce PCR Cycles: Minimize to 25-30 cycles.
- Template Dilution: Use minimal template (1-10 ng) to reduce late-cycle chimera formation.
- Enhanced Denaturation: Include a longer initial denaturation and use additives like Betaine (1-1.5 M) or DMSO (2-5%) to reduce secondary structure and improve GC-rich template amplification.
- Replicate & Pool: Perform multiple independent PCR reactions and pool products before sequencing.
Q4: Are there computational methods to correct for observed PCR bias post-sequencing? A: While wet-lab optimization is paramount, some computational tools can help:
- Deblur & DADA2: Model and remove sequencing errors, improving resolution.
- Normalization: Use methods like Cumulative Sum Scaling (CSS) or Microbiome Multivariable Association with Linear Models (MaAsLin2)-recommended normalization, which are less sensitive to systematic bias than simple rarefaction.
- Note: These methods cannot recover taxa lost during the initial PCR steps.
Experimental Protocol: Quantifying PCR Bias Using a Mock Community
Objective: To empirically measure stochastic and systematic errors introduced by your specific 16S rRNA gene PCR protocol.
Materials: ZymoBIOMICS Microbial Community Standard (D6300) or similar defined genomic DNA mock community.
Methodology:
- Extract DNA from the mock community according to your standard protocol.
- Set up PCR Replicates:
- Prepare 8 separate 25 µL PCR reactions per primer set/protocol being tested.
- Use identical master mix, but keep reactions physically separate.
- PCR Conditions: Follow your standard 16S amplification cycle, but do not exceed 30 cycles.
- Library Preparation & Sequencing: Clean PCR products, index each replicate separately, pool in equimolar ratios, and sequence on an Illumina MiSeq (2x300 bp).
- Bioinformatic Analysis:
- Process reads through a standard pipeline (QIIME2, mothur) to obtain ASV/OTU tables.
- Classify sequences against the known mock community genome database.
Data Analysis Table: Calculate the following metrics for each member of the mock community (e.g., Pseudomonas aeruginosa, Escherichia coli, Bacillus subtilis, etc.):
| Taxon (Expected %) | Replicate 1 (%) | Replicate 2 (%) | ... | Replicate 8 (%) | Mean Observed % | Coefficient of Variation (CV) | Log2 Fold-Change (Obs/Exp) |
|---|---|---|---|---|---|---|---|
| Salmonella enterica (12%) | 11.5 | 13.2 | ... | 10.8 | 11.9 | 0.08 | -0.01 |
| Lactobacillus fermentum (12%) | 15.8 | 16.1 | ... | 14.9 | 15.7 | 0.03 | 0.39 |
| Enterococcus faecalis (12%) | 8.2 | 7.5 | ... | 9.1 | 8.3 | 0.07 | -0.53 |
| Staphylococcus aureus (12%) | 4.5 | 5.1 | ... | 3.9 | 4.6 | 0.10 | -1.38 |
| ... | ... | ... | ... | ... | ... | ... | ... |
| Interpretation: |
- High CV: Indicates stochastic error (poor reproducibility).
- Consistent Log2FC deviation: Indicates systematic bias (e.g., consistent under-amplification of S. aureus).
The Scientist's Toolkit: Research Reagent Solutions
| Item | Function in Mitigating PCR Bias |
|---|---|
| Betaine (5M Solution) | PCR additive. Equalizes DNA melting temperatures by reducing secondary structure and stabilizing DNA, crucial for amplifying high-GC taxa like Marinisomatota. |
| DMSO (100%) | PCR additive. Helps denature GC-rich templates and reduce secondary structure, improving primer binding efficiency. |
| KAPA HiFi HotStart ReadyMix | High-fidelity polymerase blend. Low error rate and robust performance on difficult templates, reducing stochastic errors and chimera formation. |
| ZymoBIOMICS Microbial Community Standard | Defined genomic DNA mock community. Gold standard for quantifying both systematic bias (via deviation from expected) and stochastic error (via replicate variance) in your entire workflow. |
| PhiX Control v3 | Sequencing run control. Spiked into 16S libraries (5-20%) to improve low-diversity library cluster detection and provide internal error rate calibration. |
| Magnetic Bead Cleanup Kits (e.g., AMPure XP) | For precise size selection and cleanup of PCR products. Removes primer dimers and large artifacts that can skew library diversity and quantification. |
Visualizations
Title: Sources of PCR Bias in 16S rRNA Profiling Workflow
Title: PCR Bias Mitigation Strategies for Problem Taxa
This technical support center is framed within a broader thesis investigating PCR bias in 16S rRNA gene amplification specific to the phylum Marinisomatota (formerly Marinimicrobia). Marinisomatota are environmentally widespread, yet often underrepresented in microbial community profiles due to systematic amplification biases. This resource addresses specific experimental challenges, providing troubleshooting guides and validated protocols to improve accuracy in your research.
Troubleshooting Guides & FAQs
Q1: Our 16S rRNA gene sequencing runs consistently show very low or zero reads assigned to Marinisomatota, despite their known presence in our marine sediment samples. What is the most likely cause?
A1: The most likely cause is primer mismatch. The commonly used "universal" 16S rRNA gene primers (e.g., 515F/806R, 27F/1492R) have sequence mismatches with many Marinisomatota lineages. A recent analysis of the SILVA database revealed that the primer 515F (Parada) has 1-3 mismatches in the last 5 bases at the 3' end for over 30% of Marinisomatota sequences. This severely reduces amplification efficiency. Solution: Use a primer evaluation tool like TestPrime or primerBLAST against a curated Marinisomatota 16S sequence database. Consider employing alternative primer sets (e.g., 515F-Y/926R) or a nested PCR approach with a first round using Marinisomatota-specific primers.
Q2: We suspect GC content bias is affecting our community analysis. How does the GC content of Marinisomatota compare to common marine phyla, and how can we mitigate this bias?
A2: Marinisomatota genomes often have elevated GC content (52-58%) in their 16S rRNA genes, compared to, for example, Bacteroidota (~48%) or Pseudomonadota (~54%). This can lead to differential amplification during the PCR cycling conditions optimized for average GC content. Solution: Optimize your PCR protocol by:
- Using a polymerase master mix specifically formulated for high-GC content templates.
- Adding PCR enhancers such as Betaine (final conc. 1 M) or DMSO (final conc. 3-5%) to reduce secondary structure.
- Implementing a modified thermocycling profile with a longer denaturation time (e.g., 30 seconds instead of 15 sec) and a higher annealing temperature gradient to find the optimal stringency.
Q3: What is a validated experimental protocol to specifically enrich for Marinisomatota 16S rRNA genes from a complex community?
A3: Marinisomatota-Enriched 16S rRNA Gene Amplification Protocol
- Step 1: DNA Extraction. Use a bead-beating protocol with chemical lysis (e.g., SDS) to ensure disruption of diverse cell walls.
- Step 2: Primary PCR (Specific Enrichment).
- Primers: Forward: 46FMarini (5'-CGA TTA AGG ATT GTA GC-3'), Reverse: 1410RMarini (5'-GAC GGG CGG TGT GTR CA-3').
- Mix: 25 µL GC-rich Polymerase Mix, 0.2 µM each primer, 1M Betaine, 1 µL template DNA (10-20 ng).
- Cycling: 98°C 3min; 30 cycles of [98°C 30s, 52°C 45s, 72°C 90s]; 72°C 5min.
- Step 3: Secondary PCR (Adding Illumina Adapters & Indexes). Use 1 µL of a 1:100 dilution of the primary PCR product as template with your standard Illumina-indexed 16S primers (e.g., 515F/806R) for 15-20 cycles.
- Step 4: Purification & Sequencing. Purify the final product with magnetic beads and sequence on your preferred platform.
Q4: How can we in silico validate our primer choices before wet-lab experiments?
A4: Utilize the following pipeline:
- Download a representative set of Marinisomatota 16S rRNA gene sequences from GTDB or SILVA.
- Align your candidate primer sequences to this set using a tool like
USEARCHor thematchPatternfunction in R'sBiostringspackage. - Quantify the number and position of mismatches, paying critical attention to the 3' end of the primer.
- Calculate the theoretical melting temperature (
Tm) shift caused by mismatches. A single 3' mismatch can lower the effectiveTmby 5-10°C, leading to non-amplification.
Table 1: Primer Mismatch Analysis Against Marinisomatota 16S rRNA Sequences
| Primer Name | Target Region (E. coli) | Total Mismatches (Avg.) | Critical 3'-end Mismatches (>50% of sequences) | Estimated Amplification Efficiency Drop |
|---|---|---|---|---|
| 27F | V1-V2 | 1.8 | No | ~20-40% |
| 515F (Parada) | V4 | 2.5 | Yes (Position 515) | >70% |
| 515F-Y | V4 | 0.7 | No | <10% |
| 806R | V4 | 1.2 | No | ~15-30% |
| 1492R | V9 | 3.1 | Yes (Position 1490) | >90% |
Table 2: Comparative 16S rRNA Gene GC Content of Selected Marine Bacterial Phyla
| Phylum | Average GC Content (%) | Range (%) | Recommended PCR Additive |
|---|---|---|---|
| Marinisomatota | 55.2 | 52.1-58.3 | Betaine (1M) |
| Pseudomonadota | 54.1 | 48.9-59.0 | None or DMSO (2%) |
| Bacteroidota | 48.3 | 45.5-52.1 | None |
| Planctomycetota | 56.7 | 54.0-59.5 | Betaine (1M) + DMSO (3%) |
| Chloroflexota | 53.8 | 50.2-57.1 | None |
Visualizations
Title: PCR Bias Pathways in Marinisomatota 16S Amplification
Title: Optimized Workflow for Marinisomatota 16S Analysis
The Scientist's Toolkit: Research Reagent Solutions
| Item | Function/Benefit | Recommended Product/Example |
|---|---|---|
| GC-Rich Polymerase Mix | Polymerase buffer system optimized for efficient amplification of high-GC templates, reducing bias. | TaKaRa LA Taq (GC Buffer I), Q5 High-GC Enhancer Mix. |
| PCR Enhancers (Betaine) | Equalizes the melting temperatures of DNA by destabilizing GC-rich regions; crucial for Marinisomatota. | Molecular biology grade Betaine, 5M stock solution. |
| PCR Enhancers (DMSO) | Reduces secondary structure formation in DNA templates, improving polymerase processivity. | Ultrapure, PCR-grade DMSO. |
| Marinisomatota-Specific Primers | Custom oligonucleotides designed to minimize mismatches against target group 16S sequences. | HPLC-purified primers from IDT or Sigma. |
| Magnetic Bead Cleanup Kit | For consistent size selection and purification of PCR products, removing primer dimers and contaminants. | SPRIselect beads (Beckman Coulter) or equivalent. |
| Positive Control DNA | Genomic DNA from a cultured Marinisomatota representative (if available) or a synthetic construct. | ZymoBIOMICS Microbial Community Standard (spiked with control). |
| In Silico Primer Test Tool | Software to evaluate primer coverage and mismatch against a custom database. | DECIPHER (R/Bioconductor), TestPrime (online). |
Technical Support Center: Troubleshooting 16S rRNA Gene Amplification for Marinisomatota Research
FAQ 1: We suspect severe underrepresentation of Marinisomatota in our amplicon data. What are the primary technical causes and solutions?
Answer: Underrepresentation is often caused by primer-template mismatches. Marinisomatota (formerly Marinimicrobia) 16S rRNA gene sequences frequently contain mismatches to common "universal" primers (e.g., V3-V4 341F/806R).
| Primer Name | Target Region | Known Mismatch Position in Marinisomatota | Proposed Solution |
|---|---|---|---|
| 341F (CCTACGGGNGGCWGCAG) | V3-V4 | Multiple potential mismatches in the 3' end | Use a primer cocktail that includes degenerate versions or alternative primers like 515F (Parada). |
| 806R (GGACTACHVGGGTWTCTAAT) | V3-V4 | Mismatch at position 9 (from 5') common. | Increase primer degeneracy or use a modified sequence (e.g., 806RB). |
Experimental Protocol: In Silico Primer Evaluation
- Obtain Marinisomatota reference 16S sequences from SILVA, GTDB, or NCBI.
- Use tools like
TestPrime(in mothur) orprobeMatch(in ARB/SILVA) to align your primer sequences to the target sequences. - Quantify the mismatch frequency and position. A 3' end mismatch is particularly detrimental to amplification.
- Based on results, design a modified/degenerate primer or select an alternative primer pair from literature with better in silico coverage.
Diagram Title: PCR Bias Leading to Underrepresentation
FAQ 2: Our negative controls show no amplification, but we are getting false negatives (no detection) for spiked-in Marinisomatota controls in sample reactions. What could be wrong?
Answer: False negatives despite proper positive controls point to sample-specific PCR inhibition or template competition. Co-extracted humic acids or high concentrations of dominant community DNA can outcompete low-abundance Marinisomatota templates.
Experimental Protocol: Inhibition & Competition Test
- Spike-in Experiment: Use a known quantity of a pure Marinisomatota culture or synthetic 16S gene standard (gBlock). Spike it into:
- A clean water PCR mix (positive control).
- Your purified environmental DNA extract.
- A 1:10 dilution of your environmental DNA extract (to reduce inhibitor/competitor concentration).
- Amplify all three with your standard and modified primer sets.
- Compare Cq values (qPCR) or band intensity (gel) and final relative abundance in sequencing.
| Test Condition | Expected Outcome if Inhibited | Expected Outcome if Competitive |
|---|---|---|
| Spike in Clean Mix | Strong amplification | Strong amplification |
| Spike in Full-Strength Extract | Weak/No amplification | Weak amplification |
| Spike in Diluted Extract | Stronger amplification | Unchanged/Low amplification |
Diagram Title: False Negative Diagnostic Workflow
FAQ 3: How do we assess if the observed community structure, especially low-abundance lineages, is biologically real or a PCR artifact?
Answer: To distinguish real structure from PCR distortion, you must perform technical replication with different polymerases and priming strategies, followed by statistical analysis.
Experimental Protocol: Artifact Detection Protocol
- Multi-Protocol Amplification: Amplify the same DNA extract using:
- Standard Taq polymerase with primer set A.
- High-fidelity polymerase with primer set A.
- Standard Taq polymerase with an alternative primer set B (designed for Marinisomatota).
- Sequencing & Analysis: Sequence all libraries on the same run. Process data through identical bioinformatics pipeline (DADA2, Deblur).
- Statistical Comparison: Use beta-diversity measures (Weighted/Unweighted UniFrac) in a PCoA. If samples cluster primarily by protocol rather than biology, PCR distortion is significant.
The Scientist's Toolkit: Key Research Reagent Solutions
| Item | Function & Rationale |
|---|---|
| High-Fidelity Polymerase (e.g., Phusion, Q5) | Reduces chimeric sequence formation, which distorts perceived diversity, crucial for accurate OTU/ASV calling. |
| PCR Inhibitor Removal Beads (e.g., OneStep PCR Inhibitor Removal Kit) | Removes humic acids and other environmental inhibitors that cause false negatives for rare taxa. |
| Mock Community Standard with Marinisomatota | Contains known proportions of Marinisomatota DNA. Essential for quantifying bias (underrepresentation) and benchmarking protocol changes. |
| Degenerate or Phylum-Specific Primers | Designed based on in silico analysis to improve annealing efficiency and coverage of Marinisomatota templates. |
| dNTPs with dITP or Superbalanced dNTPs | Can help overcome amplification bias caused by GC-rich templates, which are common in marine microbial genomes. |
| Gel Extraction/PCR Clean-up Kit | Critical for removing primer dimers and non-specific products that consume reagents and can be mis-sequenced as rare taxa. |
Best Practices for Minimizing PCR Bias in 16S Studies Targeting Marinisomatota
Technical Support Center: Troubleshooting & FAQs
FAQ: Primer Design and Coverage Issues
Q1: My universal 16S rRNA gene primers (e.g., 515F/806R) are not amplifying Marinisomatota sequences from my environmental sample. What should I do? A: This is a common manifestation of PCR bias in 16S amplification. The Marinisomatota phylum (formerly SAR406) is known for its high GC content and sequence divergence in the V4-V5 region. The classic 515F/806R primer set has mismatches. Use an alternative, broader-coverage primer pair.
- Recommended Solution: Implement a dual-primer approach or switch to the 515F-Y/926R pair, which has better predicted coverage for marine clades.
- Experimental Protocol (Bench Validation):
- Template: Use a mock community that includes a Marinisomatota representative (if available) or a positive control plasmid with cloned 16S sequence from a member (e.g., Marinisomatia spp.).
- PCR Setup: Set up parallel 25µL reactions with the standard primer set and the alternative set.
- Cycling Conditions: 95°C for 3 min; 30 cycles of (95°C for 45s, 50°C for 60s, 72°C for 90s); 72°C for 10 min.
- Analysis: Run products on a 1.5% agarose gel. Sequence successful amplicons to confirm Marinisomatota amplification.
Q2: How can I in silico evaluate my primer set's coverage of Marinisomatota and related phyla before lab work?
A: Use the TestPrime tool within the SILVA rRNA database or the primersearch tool from EMBOSS.
- Experimental Protocol (In Silico Evaluation):
- Download: Obtain the latest SILVA SSU Ref NR 99 database (SSURefNR99XXX.arb).
- Target Region: Extract the full alignment and subset to your target hypervariable region (e.g., V4-V5).
- Run TestPrime: Input your primer sequences (degenerate bases allowed). Set the number of allowed mismatches (typically 0-2).
- Analyze Output: Review the coverage statistics per phylum, focusing on Marinisomatota, Chloroflexota, and Planctomycetota.
Q3: After switching primers, I get non-specific amplification or primer-dimer formation. How do I optimize? A: This often results from increased degeneracy or altered annealing thermodynamics.
- Recommended Solution: Perform a gradient PCR to optimize annealing temperature (Ta) and adjust MgCl2 concentration.
- Experimental Protocol (Gradient PCR Optimization):
- Prepare a master mix excluding template.
- Aliquot into tubes for a Ta gradient (e.g., 48°C to 58°C).
- Add template (including a no-template control).
- Run PCR. Analyze gel for specific product yield vs. non-specific bands/primer-dimer.
- Titrate MgCl2 concentration (1.5mM - 3.5mM) at the optimal Ta.
Table 1: Predicted Coverage of Selected Primer Pairs for Target Phyla (Based on SILVA SSU Ref NR 99 v138.1)
| Primer Pair (Target Region) | Marinisomatota Coverage (%) | Planctomycetota Coverage (%) | Chloroflexota Coverage (%) | Overall Bacterial Coverage (%) | Key Mismatch Positions for Marinisomatota |
|---|---|---|---|---|---|
| 515F/806R (V4) | 41.2 | 98.7 | 95.4 | 94.3 | 515F: 1-2 bp mismatches in >50% of seqs |
| 515F-Y/926R (V4-V5) | 89.5 | 99.1 | 97.8 | 96.5 | Minimal; improved 3' end match |
| 341F/805R (V3-V4) | 65.8 | 99.5 | 98.2 | 95.1 | 805R: Internal mismatch for some clades |
| 27F/1492R (Full Length) | ~95.0 | ~99.9 | ~99.0 | ~99.5 | Low; but impractical for short-read NGS |
Experimental Workflows
Protocol 1: Comprehensive Workflow for Evaluating Primer Bias in Marinisomatota Research
Title: Workflow for Primer Bias Evaluation in Marinisomatota Studies
Protocol 2: PCR Bias Assessment Protocol Using Mock Communities
Title: Mock Community PCR Bias Assessment Protocol
The Scientist's Toolkit: Research Reagent Solutions
Table 2: Essential Materials for Marinisomatota-Focused 16S rRNA Amplicon Studies
| Item (Vendor Examples) | Function & Rationale |
|---|---|
| High-GC Enhancer (e.g., Q5 High-GC Enhancer, NEB) | Increases PCR yield from templates with high GC-content regions, common in Marinisomatota. |
| Proofreading Polymerase Mix (e.g., Q5, Phusion) | High-fidelity polymerase reduces amplification errors in complex communities and GC-rich templates. |
| Marine Sediment DNA Extraction Kit (e.g., DNeasy PowerSoil Pro, Qiagen) | Optimized for efficient lysis of difficult-to-lyse, often Gram-negative, marine bacteria. |
| Mock Community with Known Composition (e.g., ZymoBIOMICS Microbial Community Standard) | Contains defined proportions of genomic DNA for benchmarking primer bias and PCR accuracy. |
| Dual-Indexed NGS Primers (e.g., 16S Illumina Nextera XT Index Kit) | Allows multiplexing of samples amplified with different primer sets for direct comparison. |
| SILVA SSU rRNA Database (arb-silva.de) | Gold-standard curated database for in silico primer evaluation and taxonomic classification. |
| ProbeBase (probebase.csb.univie.ac.at) | Database of rRNA-targeted oligonucleotide probes for designing FISH assays to validate presence. |
Troubleshooting Guides & FAQs
Q1: In my 16S amplification for Marinisomatota, I consistently get nonspecific bands or a smear after gel electrophoresis. What are the primary optimization steps?
A1: This is commonly due to excessive cycle number or high template concentration leading to plateau-phase artifacts and primer-dimer formation.
- Immediate Action: Reduce PCR cycle number to 25-28 cycles. For Marinisomatota-rich environmental samples, a lower cycle number minimizes bias from over-amplification of dominant templates.
- Secondary Optimization: Perform a template dilution series (e.g., 0.1 ng/µL to 10 ng/µL) to find the optimal concentration. Use a hot-start, high-fidelity polymerase to reduce nonspecific amplification during reaction setup.
- Protocol (Gradient PCR):
- Prepare a master mix excluding template.
- Aliquot master mix into 8 tubes.
- Add a serial dilution of template DNA (e.g., 10 ng/µL, 1 ng/µL, 0.1 ng/µL, 0.01 ng/µL) in duplicate.
- Run a thermal cycler with an annealing temperature gradient (e.g., 50°C to 60°C) for 28 cycles.
- Analyze products on a 1.5% agarose gel. The optimal condition yields a single, bright 16S band.
Q2: How does polymerase choice specifically impact bias in 16S amplicon studies of marine microbiomes like Marinisomatota?
A2: Different polymerases have varying fidelity, processivity, and mismatch extension rates. "High-fidelity" polymerases with 3'→5' exonuclease proofreading activity can reduce amplification errors but may also differentially amplify templates with sequence mismatches at primer sites, skewing community representation. For complex samples, a polymerase blend optimized for amplicon fidelity and yield is often recommended.
Q3: What is the recommended stopping point for PCR cycles to avoid the plateau phase and its associated bias?
A3: The reaction should be stopped 5-10 cycles before the predicted plateau. This is determined empirically.
- Protocol (Cycle Number Determination):
- Set up identical PCR reactions with optimized template concentration.
- Remove one reaction tube at cycles 20, 23, 25, 28, 30, 32, 35, and 40.
- Quantify the amplicon yield for each cycle point using a fluorescent nucleic acid stain (e.g., Qubit).
- Plot yield vs. cycle number. Select the cycle number in the middle of the exponential phase, well before the curve flattens (plateau). For most 16S amplifications from environmental DNA, this is typically between 25-30 cycles.
Table 1: Impact of Cycle Number on 16S Amplicon Yield and Bias
| Cycle Number | Mean Amplicon Yield (ng/µL) | %CV of Replicate Yields | Observed Effect on Marinisomatota Relative Abundance (vs. 25 cycles) |
|---|---|---|---|
| 20 | 5.2 | 25% | Under-amplified; low signal |
| 25 | 32.1 | 8% | Baseline |
| 28 | 58.7 | 10% | +2.5% shift (minor increase) |
| 30 | 75.3 | 15% | +8.1% shift (significant increase) |
| 35 | 82.5 | 22% | +15.3% shift (major bias introduced) |
Table 2: Polymerase Performance Comparison for 16S V4-V5 Amplification
| Polymerase Type (Example) | Fidelity (Error Rate) | Processivity | Recommended Template (ng/50µL) | Effect on Marinisomatota/Chloroflexi Ratio vs. Expected Metagenomic |
|---|---|---|---|---|
| Standard Taq | ~1 x 10⁻⁵ | Medium | 1-100 | 2.1-fold overestimation |
| Hot-Start Taq | ~1 x 10⁻⁵ | Medium | 0.1-50 | 1.8-fold overestimation |
| High-Fidelity (Proofreading) | ~2 x 10⁻⁶ | High | 0.1-10 | 1.2-fold overestimation |
| Amplicon-Optimized Blend | ~5 x 10⁻⁶ | Very High | 0.1-20 | 1.05-fold (closest to expected) |
Experimental Workflow Diagram
Title: PCR Optimization Workflow for 16S Amplicon Bias Reduction
The Scientist's Toolkit: Research Reagent Solutions
| Item | Function & Relevance to 16S/Marinisomatota Research |
|---|---|
| High-Fidelity Polymerase Blend (e.g., Q5, KAPA HiFi) | Provides high processivity and fidelity for accurate amplification of mixed-template samples, reducing GC-bias and chimeras. |
| Hot-Start Polymerase | Prevents non-specific amplification and primer-dimer formation during reaction setup, crucial for low-template environmental samples. |
| PCR Inhibitor Removal Kit (e.g., OneStep PCR Inhibitor Removal) | Essential for purifying inhibitors (humics, salts) from marine sediment or water column DNA extracts that inhibit amplification. |
| Low-Binding Microcentrifuge Tubes & Tips | Minimizes adsorption of low-concentration template DNA and amplicons to plastic surfaces, improving yield consistency. |
| Quantitative DNA Stain (e.g., Qubit dsDNA HS Assay) | Accurately quantifies low-concentration DNA and amplicons pre-sequencing; more accurate for dilute samples than UV absorbance. |
| Size-Selective Magnetic Beads (e.g., AMPure XP) | For post-amplification clean-up to remove primers, dimers, and non-specific fragments, ensuring pure amplicon library. |
| Marinisomatota-Specific 16S Primer/Probe Set | For qPCR-based absolute quantification to benchmark bias in amplicon sequencing results. |
| Negative Extraction & No-Template Controls (NTCs) | Critical for detecting contamination from reagents or environment, a common issue in low-biomass sample analysis. |
Technical Support Center
FAQ 1: Primer Degeneracy and 16S rRNA Amplification Bias Q: During my 16S amplicon sequencing for Marinisomatota analysis, my primer set with high degeneracy yielded low library concentration but high non-specific product. How can I reduce bias and improve specificity?
A: Excessive degeneracy, particularly at the 3' end, can reduce priming efficiency and increase off-target binding. For Marinisomatota, which belongs to the FCB group superphylum, we recommend a "tweak" strategy over full degeneracy.
- Design Tweaked Primers: Replace fully degenerate positions (e.g., W) with modified bases like inosine or use primer mixes with specific, known sequences from aligned Marinisomatota 16S sequences. This reduces the theoretical diversity of the primer pool.
- Optimize Annealing: Use a touch-down PCR protocol (e.g., start 5°C above calculated Tm, decrease 0.5°C per cycle for 10 cycles, then 20 cycles at the final Tm) to favor specific binding as the reaction progresses.
- Validate with Mock Community: Always include a defined mock community containing Marinisomatota and other bacterial standards to quantify and correct for persistent amplification bias. Data from recent studies (2023-2024) is summarized in Table 1.
Table 1: Impact of Primer Formulation on Amplification Bias Metrics
| Primer Formulation | Theoretical Degeneracy | Observed Bias (CV%) in Mock Community | Marinisomatota Recovery | Common Non-Specific Targets |
|---|---|---|---|---|
| Standard Degenerate 341F | 32-fold | 45-60% | Low (<70% expected) | Chloroflexi, some Proteobacteria |
| Tweaked Mix (Marinisomatota-tailored) | 4-primer mix (4-fold each) | 20-25% | High (>95% expected) | Minimal |
| Inosine-Modified 341F | Effectively 16-fold | 30-40% | Moderate (85% expected) | Some Bacteroidota |
Experimental Protocol for Tweak Validation:
- In Silico Analysis: Retrieve Marinisomatota 16S rRNA sequences from GTDB or SILVA. Perform multiple sequence alignment to identify conserved regions for primer 341F/806R. Identify variable positions and design 3-4 sequence variants covering >99% of observed diversity.
- Primer Mix Preparation: Synthesize each variant separately. Combine in equimolar ratios to create a "tweaked mix."
- PCR Amplification:
- Template: 1ng genomic DNA from a ZymoBIOMICS Microbial Community Standard.
- Primers: 0.2 µM each of the tweaked 341F mix and standard 806R.
- PCR Mix: 1X high-fidelity polymerase buffer, 200 µM dNTPs, 2.5 U polymerase.
- Cycling: Initial denaturation 95°C/3min; 10x touch-down cycles (95°C/30s, 60-55°C/30s, 72°C/45s); 20x standard cycles (95°C/30s, 55°C/30s, 72°C/45s); final extension 72°C/5min.
- Sequencing & Analysis: Purify amplicons, prepare Illumina library, sequence on MiSeq (2x300). Process with DADA2 in QIIME2 and compare observed proportions to known mock community composition.
FAQ 2: Tailored Panel Sensitivity for Low-Biomass Samples Q: My environmental samples suspected to contain Marinisomatota have very low biomass. My broad-range 16S primers fail to generate sufficient product. How can a tailored panel help?
A: Broad-range primers can be outcompeted by host or dominant community DNA. A tailored nested or semi-nested PCR panel significantly increases sensitivity for target taxa.
- First-Round PCR: Use a Marinisomatota-specific primer pair targeting a larger, more variable region (e.g., V1-V3). This selectively enriches target template.
- Second-Round PCR: Use 1 µL of the first-round product as template with your standard 341F/806R primers (with Illumina adapters) to generate the sequencer-compatible amplicon.
- Incorporate Barcodes: Add sample-specific barcodes/indexes only in the second round to minimize index switching errors. The workflow is detailed in Diagram 1.
Diagram 1: Nested PCR Workflow for Low-Biomass Targets
FAQ 3: Addressing Chimera Formation with Modified Polymerase Blends Q: My amplicon sequencing of complex marine samples shows an unusually high rate of chimera formation, complicuting Marinisomatota phylogeny. Could primer formulation be a factor?
A: Yes. Primer degeneracy and unbalanced primer mixtures can cause incomplete extension and increase chimera formation. This is exacerbated in samples with complex, uneven templates.
- Solution: Combine primer tweaks with a high-fidelity polymerase blend containing a proofreading enzyme and a non-proofreading enzyme (e.g., a blend of Pfu and Taq). The proofreading enzyme increases fidelity and processivity, while the Taq helps with difficult-to-amplify templates and adds A-overhangs for cloning. See Table 2 for reagent solutions.
Table 2: Research Reagent Solutions for Bias Mitigation
| Reagent / Material | Function / Rationale | Example Product / Specification |
|---|---|---|
| Modified Primer Mix (Tweaked) | Reduces degeneracy complexity, improves specificity for target clades (e.g., Marinisomatota). | Custom synthesis, HPLC-purified, 4-sequence mix for 341F region. |
| High-Fidelity Polymerase Blend | Minimizes PCR errors and reduces chimera formation during amplification of complex communities. | Q5 High-Fidelity 2X Master Mix (NEB) or Platinum SuperFi II (Thermo Fisher). |
| Mock Microbial Community | Gold-standard control for quantifying and correcting for primer-induced amplification bias. | ZymoBIOMICS Microbial Community Standard (with known composition). |
| Inosine or Universal Bases | Replaces degenerate positions to stabilize priming while accepting mismatches. | Primer synthesized with inosine at ambiguous positions (e.g., N). |
| Magnetic Bead Cleanup System | For strict size selection to remove primer dimers and non-specific products that contribute to bias. | SPRIselect beads (Beckman Coulter) for 0.8x-1.0x dual-sided selection. |
Experimental Protocol for Chimera Rate Assessment:
- Parallel Amplification: Amplify your sample and the mock community using your standard protocol and the new protocol (tweaked primers + polymerase blend).
- Sequencing: Sequence both libraries on the same MiSeq run to minimize run-to-run variation.
- Bioinformatic Pipeline: Process sequences through DADA2 or USEARCH for ASV calling. Use the
uchime2_reforremoveBimeraDenovofunction specifically. - Quantification: Calculate chimera rate as:
(Number of chimeric sequences / Total number of sequences) * 100. Compare rates between protocols. The decision logic for troubleshooting high chimera rates is shown in Diagram 2.
Diagram 2: Chimera Troubleshooting Decision Tree
Troubleshooting Guides & FAQs
Q1: We are studying the phylum Marinisomatota via amplicon sequencing but observe consistent underrepresentation in our 16S rRNA gene data. Could PCR bias be the cause, and what are our alternative targets? A: Yes, this is a classic sign of PCR bias due to primer mismatches. For Marinisomatota, the variable regions of the 16S gene may have sequences divergent from "universal" primer binding sites. Alternative targets include:
- 23S rRNA Gene: Larger size (~2.9 kb) offers more phylogenetic information and potentially different primer binding sites that may be more conserved for your target. However, its length makes full-length amplification from complex communities challenging.
- Single-Copy Marker Genes (e.g., rpoB, dnaK): These protein-coding genes are present as single copies in bacterial genomes, eliminating the intra-genomic copy number variation issue of rRNA operons. This allows for more accurate quantitative estimates. The trade-off is significantly lower sequencing depth in complex samples due to their lower abundance.
Q2: When designing primers for 23S rRNA gene amplification, what region should I target, and what are the common pitfalls? A: Target a hypervariable region, such as domains II or III. A common choice is amplifying a ~500 bp fragment. The primary pitfall is the lack of comprehensive databases compared to 16S, making taxonomic assignment harder. You must also verify that your chosen primers do not amplify eukaryotic (e.g., host) rRNA.
- Troubleshooting Step: Always run an in-silico PCR check against databases like SILVA LSU and a host genome (if applicable) to check specificity and predicted amplicon length.
Q3: We switched to amplifying the rpoB gene, but our yield is very low and community profiles are noisy. What could be wrong? A: Single-copy genes exist at a much lower template concentration than multi-copy 16S rRNA genes. Low yield and high stochasticity are common.
- Solution 1: Increase the number of PCR cycles cautiously (e.g., from 30 to 35), but be aware this may increase chimera formation.
- Solution 2: Optimize annealing temperature using a gradient PCR. Protein-coding genes often require higher annealing temperatures than 16S rRNA gene primers.
- Solution 3: Increase the amount of input genomic DNA (e.g., from 1 ng to 10-20 ng per reaction) if sample concentration allows.
Q4: How do I analyze sequencing data from alternative targets like rpoB? The 16S pipelines don't work. A: Standard 16S pipelines (QIIME2, mothur) are not suitable. You require:
- A custom reference database: Compile a curated database of your target gene (e.g., rpoB) sequences from public genomes or repositories.
- A general amplicon analysis tool: Use tools like USEARCH or DADA2 for denoising and generating ASVs, then assign taxonomy via BLAST+ or HMMER against your custom database.
- Phylogenetic tree inference: Construct a reference tree for diversity analyses (UniFrac) since de novo trees for single-copy genes are more reliable than for 16S.
Table 1: Comparison of 16S rRNA, 23S rRNA, and Single-Copy Gene Targets
| Feature | 16S rRNA Gene | 23S rRNA Gene | Single-Copy Gene (e.g., rpoB) |
|---|---|---|---|
| Typical Amplicon Length | 300-500 bp (V3-V4) | 500-600 bp (Domain II) | 300-600 bp |
| Copy Number per Genome | 1-15 (varies by taxon) | 1-15 (correlates with 16S) | 1 |
| Phylogenetic Resolution | Moderate (Genus/Species) | High (Species/Strain) | Very High (Strain level) |
| PCR Bias Risk | High (Well-documented) | Moderate (Less studied) | Lower (Different primer sites) |
| Database Completeness | Excellent (SILVA, Greengenes) | Good (SILVA LSU, RDP) | Poor (Requires custom curation) |
| Relative Abundance Estimation | Skewed by copy number | Skewed by copy number | Theoretically accurate |
| Best for Marinisomatota Research | Problematic if biased | Good alternative if primers match | Best for quantitative accuracy |
Experimental Protocols
Protocol 1: Assessing Primer Specificity for Marinisomatota
- In-silico Evaluation: Use TestPrime or primerBLAST against the SILVA SSU/LSU Ref NR database. Filter for phylum Marinisomatota and calculate coverage.
- Wet-Lab Validation: Perform PCR on DNA from a mock community containing known Marinisomatota isolates and closely related phyla. Run gel electrophoresis to check for correct, single-band amplification.
- Clone and Sanger Sequence: Confirm amplicon identity from the mock community.
Protocol 2: Amplification & Sequencing of rpoB Gene Fragments
- Primer Selection: Use degenerate primers targeting a conserved region (e.g., rpoB-1: GGCAAGGTCACCCGAACAG, rpoB-2: TTGACCTTCGGMACCATCAT).
- PCR Mix (50 µL):
- 10-20 ng genomic DNA
- 1X High-Fidelity PCR Buffer
- 0.2 mM each dNTP
- 0.5 µM each forward/reverse primer
- 1 U High-Fidelity DNA Polymerase
- Thermocycler Conditions:
- 95°C for 3 min
- 35 cycles: 95°C for 30s, 58°C for 45s, 72°C for 60s
- 72°C for 5 min
- Purification & Library Prep: Purify PCR product with magnetic beads. Use a standard dual-indexing Illumina library preparation kit, following the manufacturer's protocol for amplicons.
Diagrams
Title: Alternative Amplicon Target Workflow
Title: PCR Bias Causes & Alternative Solutions
The Scientist's Toolkit: Research Reagent Solutions
| Item | Function in This Context |
|---|---|
| High-Fidelity DNA Polymerase | Crucial for accurate amplification of longer or low-abundance targets (23S, rpoB) with low error rates. |
| Mock Community with Marinisomatota | Essential positive control to validate primer specificity and assess bias. |
| Magnetic Bead Cleanup Kits | For consistent PCR product purification before library preparation. |
| Dual-Indexed Illumina Index Primers | Allows multiplexing of samples when sequencing low-abundance single-copy gene amplicons to increase throughput. |
| SILVA SSU & LSU Ref NR Databases | Reference databases for in-silico primer evaluation and 16S/23S taxonomy assignment. |
| Custom rpoB (or other) HMM Profile | A Hidden Markov Model profile built from aligned sequences enables more sensitive homology detection in custom databases. |
Protocol Standardization and Replication to Control for Technical Variability
Technical Support Center: Troubleshooting PCR and 16S Amplification forMarinisomatotaResearch
Frequently Asked Questions (FAQs)
Q1: In our 16S rRNA gene amplicon sequencing for Marinisomatota profiling, we observe high variability between technical replicates. What are the primary sources of this technical variability?
A1: The primary sources are often pre-sequencing steps. Key variability drivers include:
- DNA Extraction Efficiency: Differential lysis of community members and inhibitor carryover.
- PCR Amplification Bias: Primers may anneal with varying efficiency to different 16S gene variants, disproportionately amplifying certain sequences. The Marinisomatota 16S gene sequence may be differentially amplified.
- PCR Cycle Number: Excessive cycles exacerbate minor initial amplification differences and generate chimeras.
- Reagent Lot Inconsistencies: Variations in polymerase fidelity, primer synthesis purity, and master mix composition.
- Low Template Input: Using very low DNA concentrations increases stochastic amplification effects.
Q2: Our negative controls (no-template) occasionally show amplification, suggesting contamination. How can we identify the source and prevent it?
A2:
- Identify Source: Run a contamination audit. Include separate negative controls for:
- DNA extraction (blank extraction control).
- PCR master mix preparation (water control).
- Post-PCR handling. Sequence these controls. BLAST the sequences to identify contaminants (common lab bacteria, kit flora, or previously amplified products).
- Preventative Actions:
- Use dedicated, separated pre- and post-PCR labs.
- Use UV-irradiated hoods for PCR setup.
- Use filter pipette tips.
- Aliquot all reagents (polymerase, primers, water).
- Treat pre-PCR materials with dUTP and Uracil-DNA Glycosylase (UDG) to degrade carryover amplicons.
Q3: We suspect our universal 16S primers are biased against Marinisomatota. How can we test and mitigate this?
A3:
- In Silico Testing: Use tools like TestPrime (Silva) or ProbeMatch to check primer binding site matches against Marinisomatota 16S sequences in databases. Mismatches at the 3' end are critical.
- Wet Lab Testing: Perform qPCR with the universal primer set and a Marinisomatota-specific primer set (if available) on a mock community containing a known Marinisomatota isolate. Compare the relative quantification.
- Mitigation Strategies:
- Consider using multiple primer sets (e.g., 27F/534R and 515F/806R) and compare results.
- Use a low annealing temperature in the initial PCR cycles ("touchdown PCR") to promote binding to mismatched templates.
- Reduce PCR cycles to minimize bias amplification.
Q4: How does the choice of DNA polymerase influence bias in 16S community profiling?
A4: Polymerases differ in processivity, fidelity, and mismatch extension rate, impacting community representation.
Table 1: Impact of Common DNA Polymerases on 16S Amplification Bias
| Polymerase Type | Common Example(s) | Key Characteristics | Impact on 16S Community Bias |
|---|---|---|---|
| Standard Taq | Taq DNA Polymerase | Low fidelity, high processivity, no proofreading. | Higher risk of chimera formation and mismatch extension, potentially skewing abundance. |
| High-Fidelity | Phusion, Q5 | 3'→5' exonuclease (proofreading) activity, high fidelity. | Lower error rates but may have slower kinetics, potentially favoring easily amplifiable templates. |
| Polymerase for GC-Rich Targets | GC-rich kits (e.g., from Roche, Takara) | Contains additives to melt secondary structures. | Can improve amplification of high-GC content genomes (common in some bacteria), reducing bias. |
Experimental Protocols for Standardization
Protocol 1: Standardized DNA Extraction from Complex Microbial Communities for 16S Analysis
Objective: To minimize bias during cell lysis and DNA purification.
- Sample Homogenization: Use a defined mechanical lysis method (e.g., bead-beating with 0.1mm zirconia/silica beads) for a fixed time (e.g., 90 seconds) and frequency.
- Inhibitor Removal: Include a standardized inhibitor removal step (e.g., use of a kit-specific wash buffer or a chemical treatment like PVPP).
- Elution Volume: Elute DNA in a consistent volume of low-EDTA TE buffer or nuclease-free water (e.g., 50 µL).
- Quantification: Use a fluorometric method (e.g., Qubit) over spectrophotometry (A260/A280) for accurate quantitation of low-concentration, potentially contaminated samples.
- Storage: Store aliquots at -80°C to prevent degradation. Avoid repeated freeze-thaw cycles.
Protocol 2: Minimized-Bias 16S rRNA Gene Amplification PCR
Objective: To generate amplicons for sequencing that accurately represent the original community.
- Primer Selection: Use well-characterized, barcoded primer pairs (e.g., 341F-805R targeting the V3-V4 region). Verify in silico coverage.
- PCR Reaction Setup:
- Template Input: Use a standardized amount of DNA (e.g., 10 ng) within the kit's linear range. If below, note the Cq value.
- Master Mix: Prepare a single master mix for all samples in a study batch to reduce pipetting error.
- Polymerase: Use a high-fidelity polymerase with proofreading.
- Replicates: Perform at least triplicate PCR reactions per sample.
- PCR Cycling Conditions:
- Initial Denaturation: 95°C for 3 min.
- Number of Cycles: Limit to 25-27 cycles. (Critical for reducing bias)
- Denature: 95°C for 30 sec.
- Anneal: 55°C for 30 sec (optimize based on primer Tm).
- Extend: 72°C for 45 sec/kb.
- Final Extension: 72°C for 5 min.
- Pooling & Purification: Pool triplicate reactions, then purify using a size-selective magnetic bead clean-up (e.g., AMPure XP beads) at a consistent bead-to-sample ratio (e.g., 0.8X).
The Scientist's Toolkit: Research Reagent Solutions
Table 2: Essential Materials for Controlled 16S rRNA Gene Sequencing Studies
| Item | Function & Rationale |
|---|---|
| Zirconia/Silica Beads (0.1mm) | Provides effective mechanical lysis for a wide range of cell wall types in microbial communities, including Gram-positives. |
| Magnetic Bead-based DNA Clean-up Kits (e.g., AMPure XP) | Size-selective purification removes primer dimers and large contaminants. Consistent ratio application is key for reproducible yield. |
| High-Fidelity PCR Master Mix (e.g., Q5 Hot Start) | Reduces PCR errors and chimera formation, improving sequence fidelity and reducing one source of bias. |
| Quant-iT PicoGreen or Qubit dsDNA HS Assay | Fluorometric assays specific for dsDNA, providing accurate quantitation for input normalization despite RNA or salt contamination. |
| Mock Microbial Community (e.g., ZymoBIOMICS) | Defined mix of known bacterial genomes. Served as a positive control and internal standard to quantify technical bias and batch effects. |
| Duplex-Specific Nuclease (DSN) | Can be used to normalize abundant sequences (like host DNA in host-associated samples) to better reveal rare community members. |
Experimental Workflow Diagrams
Diagram 1: Standardized 16S Amplicon Sequencing Workflow
Diagram 2: How Technical Variability Leads to PCR Bias
Diagnosing and Correcting Marinisomatota Detection Issues in Your Data
Technical Support Center
FAQs & Troubleshooting Guides
Q1: My 16S rRNA gene amplicon study consistently shows very low or zero abundance of Marinisomatota, even in marine sediment samples where they are expected. What are the primary sources of this bias?
A: The underrepresentation is likely due to a combination of primer mismatch and suboptimal PCR conditions. Marinisomatota (formerly SAR406) possess 16S rRNA gene sequences with notable mismatches to commonly used "universal" primers. The most critical issues are:
- Primer Mismatch: The 341F/806R (515F/806R) primer pair, common for Illumina MiSeq V3-V4 regions, has a 3' terminal mismatch in the 806R primer for many Marinisomatota, drastically reducing amplification efficiency.
- GC-Content: The 16S genes of Marinisomatota often have higher-than-average GC content (~55-60%), which can lead to inefficient denaturation and annealing under standard PCR protocols.
- PCR Cycle Number: Excessive cycle numbers (>30) exacerbate bias against taxa with primer mismatches, favoring well-amplified community members.
Troubleshooting Protocol: In Silico Primer Evaluation
- Download a curated set of Marinisomatota 16S rRNA gene sequences from SILVA or GTDB.
- Align your primer sequences (e.g., 341F, 806R) to this set using
usearch -search_pcror theecoPCRtool. - Output: Pay close attention to mismatches, especially within the last 5 bases at the 3' end. Count the number of matched sequences.
- Compare results with primers from other regions (e.g., V4-V5 with 515F/926R) which may offer better coverage.
Table 1: In Silico Match Rates of Common Primer Pairs to Marinisomatota (GTDB r214)
| Primer Pair (Target Region) | Reference | Average 3' Mismatches | Percentage of Full-Length Sequences Matched |
|---|---|---|---|
| 341F / 806R (V3-V4) | Klindworth et al. (2013) | 1.8 (806R critical) | 23% |
| 515F / 806R (V4) | Apprill et al. (2015) | 1.7 (806R critical) | 25% |
| 515F / 926R (V4-V5) | Parada et al. (2016) | 0.3 | 94% |
| 27F / 1492R (Full Length) | Lane (1991) | Varies | ~99% |
Q2: How can I modify my wet-lab protocol to mitigate PCR bias against Marinisomatota?
A: Implement a multi-primer approach and optimize PCR conditions for high-GC targets.
Experimental Protocol: Bias-Reduced 16S rRNA Gene Amplification Reagents: High-fidelity polymerase (e.g., Q5 Hot Start), DMSO, Betaine, mixed primer set. Procedure:
- Primer Selection: Use an equimolar mix of forward primers 341F and 515F, and reverse primers 806R and 926R. This broadens phylogenetic coverage.
- PCR Reaction Setup (50 µL):
- Template DNA: 10-30 ng
- Q5 Hot Start Master Mix: 25 µL
- Forward Primer Mix (10 µM): 2.5 µL
- Reverse Primer Mix (10 µM): 2.5 µL
- DMSO: 2.5 µL (5% final)
- Betaine (5M stock): 5 µL (0.5M final)
- Nuclease-free H(_2)O to 50 µL
- Thermocycling Conditions:
- 98°C for 30 s (initial denaturation)
- 25-28 cycles of:
- 98°C for 10 s (denaturation)
- 50°C for 30 s (lowered annealing)
- 72°C for 30 s (extension)
- 72°C for 2 min (final extension)
- Hold at 4°C. Note: The lower annealing temperature accommodates minor primer mismatches, while DMSO and Betaine assist in denaturing high-GC templates. Limiting cycles reduces bias.
Q3: During bioinformatic analysis, what are the specific quality control and taxonomic assignment red flags I should monitor regarding Marinisomatota?
A: Red flags include high rates of unclassified reads at the phylum level and discrepancies between different reference databases.
Troubleshooting Guide: Bioinformatic QC Steps
- Database Choice: The default Greengenes or Silva 132 databases may have poor representation. Action: Use the latest GTDB (Genome Taxonomy Database) release for classification, as it includes a more comprehensive and updated phylogeny for candidate phyla like Marinisomatota.
- Unclassified Reads: If a large proportion of reads remain "Unclassified" at the phylum level after processing marine samples, suspect missing Marinisomatota. Action: BLAST a subset of these unclassified reads against the NT database. Look for hits to "Marinisomatota" or "SAR406".
- ASV/OTU Clustering: De-novo clustering at 97% identity may incorrectly split diverse Marinisomatota. Action: Use closed-reference clustering against a comprehensive database or DADA2/Deblur to resolve finer sequence variants without losing reference context.
Table 2: Comparison of Database Representation for Marinisomatota
| Database (Version) | Number of Marinisomatota Representative Sequences/Genomes | Recommended Classifier | Key Note |
|---|---|---|---|
| SILVA (v138.1) | ~500 SSU Ref NR sequences | DADA2, QIIME2 | Good representation but taxonomy may be outdated. |
| GTDB (r214) | ~1,100 bacterial and archaeal genomes | QIIME2 (feature-classifier), GTDB-Tk | Genome-based, phylogenetically consistent. |
| Greengenes (13_8) | < 50 OTUs | Not Recommended | Severely underrepresented. |
The Scientist's Toolkit: Key Research Reagent Solutions
| Item | Function & Rationale |
|---|---|
| Q5 Hot Start High-Fidelity DNA Polymerase | Reduces PCR errors and non-specific amplification during the initial low-stringency cycles required for diverse primer binding. |
| DMSO (Dimethyl Sulfoxide) | A PCR additive that aids in denaturing high-GC-content DNA templates, like those from Marinisomatota, by lowering melting temperature. |
| Betaine | Another PCR additive that equalizes the melting temperatures of DNA strands, promoting more uniform amplification of sequences with varying GC content. |
| Mixed Primer Cocktail (e.g., 341F/515F + 806R/926R) | Broadens phylogenetic coverage by mitigating the impact of primer-binding site mutations present in any single primer pair. |
| GTDB Reference Database & GTDB-Tk Toolkit | Provides an up-to-date, genome-based taxonomic framework essential for accurate classification of understudied phyla. |
| ZymoBIOMICS Microbial Community Standard | A defined mock community used as a positive control to validate that your modified protocol recovers expected diversity, including difficult-to-amplify taxa. |
Diagram 1: PCR Bias Identification Workflow
Diagram 2: Primer Mismatch Impact on Amplification
Technical Support Center
Frequently Asked Questions (FAQs)
Q1: My in silico PCR tool (like ecoPCR, PrimerProspector) predicts zero matches for my primer set against the Marinisomatota phylum in the GTDB or SILVA database. What should I do? A: This typically indicates a primer sequence mismatch. First, verify you are using the correct primer name and full sequence (e.g., 27F: AGAGTTTGATCMTGGCTCAG). Second, check which database version and taxonomy file your tool is using; Marinisomatota is a recently established phylum (formerly SAR406 clade) and may be absent or under a different label (e.g., "Marinimicrobia") in older references. Update to the latest GTDB (R214) or SILVA (v138.1) taxonomy. Manually BLAST your primer against NCBI's 16S rRNA sequences from Marinisomatota to confirm true mismatches.
Q2: How do I interpret the "mismatch" and "amplicon length" output from an in silico PCR evaluation, and what are acceptable thresholds for minimizing 16S PCR bias? A: Tools report the position and type (e.g., A-C) of mismatches. The table below summarizes critical thresholds:
Table 1: Interpretation of In Silico PCR Output Parameters
| Parameter | Optimal/Desired Outcome | Concerning Outcome | Impact on PCR Bias |
|---|---|---|---|
| 3'-End Mismatches | Zero mismatches within last 3-5 bases. | ≥1 mismatch in last 3 bases. | High: Dramatically reduces/prevents elongation, causing severe under-representation. |
| Total Mismatches | ≤2-3 mismatches per primer. | >4 mismatches, especially if clustered. | Medium: Reduces priming efficiency, favoring better-matched phyla. |
| Amplicon Length | Consistent length (~100-500 bp) across target phyla. | High variability (>200 bp difference) or extremely long/short. | High: Length bias during PCR and sequencing; very long amplicons may not amplify. |
| Predicted Binding | High efficiency (>95%) across target phylum. | Binding efficiency < 70% for a phylum. | High: Indicates primer bias, leading to under-amplification of that group. |
Q3: I am evaluating primer bias for Marinisomatota in a complex marine microbiome. Which in silico tool and database combination is most recommended? A: For comprehensive evaluation, a two-step pipeline is recommended:
- ecoPCR (OBITools suite): Use with the GTDB reference database (R214). GTDB offers a phylogenetically consistent taxonomy including Marinisomatota. ecoPCR simulates PCR with user-defined mismatch tolerances.
- TestPrime (QIIME 2 plugin): Use with the SILVA 138.1 SSU Ref NR 99 database. This provides a complementary, high-quality alignment-based analysis and taxon-specific hit information.
Table 2: Comparison of In Silico PCR Tool Suites
| Tool/Suite | Primary Database | Key Feature for Bias Assessment | Protocol Command Example |
|---|---|---|---|
| ecoPCR/OBITools | EMBL (converted to GTDB) | Explicit control over 3'-end mismatch rules; detailed output. | ecoPCR -d db_embl_GTDB -e 3 -l 100 -L 500 primer_F primer_R > output.ecopcr |
| PrimerProspector | GreenGenes, SILVA | Analyzes primer coverage and degeneracy. | Integrated into QIIME 1 workflows; less current. |
QIIME2 clip-* plugins |
SILVA | rescript fetches sequences, clip performs in silico PCR. |
qiime rescript get-silva-data --p-version '138.1' --p-target SSURef_NR99... then qiime clip ... |
Experimental Protocols
Protocol 1: Performing In Silico PCR Evaluation with ecoPCR and GTDB for Marinisomatota Bias Assessment
Objective: To predict the binding efficiency of universal 16S rRNA gene primers (e.g., 515F/806R) against the Marinisomatota phylum and related lineages.
Materials & Reagents:
- Hardware: Unix/Linux or macOS command-line environment.
- Software: OBITools (ecoPCR),
grep,awk. - Data: GTDB R214 16S rRNA sequence database in ecoPCR format (
gtdb_r214_ssu.fasta,gtdb_r214_taxonomy.txt).
Methodology:
- Installation: Install OBITools via conda:
conda create -n obitools -c bioconda obitools. - Database Preparation: Ensure the GTDB files are in the working directory.
- Run ecoPCR: Execute the command, allowing for 1 total mismatch but being strict on the 3' end:
-d: Database file-e: Maximum allowed errors (mismatches + indels)-t: Taxonomy file-l/-L: Min/max amplicon length.
- Filter for Marinisomatota: Parse results to isolate hits.
- Calculate Efficiency: (Total Marinisomatota hits / Total bacterial hits) * 100 = Predicted Binding Efficiency (%).
Protocol 2: Cross-Validation Using QIIME2's rescript and clip Plugins
Objective: To validate ecoPCR findings using the SILVA database and obtain taxonomic resolution of non-binding sequences.
Methodology:
- Fetch SILVA Data:
- Perform In Silico PCR:
- Analyze Bias: Merge taxonomy with the
not-amplified.qzaartifact. Filter for lineages of interest (e.g., "P__Marinisomatota") to identify which taxa are predicted to be missed.
The Scientist's Toolkit: Research Reagent Solutions
Table 3: Essential Materials for In Silico PCR and Wet-Lab Validation
| Item | Function / Purpose | Example Product / Source |
|---|---|---|
| Curated 16S rRNA Reference Database | Provides the sequence templates for in silico primer binding simulations. | GTDB R214, SILVA 138.1, EzBioCloud 16S DB. |
| In Silico PCR Software | Executes the virtual PCR algorithm based on defined parameters. | ecoPCR (OBITools), QIIME2 clip, Mothur's pcr.seqs. |
| High-Fidelity DNA Polymerase | For subsequent wet-lab validation with minimal PCR error bias. | Phusion HS II (Thermo Fisher), Q5 (NEB). |
| Mock Microbial Community | Validates in silico bias predictions with known ratios of genomes, including challenging taxa. | ZymoBIOMICS Microbial Community Standard. |
| Primer Synthesis with Purification | Ensures precise primer sequence for accurate in silico prediction and clean wet-lab PCR. | HPLC- or PAGE-purified primers (IDT, Sigma). |
| Bioinformatics Scripts (Python/R) | Automates parsing, visualization, and statistical analysis of in silico results. | Custom scripts using pandas, ggplot2, biopython. |
Workflow & Relationship Diagrams
Title: In Silico PCR Bias Evaluation Workflow
Title: Logic Chain from Primer Mismatch to PCR Bias
Troubleshooting Guides & FAQs
Q1: During spiking experiments for 16S amplification bias assessment, we observe inconsistent recovery of the Marinisomatota spike-in control across replicates. What are the primary causes?
A: Inconsistent recovery typically stems from three areas: 1) Spike-in Preparation: Improper quantification or degradation of the synthetic Marinisomatota 16S rRNA gene standard. Verify concentration via fluorometry (e.g., Qubit) and integrity via gel electrophoresis. 2) Primer Bias: Your primer set may have poor affinity for the Marinisomatota sequence. Check in silico alignment (e.g., using TestPrime on SILVA) and consider using a validated primer-adapter spike-in. 3) PCR Inhibition: Co-purified inhibitors from the sample matrix disproportionately affect amplification efficiency. Implement a dilution series or use an inhibition-resistant polymerase mix.
Q2: Our mock community (e.g., ZymoBIOMICS, ATCC MSA-1000) results show significant deviation from the expected composition, particularly for low-abundance members. Is this PCR bias or an issue with our library prep?
A: It is likely a combination. Follow this diagnostic flowchart:
Table 1: Diagnostic Steps for Mock Community Deviation
| Step | Action | Expected Outcome if Problem is Absent |
|---|---|---|
| 1. DNA QC | Verify input mock community DNA integrity and concentration via Bioanalyzer/TapeStation and fluorometry. | High-molecular-weight DNA, concentration matches vendor specification. |
| 2. Cycle Optimization | Run a gradient PCR (e.g., 22-30 cycles) on the mock community alone. | Observed community profile stabilizes and does not shift dramatically with cycle number. |
| 3. Spike-in Addition | Add a known quantity of a non-community Marinisomatota spike to the mock community DNA before PCR. | The spike-in recovery is consistent and within expected quantitative range. |
| 4. Bioinformatics Control | Process a vendor-provided sequencing dataset for the same mock community through your pipeline. | Pipeline output matches vendor's expected profile. |
Q3: How do we differentiate bias introduced during DNA extraction versus bias from 16S PCR amplification?
A: A two-stage spiking experimental design is required.
Experimental Protocol: Differential Bias Assessment
- Pre-Lysis Spike: Add a known amount of intact, exogenous cells (e.g., Pseudomonas putida KT2440) to your sample before DNA extraction. This controls for lysis efficiency and extraction bias.
- Post-Extraction Spike: Add a known amount of purified genomic DNA (e.g., from a Marinisomatota member) to the extracted DNA before PCR amplification. This controls for PCR amplification bias.
- Quantification: Use qPCR with specific primers for each spike to calculate recovery efficiency at each stage.
- Analysis: Low recovery of the pre-lysis spike indicates extraction bias. Low recovery of the post-extraction spike, but not the pre-lysis spike, indicates PCR amplification bias.
Q4: For Marinisomatota-specific research, are there recommended mock community controls that include members of this phylum?
A: Most commercial mock communities do not yet include Marinisomatota. You must create an in-house augmented mock community.
- Base Community: Use a well-defined community like ZymoBIOMICS Microbial Community Standard (D6300).
- Augmentation: Spike in a quantified genomic DNA from a Marinisomatota type strain (e.g., Marinisoma spp.) at a defined, low-abundance percentage (e.g., 0.5-1% of total DNA).
- Validation: Sequence the augmented mock community alongside your samples in every run to track run-to-run variation in Marinisomatota detection.
Visualization: Experimental Workflows
Title: Workflow for Validating 16S PCR Bias
Title: Key Sources of Bias in 16S rRNA Sequencing
The Scientist's Toolkit: Research Reagent Solutions
Table 2: Essential Reagents for Spiking & Mock Community Experiments
| Item | Function | Example/Best Practice |
|---|---|---|
| Synthetic 16S Spike-in (gBlocks, Oligos) | Provides an absolute quantitative standard unaffected by extraction. Ideal for Marinisomatota-specific bias assays. | Design a ~1200bp gBlock matching your primer region but containing a unique "barcode" region for bioinformatic recovery. |
| Whole-Cell Spike-in Control | Controls for DNA extraction efficiency and lysis bias. | Use a defined, non-target organism like Pseudomonas putida or Bacillus subtilis at a known CFU. |
| Characterized Mock Community (Genomic DNA) | Gold standard for assessing total workflow bias from extraction to sequencing. | ATCC MSA-1000 (20 strains) or ZymoBIOMICS D6300 (8 strains). Use to normalize run-to-run variation. |
| Inhibition-Resistant Polymerase Mix | Reduces PCR bias from co-purified inhibitors in complex samples (e.g., soil, stool). | KAPA HiFi HotStart ReadyMix (Roche) or Q5 High-Fidelity DNA Polymerase (NEB). |
| High-Sensitivity DNA Quantification Kit | Accurate measurement of low-abundance spike-ins and mock community inputs. | Qubit dsDNA HS Assay (Thermo Fisher) or Quant-iT PicoGreen (Invitrogen). |
| Standardized 16S rRNA Gene Primer Set with Adapters | Ensures consistent amplification and direct compatibility with library prep. | 515F/806R (Earth Microbiome Project) or 27F/1492R, pre-tailed with Illumina adapters. |
| Bioinformatic Spike-in Reference Database | Allows accurate mapping and quantification of spike-in sequences in silico. | Create a custom FASTA file containing the exact sequences of all your spike-ins and mock community members. |
Technical Support Center
Troubleshooting Guide
Issue 1: Post-Denoising, Expected Rare Taxa from Marinisomatota Are Not Present in ASV/OTU Table Q: After running DADA2 or Deblur, my feature table does not contain the low-abundance Marinisomatota sequences I anticipate from my mock community controls. What steps should I take? A: This is a classic symptom of overly aggressive denoising or incorrect parameter settings that disproportionately affect rare sequences.
- Verify Denoising Parameters: For DADA2, the critical parameter is
truncQ. LoweringtruncQ(e.g., from 2 to 0) makes the algorithm less likely to discard reads based on quality scores, preserving more rare sequences. For Deblur, review themin-readsandmin-sizeparameters, which can remove low-abundance features. - Inspect Read Quality Profiles: Use
plotQualityProfilein DADA2 to visualize your forward and reverse reads. Ensure you are not truncating (truncLen) too early, which may remove informative regions critical for distinguishing rare taxa. - Adjust Chimera Detection: Temporarily disable chimera removal (e.g.,
removeBimeraDenovoin DADA2) or use a more permissive method to confirm your target sequences are not being misclassified as chimeras. - Protocol Step: Re-run denoising with a permissive parameter set on a subset of samples. Compare the output to the default. The table below summarizes the key parameter adjustments.
Table 1: Parameter Adjustment for Rare Taxa Preservation in Denoising Algorithms
| Algorithm | Default Parameter (Typical Value) | Adjusted Parameter for Rare Taxa | Rationale |
|---|---|---|---|
| DADA2 | truncQ = 2 |
truncQ = 0 |
Reduces quality-based filtering, retaining reads with more errors that may represent rare organisms. |
| DADA2 | maxEE = c(2, 5) (Fwd, Rev) |
maxEE = c(4, 8) or higher |
Increases the allowed maximum expected errors, preventing the discard of reads from lower-quality sequencing cycles. |
| Deblur | min-reads = 10 |
min-reads = 2 |
Lowers the minimum occurrence for a sequence to be retained, directly preserving low-abundance features. |
| Deblur | min-size = 10 |
min-size = 2 |
Similar to min-reads, applied during positive filtering. |
Issue 2: Clustering with VSEARCH/UCLUST Groups Rare Marinisomatota OTUs with Abundant Taxa Q: When I cluster my sequences at 97% similarity, my target rare Marinisomatota OTUs are absorbed into larger, more common OTUs (e.g., from Proteobacteria). How can I improve resolution? A: This indicates that clustering parameters or pre-processing steps are not sensitive enough to sequence differences.
- Pre-Filter Your Database: Before clustering, create a reference set that excludes highly abundant taxa from your specific experiment to reduce "swamping" during centroid selection.
- Use De Novo Clustering with Care: For de novo OTU picking, consider using the
--cluster_sizecommand in VSEARCH with the--sizeorderflag disabled, so clustering is not biased by abundance. - Protocol Step - Reference-Based Sorting: Prior to de novo clustering, perform a stringent reference-based search against a curated Marinisomatota database. Extract and cluster these reads separately, then merge results.
- Increase Clustering Stringency: A slight increase in similarity threshold (e.g., 99%) may help separate closely related but distinct rare taxa, though it may increase overall OTU count.
Table 2: Impact of Clustering Strategy on Rare Taxa Recovery
| Clustering Method | Typical Command/Parameter | Risk for Rare Taxa | Mitigation Strategy |
|---|---|---|---|
| Open-Reference (VSEARCH) | --id 0.97 --sizeorder |
High abundance sequences selected as centroids, rare variants merged into them. | Disable --sizeorder. Use --id 0.99. Perform initial reference pass with specific database. |
| De Novo (VSEARCH) | --cluster_size --id 0.97 |
Same as above. Clusters built around abundant seeds. | Use --cluster_smallmem which processes sequences in input order, not size order. |
| DADA2 (ASVs) | dada() learned error model |
Low risk of merging. | The primary issue is denoising (see above), not clustering. ASVs inherently resolve single-nucleotide differences. |
Issue 3: PCR Bias Controls Indicate Marinisomatota Under-Representation Despite Pipeline Adjustments Q: My spike-in controls show consistent under-amplification of Marinisomatota 16S rRNA gene regions, even with optimized bioinformatic parameters. What wet-lab adjustments are relevant? A: This points to primer bias, which is a wet-lab issue that bioinformatics cannot fully correct.
- Primer Evaluation: Analyze the binding region of your primers (e.g., 515F/806R) against Marinisomatota genomes. Mismatches, especially near the 3' end, cause severe amplification bias.
- Alternative Primer Sets: Consider using a primer set with demonstrated efficacy for phyla like Marinisomatota (e.g., those from the Earth Microbiome Project).
- Protocol Step - Touchdown PCR: Implement a touchdown PCR protocol to increase specificity and yield for taxa with primer mismatches.
- PCR Cycle Reduction: Lower the number of PCR cycles to reduce the "jackpot effect" where dominant templates out-compete rare ones.
Frequently Asked Questions (FAQs)
Q: Should I use OTUs (clustered at 97%) or ASVs for studying rare taxa like Marinisomatota? A: ASVs are generally superior for rare taxa research. They resolve single-nucleotide differences, preventing the merging of a rare variant into an OTU defined by an abundant sequence. This provides higher resolution for tracking low-abundance lineages. The primary challenge with ASVs is ensuring the denoising algorithm (DADA2, Deblur) is parameterized to retain them.
Q: How many sequences per sample are needed to reliably detect rare Marinisomatota? A: Detection is stochastic. If a taxon constitutes 0.01% of a community, you would need, on average, 100,000 sequences to observe 10 reads of that taxon. For robust statistical analysis beyond mere presence, deeper sequencing (150,000-200,000 reads per sample) and sufficient sample replication are critical.
Q: What is the best way to validate that my pipeline adjustments are truly recovering Marinisomatota? A: Use a mock community with known, quantified members that include a Marinisomatota strain or a close phylogenetic relative at a low, predetermined abundance (e.g., 0.1-1%). Process this mock community through your entire wet-lab and computational pipeline. Calculate recovery metrics (presence/absence, relative abundance accuracy) for the target organism.
Q: How does research on PCR bias in 16S amplification inform my parameter choices for Marinisomatota?
A: The thesis context of PCR bias highlights that sequence abundance in your data is a distorted reflection of true biological abundance. Therefore, bioinformatic parameters that aggressively filter or cluster based on abundance (e.g., min-reads, --sizeorder) will exacerbate this bias. Your pipeline must be tuned for inclusivity over noise reduction to study these affected taxa.
Experimental Protocol: Validating Rare Taxa Recovery
Title: Protocol for Benchmarking Denoising/Clustering Parameters Using a Defined Mock Community.
Objective: To empirically determine the optimal bioinformatic pipeline parameters for recovering low-abundance Marinisomatota-like sequences.
Materials: (See "Research Reagent Solutions" below). Method:
- Sample Preparation: Use a commercial mock community (e.g., ZymoBIOMICS Microbial Community Standard) spiked with a Marinisomatota genome or a synthetic 16S gene sequence at 0.5% concentration.
- Sequencing: Perform 16S rRNA gene amplicon sequencing (V4 region) on the MiSeq/HiSeq platform with 2x250 bp paired-end reads. Include a minimum of 5 technical replicates.
- Bioinformatic Processing:
- Demultiplexing: Use
q2-demuxorcutadapt. - Parameter Testing: Run the denoising and clustering steps in parallel with different parameter sets (See Table 1 & 2).
- Set A (Strict): Default parameters.
- Set B (Permissive): Adjusted for rare taxa (e.g.,
truncQ=0,min-reads=2). - Set C (ASV-based): DADA2 with permissive
maxEE.
- Demultiplexing: Use
- Analysis:
- Generate feature tables and taxonomic assignments for each parameter set.
- Metric Calculation: For the Marinisomatota spike-in, calculate:
- Detection Rate: Proportion of replicates where the taxon is present.
- Abundance Recovery: (Observed Relative Abundance / Expected 0.5%) * 100.
- Error Rate: Measure of spurious sequences introduced by permissive settings.
Visualizations
Title: Bioinformatics Pipeline Decision Points for Rare Taxa
Title: Sources of Bias Affecting Rare Taxa Detection
Research Reagent Solutions
Table 3: Essential Materials for Rare Taxa 16S rRNA Gene Research
| Item | Function | Example/Product Note |
|---|---|---|
| Mock Community with Rare Spike-in | Gold standard for validating wet-lab and computational pipeline recovery of low-abundance targets. | ZymoBIOMICS Microbial Community Standard spiked with a known quantity of Marinisomatota gDNA. |
| Bias-Reduced PCR Polymerase | High-fidelity, low-bias polymerase can improve amplification efficiency of diverse templates. | KAPA HiFi HotStart ReadyMix, Q5 High-Fidelity DNA Polymerase. |
| Broad-Range 16S rRNA Primers | Primer sets with minimal mismatch to target phyla like Marinisomatota. | 515F/806R (Parada), or 27F/1492R for full-length analysis. |
| Positive Control gDNA | Genomic DNA from a cultured Marinisomatota member (if available) for optimization. | ATCC or DSMZ strain. |
| Bioinformatic Reference Database | Curated taxonomy database containing Marinisomatota sequences for classification. | SILVA, GTDB, or a custom database augmented with Marinisomatota genomes. |
| Sequence Processing Tools | Software allowing fine-grained parameter control for denoising and clustering. | QIIME 2 (with DADA2, Deblur, VSEARCH plugins), mothur, USEARCH. |
Troubleshooting Guides & FAQs
Section 1: 16S Amplification & PCR Bias
Q1: Our universal 16S rRNA gene primers (e.g., 27F/1492R) fail to amplify Marinisomatota sequences in our marine sediment samples. What could be the cause? A: This is a classic symptom of primer-template mismatch. Marinisomatota (formerly SAR406) have known sequence mismatches in commonly used "universal" primer binding sites. Specifically, mismatches in the 27F (E. coli position 8-9) and 519F (position 526) regions are documented, leading to severe amplification bias.
Q2: How can we quantify the PCR bias against Marinisomatota in our current protocol? A: Conduct a spike-in control experiment.
- Synthesize or clone a known 16S sequence from a characterized Marinisomatota member (e.g., from IMG/M database).
- Spike this control at a known, low ratio (e.g., 1%) into a well-characterized background genomic DNA (e.g., from a mock community).
- Perform your standard library prep and sequencing.
- Calculate the bias using the formula: Bias Factor = (Observed % Marinisomatota / Expected % Marinisomatota) A factor of <0.1 indicates strong bias.
Table 1: PCR Bias Quantification from a Spike-In Experiment
| Primer Pair Used | Expected Abundance | Observed Abundance (Mean ± SD) | Bias Factor |
|---|---|---|---|
| 27F-1492R (V1-V9) | 1.00% | 0.05% ± 0.02% | 0.05 |
| 515F-806R (V4) | 1.00% | 0.15% ± 0.05% | 0.15 |
| Marinisomatota-optimized* | 1.00% | 0.95% ± 0.10% | 0.95 |
*e.g., 390F-1290R combination (see Protocol 1).
Section 2: Marinisomatota-Specific Profiling
Q3: What are the recommended primer sets for minimizing bias against Marinisomatota in 16S amplicon studies? A: Use primer pairs that target hypervariable regions with fewer mismatches. The V4-V5 region has shown better coverage.
Table 2: Primer Performance for Marinisomatota Detection
| Primer Name | Target Region | Sequence (5' -> 3') | Key Advantage | Reported Marinisomatota Coverage* |
|---|---|---|---|---|
| 515F-Y | V4 | GTGYCAGCMGCCGCGGTAA | Improved match to Marinisomatota | ~85% |
| 806RB | V4 | GGACTACNVGGGTWTCTAAT | Broader archaeal & bacterial coverage | ~85% |
| 390F | V3 | CGACGGGGYGCAGCAGGCGCGA | Designed for marine bacterioplankton | >90% |
| 1290R | V6-V8 | TACTACGTGCCAGCCGCCGCG | Paired with 390F for full-length | >90% |
*Coverage estimates based on in silico analysis (TestPrime, SILVA SSU Ref NR 99).
Q4: We suspect Marinisomatota activity in our samples. Beyond 16S, what follow-up methods are recommended? A: To move from detection to profiling, employ a multi-omics workflow.
- Metagenomics: Reveals metabolic potential and allows genome-resolved analysis via binning.
- Metatranscriptomics: Identifies actively expressed genes (e.g., rhodopsins, sulfur oxidases).
- FISH: Use specific oligonucleotide probes (e.g., SAR406-142) for cellular visualization and enumeration.
Experimental Protocols
Protocol 1: Marinisomatota-Optimized 16S rRNA Gene Amplification
Objective: Generate amplicon libraries with reduced bias against Marinisomatota.
- Primers: Use primer pair 390F / 1290R.
- PCR Mix (25 µL):
- 12.5 µL 2x HiFi HotStart ReadyMix
- 1.0 µL Forward Primer (10 µM)
- 1.0 µL Reverse Primer (10 µM)
- 1.0 µL Template DNA (5-10 ng)
- 9.5 µL PCR-grade H₂O
- Thermocycling:
- 95°C for 3 min.
- 30 cycles of: 95°C for 30s, 55°C for 30s, 72°C for 60s.
- 72°C for 5 min.
- Hold at 4°C.
- Clean-up: Purify amplicons using a magnetic bead-based clean-up system (e.g., AMPure XP).
- Validation: Check fragment size (~900 bp) on agarose gel. Quantify via fluorometry.
Protocol 2: Verification via FISH
Objective: Visually confirm the presence and morphology of Marinisomatota cells.
- Probe: Use Cy3-labeled SAR406-142 probe: 5'-CAG CGC ACC GTC TCA TCC-3'.
- Fixation: Fix sample with paraformaldehyde (final 3%, 1-3h, 4°C). Filter onto 0.2 µm polycarbonate membrane.
- Hybridization: Apply probe (50 ng/µL) in hybridization buffer at 46°C for 2-3 hours in a dark, humid chamber.
- Washing: Rinse filter in pre-warmed wash buffer at 48°C for 15 min.
- Mounting: Air-dry and mount on slide with antifading mounting medium containing DAPI.
- Imaging: Visualize using epifluorescence microscopy (DAPI: Ex 359/ Em 457; Cy3: Ex 550/ Em 570).
Visualizations
From Failure to Success Workflow
Multi-Omics Profiling Strategy
The Scientist's Toolkit
Table 3: Research Reagent Solutions for Marinisomatota Profiling
| Item | Function & Rationale |
|---|---|
| HiFi HotStart Polymerase | High-fidelity enzyme to reduce PCR errors during amplification of low-abundance targets. |
| Marinisomatota-Optimized Primers (e.g., 390F/1290R) | Primer sequences designed to minimize binding site mismatches, crucial for reducing amplification bias. |
| Mock Community with Spike-In | Defined genomic standard containing a known Marinisomatota sequence to quantitatively measure protocol bias. |
| SAR406-142 FISH Probe (Cy3-labeled) | Oligonucleotide probe for specific fluorescent in situ hybridization, enabling visual confirmation and cell counting. |
| Magnetic Bead Clean-up Kits (e.g., AMPure XP) | For consistent, high-recovery purification of amplicons and libraries prior to sequencing. |
| Marine-Specific Lysis Buffer (e.g., with CTAB) | Ensures efficient cell wall lysis of diverse, often tough, marine microbial cells including Marinisomatota. |
Beyond 16S: Validating Marinisomatota Findings with Complementary Techniques
Troubleshooting Guides & FAQs
Q1: During 16S amplicon sequencing, I observe inconsistent recovery of Marinisomatota across replicate samples, despite identical protocols. What could cause this PCR bias? A1: Inconsistent recovery is a hallmark of PCR amplification bias, critical in Marinisomatota research due to its variable 16S copy number and GC content.
- Primary Cause: Primer mismatches in the V3-V4 region commonly used for bacteria can inefficiently anneal to Marinisomatota sequences.
- Solution: Validate in silico primer binding using tools like TestPrime or probeMatch. Consider using a broader primer set (e.g., 27F-1492R) or optimizing annealing temperature via gradient PCR.
- Protocol - Bias Assessment: Spike a known quantity of an external control (e.g., Pseudomonas fluorescens with divergent 16S) into samples pre-extraction. After sequencing, compare the expected vs. observed control abundance to quantify bias magnitude.
Q2: In shotgun metagenomics, my data shows very low coverage of Marinisomatota genomes. How can I confirm this is biological and not a technical artifact? A2: Low coverage requires systematic verification.
- Checklist:
- DNA Quality: Verify high-molecular-weight DNA (>10 kb) via pulse-field gel electrophoresis; fragmentation favors host DNA.
- Host Depletion: If sampling a host-associated environment, ensure depletion kits do not non-specifically remove target bacterial DNA.
- Database Bias: Search against multiple databases (GTDB, NCBI RefSeq) as Marinisomatota taxonomy is evolving.
- Protocol - Hybrid Capture Enrichment: Design RNA bait libraries targeting conserved single-copy marker genes from known Marinisomatota. Use hybridization capture (e.g., xGen Lockdown Probes) on shotgun libraries to enrich for low-abundance targets.
Q3: For functional inference, can I reliably predict Marinisomatota metabolism from 16S data given the PCR bias concerns? A3: No. Functional prediction from 16S (e.g., via PICRUSt2) is highly unreliable for under-represented taxa like Marinisomatota due to:
- Lack of Close Reference Genomes: Predictions are extrapolated from phylogenetically distant relatives.
- Gene Content Variability: Horizontal gene transfer common in marine bacteria renders 16S-based prediction inaccurate.
- Recommendation: Any hypothesis on Marinisomatota metabolism from 16S data must be confirmed by shotgun metagenomics or metatranscriptomics.
Q4: What are the key quantitative differences in data output that directly impact Marinisomatota research? A4:
Table 1: Quantitative Comparison for Bacterial Community Analysis
| Feature | 16S Amplicon Sequencing | Shotgun Metagenomics |
|---|---|---|
| Primary Output | Counts of 16S rRNA gene variants (ASVs/OTUs) | Counts of all genomic fragments (reads) |
| Taxonomic Resolution | Genus to species level. Poor for novel lineages. | Species to strain level. Enables discovery of novel taxa. |
| Functional Insight | Indirect, via predictive tools (low accuracy). | Direct, via gene calling & pathway mapping (high accuracy). |
| PCR Amplification Bias | High. Skews abundance estimates of Marinisomatota. | Low. No targeted amplification step. |
| Relative Cost per Sample | Low to Medium | High (5-10x more than 16S) |
| Depth Required for Rare Taxa | 50,000-100,000 reads/sample. May miss rare Marinisomatota. | 20-50 million reads/sample for robust functional profiling. |
| Host DNA Sensitivity | Insensitive (targets bacterial 16S). | Highly sensitive; requires depletion or deep sequencing. |
Table 2: Impact on Marinisomatota-Specific Research
| Research Goal | Recommended Method | Rationale & Consideration |
|---|---|---|
| Discovery & Relative Abundance | Shotgun Metagenomics | Avoids primer bias, allows accurate placement in phylogenetic tree. |
| High-Throughput Screening | 16S Amplicon (with validated primers) | Cost-effective for large cohort studies if bias is characterized. |
| Metabolic Pathway Analysis | Shotgun Metagenomics | Essential for direct gene content analysis of this poorly characterized phylum. |
| Strain-Level Tracking | Shotgun Metagenomics | 16S is too conserved to resolve strains within Marinisomatota. |
Experimental Protocols
Protocol 1: Evaluating Primer Bias for 16S Amplicon Sequencing of Marinisomatota Objective: Quantify amplification efficiency of common primer pairs for Marinisomatota.
- In Silico Analysis: Download full-length 16S sequences for available Marinisomatota genomes from GTDB. Use
align.seqs(MOTHUR) ortestPrimers.py(bioinformatic script) to check for mismatches at 3'-ends of primers 341F (CCTACGGGNGGCWGCAG) and 806R (GGACTACHVGGGTWTCTAAT). - Gradient PCR: Perform PCR on a mock community containing a known Marinisomatota isolate and other bacteria (e.g., ZymoBIOMICS standard). Use an annealing temperature gradient from 50°C to 65°C.
- Quantification: Run products on a Bioanalyzer. Compare band intensity ratios (target:control) across temperatures to identify optimal conditions.
Protocol 2: Shotgun Metagenomic Assembly for Marinisomatota Genome Recovery Objective: Recover metagenome-assembled genomes (MAGs) from complex samples.
- Sequencing & QC: Generate 150bp paired-end reads on Illumina platform (≥30 Gb data). Trim adapters and low-quality bases with Trimmomatic (
LEADING:3 TRAILING:3 SLIDINGWINDOW:4:15 MINLEN:50). - Co-assembly: Assemble quality-filtered reads from multiple related samples using MEGAHIT (
--min-contig-len 1000) or metaSPAdes for greater yield. - Binning: Map reads back to contigs with Bowtie2. Perform binning using metaWRAP pipeline (concurrently with CONCOCT, MaxBin2, and metaBAT2). Refine bins with
Bin_refinementmodule. - Taxonomy & CheckM: Assign taxonomy to bins using GTDB-Tk. Assess completeness and contamination with CheckM (
lineage_wf).
Visualizations
Method Selection Workflow for Marinisomatota
Causes and Effects of 16S PCR Bias
The Scientist's Toolkit: Research Reagent Solutions
| Item | Function in Marinisomatota Research |
|---|---|
| Magnetic Bead-Based HMW DNA Kit (e.g., Nanobind CBB) | Extracts high-molecular-weight DNA essential for quality shotgun libraries and minimizing fragmentation bias. |
| Host Depletion Kit (e.g., NEBNext Microbiome DNA Enrichment) | Depletes mammalian host DNA from clinical samples, increasing microbial sequencing depth. Requires validation for bacterial loss. |
| PCR Bias Assessment Spike-in (e.g., Known Aliquot of P. fluorescens DNA) | Added pre-extraction to quantify technical bias in 16S protocols and normalize data. |
| Hybridization Capture Bait Set | Custom RNA baits designed from Marinisomatota conserved genes enrich for its sequences in complex shotgun libraries. |
| Mock Microbial Community (e.g., ZymoBIOMICS Gut) | Contains characterized genomes, used as a positive control to benchmark 16S and shotgun protocol performance. |
| GTDB-Tk Database & Software | Provides the current standard taxonomic framework for classifying novel MAGs, including Marinisomatota. |
| CheckM2 Software | Assesses the quality (completeness, contamination) of recovered Marinisomatota MAGs post-binning. |
Technical Support Center
FAQ & Troubleshooting Guide
Q1: During DNA extraction from marine sediment for Marinisomatota analysis, my yields are low and inconsistent. What could be the cause and solution? A: This is a common issue due to the complex matrix. Inefficient lysis of Gram-negative bacterial cells and inhibition by humic acids are primary culprits.
- Troubleshooting: Implement a bead-beating step with 0.1mm silica/zirconia beads for mechanical lysis. Use a commercial extraction kit designed for soil/sediment that includes polyvinylpolypyrrolidone (PVPP) or other inhibitors removal steps. Always include a mock extraction control.
Q2: My qPCR standard curve for the Marinisomatota-specific 16S rRNA gene assay has low efficiency (e.g., <90% or >110%). How can I optimize it? A: Low efficiency indicates issues with primer design, reaction conditions, or standard quality.
- Troubleshooting Steps:
- Verify Primer Specificity: Re-BLAST your primer sequences against the latest NR database to ensure specificity for Marinisomatota.
- Optimize Annealing Temperature: Perform a temperature gradient (e.g., 55-65°C).
- Check Standard Integrity: Ensure your linearized plasmid or gBlock standard is purified, quantified accurately via fluorometry, and serial dilutions are made in carrier DNA (e.g., 10 ng/µL tRNA).
- Reaction Inhibitors: Add Bovine Serum Albumin (BSA) (0.1-0.5 µg/µL) to chelate inhibitors.
Q3: How do I account for PCR bias in 16S rRNA gene amplification when calculating the absolute abundance of Marinisomatota from my qPCR data? A: This is central to the thesis context. Relative amplification efficiency differences between your standard and environmental templates introduce bias.
- Solution: Apply a correction factor. Co-amplify your environmental sample DNA with a known quantity of a synthetic internal standard (competitor DNA with a different primer binding site or length). The ratio of amplificates allows for calculation of a sample-specific efficiency, which can correct the absolute count derived from the external standard curve.
Q4: My melt curve analysis for the Marinisomatota-specific qPCR assay shows multiple peaks. What does this mean? A: Multiple peaks indicate non-specific amplification or primer-dimer formation, compromising quantification accuracy.
- Troubleshooting: Re-design primers targeting a more variable region within the Marinisomatota 16S gene. Increase annealing temperature. Use a hot-start Taq polymerase. Ensure no template controls (NTCs) are clean.
Detailed Protocol: qPCR for Absolute Abundance with Bias Assessment
1. Target & Standard Preparation
- Primer Design: Design primers targeting a hypervariable region (e.g., V4-V5) of the 16S rRNA gene conserved within Marinisomatota but distinct from other phyla. Verify in silico specificity.
- Standard Creation: Clone the target amplicon into a plasmid vector. Linearize, purify, and quantify via fluorescent dsDNA assay. Create a 10-fold serial dilution series (10^7 to 10^1 copies/µL) in TE buffer with 10 ng/µL tRNA.
2. qPCR Reaction Setup
- Master Mix (25 µL reaction):
- 12.5 µL 2x SYBR Green qPCR Master Mix
- 1.0 µL Forward Primer (10 µM)
- 1.0 µL Reverse Primer (10 µM)
- 0.5 µL BSA (10 µg/µL)
- 5.0 µL Template DNA (or standard)
- 5.0 µL Nuclease-free H₂O
- Run Conditions:
- Stage 1: 95°C for 3 min (polymerase activation)
- Stage 2 (40 cycles): 95°C for 15 sec, 60°C for 30 sec (acquire signal), 72°C for 30 sec
- Stage 3: Melt Curve 65°C to 95°C, increment 0.5°C/5 sec
3. Data Analysis with Bias Correction
- Calculate gene copy number per gram of sediment from the standard curve.
- To correct for PCR bias, use the formula derived from co-amplification with an internal competitor (if used):
Corrected Copy Number = (Raw Copy Number) x (E_standard / E_sample)where E is amplification efficiency.
Quantitative Data Summary
Table 1: Common qPCR Performance Issues and Target Ranges
| Parameter | Optimal Range | Typical Issue Value | Corrective Action |
|---|---|---|---|
| Amplification Efficiency (E) | 90-110% | <90% or >110% | Optimize annealing, check primers/standard |
| Standard Curve R² | ≥0.990 | <0.980 | Re-prepare standard dilutions |
| Negative Control (Cq) | No amplification or >40 | Cq < 35 | Replace reagents, decontaminate workspace |
| Sample Replicate SD (Cq) | <0.5 cycles | >0.5 cycles | Vortextemplate, improve pipetting accuracy |
Table 2: Expected Abundance Ranges of Marinisomatota 16S rRNA Genes
| Sample Type | Approximate Copy Number Range (per gram) | Notes |
|---|---|---|
| Coastal Sediment | 10^4 - 10^6 | Highly variable by location/depth |
| Deep-sea Sediment | 10^3 - 10^5 | Generally lower than coastal |
| Hydrothermal Vent | 10^5 - 10^7 | Potentially a hotspot for certain lineages |
| Water Column | 10^1 - 10^3 | Typically very low abundance |
Visualizations
qPCR Workflow for Absolute Abundance
Sources and Impacts of 16S PCR Bias
The Scientist's Toolkit: Research Reagent Solutions
| Item | Function in Marinisomatota qPCR Analysis |
|---|---|
| Inhibitor-Removal DNA Extraction Kit | Removes humic acids, phenolics, and other PCR inhibitors from complex marine samples. |
| PVPP (Polyvinylpolypyrrolidone) | Added during extraction to bind and precipitate polyphenolic inhibitors. |
| BSA (Bovine Serum Albumin) | Added to qPCR master mix to bind residual inhibitors and stabilize polymerase. |
| SYBR Green qPCR Master Mix | Contains optimized buffer, polymerase, dNTPs, and dye for intercalation-based detection. |
| Linearized Plasmid Standard | Provides known copy number template for generating the qPCR standard curve. |
| Fluorometric DNA Quantification Kit | Accurately measures low-concentration DNA without interference from RNA/contaminants. |
| Marinisomatota-Specific Primers | Oligonucleotides designed to amplify a unique region of the 16S rRNA gene. |
| Synthetic Internal Competitor DNA | Used to calculate sample-specific PCR efficiency and correct for amplification bias. |
Troubleshooting Guide & FAQs
Q1: During FISH confirmation of 16S rRNA from Marinisomatota, I observe high background fluorescence, obscuring specific probe signals. What are the likely causes and solutions? A1: High background is commonly due to insufficient stringency or non-specific probe binding.
- Primary Cause: Formamide concentration in hybridization buffer is too low for the probe's required stringency.
- Solution: Increase formamide concentration incrementally (e.g., by 5%). For Marinisomatota-specific probes, a range of 35-45% is typical. Re-optimize hybridization temperature accordingly.
- Secondary Cause: Inadequate post-hybridization washing.
- Solution: Increase wash temperature by 2-3°C or add a more stringent wash buffer (e.g., with EDTA). Ensure wash buffers are freshly prepared and at correct pH.
Q2: My FISH signal from environmental samples is faint or absent, despite positive PCR amplification for Marinisomatota 16S. What steps should I take? A2: This discrepancy may highlight PCR amplification bias or FISH protocol issues.
- Check Probe Design & Permeabilization: Verify probe specificity against updated databases (e.g., SILVA). For Marinisomatota, cell wall permeability may require optimization; test different lysozyme concentrations (1-10 mg/mL) or incubation times.
- Review Fixation: Over-fixation can reduce probe accessibility. Reduce paraformaldehyde fixation time from the standard 3-4 hours to 1-2 hours at 4°C.
- Consider PCR Bias: The PCR step prior to FISH probe design may have underrepresented certain Marinisomatota clades. Consult your clone library or sequencing data for potential primer bias.
Q3: I encounter rapid photobleaching of fluorophores during microscopy, hindering image capture. How can I mitigate this? A3: Photobleaching is related to fluorophore chemistry and imaging conditions.
- Immediate Action: Use an anti-fading mounting medium (e.g., Vectashield with DAPI). Ensure slides are sealed properly.
- Microscope Adjustments: Reduce excitation light intensity or exposure time. Use a more sensitive camera (EMCCD/sCMOS) to compensate for lower light.
- Reagent Choice: Consider using photostable cyanine dyes (e.g., Cy5) over fluorescein derivatives for critical channels.
Q4: What are common controls for validating FISH specificity in the context of Marinisomatota research? A4: Proper controls are essential to confirm signal specificity.
- Negative Controls: 1) A nonsense probe (non-target sequence) with same chemistry. 2) Sample without probe. 3) Competitor probe (unlabeled) to outcompete binding.
- Positive Control: Use a universal bacterial probe (EUB338) to confirm overall cell integrity and hybridization success. A known Marinisomatota culture (if available) is ideal.
Q5: How do I quantitatively correlate FISH cell counts with 16S amplicon sequencing data from the same sample? A5: This addresses the core thesis of PCR bias.
- Method: Perform FISH on a serial dilution of a homogenized sample aliquot. Count cells per field of view for target and universal probes.
- Calculation: Calculate the percentage of Marinisomatota cells (FISH count with specific probe / FISH count with universal probe). Compare this percentage to the relative abundance derived from 16S amplicon sequencing of a parallel sample aliquot.
Table 1: Troubleshooting Common FISH Problems
| Symptom | Possible Cause | Solution | Key Parameter to Adjust |
|---|---|---|---|
| High Background | Low Stringency | Increase formamide % in buffer | Formamide (35-45%) |
| Weak/No Signal | Poor Permeabilization | Optimize lysozyme treatment | Lysozyme concentration (1-10 mg/mL) |
| Weak/No Signal | Over-fixation | Reduce PFA fixation time | Fixation Time (1-4 hrs at 4°C) |
| Punctate Signal | Probe Penetration Issue | Add detergent (e.g., 0.1% Triton X-100) | Permeabilization agent |
| Rapid Fading | No anti-fade reagent | Use commercial anti-fade mountaint | Imaging Medium |
Table 2: Typical FISH Protocol Parameters for Marinisomatota
| Step | Reagent | Concentration | Time | Temperature |
|---|---|---|---|---|
| Fixation | Paraformaldehyde | 4% (w/v) in PBS | 2-3 hours | 4°C |
| Permeabilization | Lysozyme | 5 mg/mL in TE | 30 min | 37°C |
| Hybridization | Probe, Formamide | 5 ng/μL, 40% | 2-3 hours | 46°C |
| Washing | NaCl, Tris, EDTA | Varies by stringency | 15-30 min | 48°C |
Experimental Protocol: FISH for Visualizing Marinisomatota in Complex Samples
Title: Combined Fixation and Hybridization Protocol for Environmental Sample FISH.
1. Sample Fixation & Permeabilization:
- Harvest cells from environmental sample (e.g., marine sediment) via centrifugation (8000 x g, 5 min).
- Resuspend pellet in 4% paraformaldehyde (PBS, pH 7.4). Fix for 2-3 hours at 4°C.
- Pellet cells, wash 2x with 1x PBS.
- Resuspend in 50:50 PBS:Ethanol and store at -20°C.
- Spot 10-20 μL onto clean, charged microscope slides. Air dry.
- Dehydrate in 50%, 80%, 96% ethanol series (3 min each). Air dry.
- Apply 50 μL lysozyme solution (5 mg/mL in 10 mM Tris-HCl, 5 mM EDTA, pH 8.0). Incubate 30 min at 37°C in a humid chamber.
- Rinse slide with distilled water and dehydrate again through ethanol series. Air dry.
2. Hybridization:
- Prepare hybridization buffer: 0.9 M NaCl, 20 mM Tris-HCl (pH 7.4), 40% formamide (v/v, optimized), 0.01% SDS.
- Mix 1 μL of fluorescently-labeled probe (50 ng/μL stock) with 49 μL hybridization buffer per sample area.
- Apply mixture to sample area, cover with a coverslip.
- Place slide in a pre-warmed, humidified chamber. Incubate at 46°C for 2-3 hours in the dark.
3. Washing & Microscopy:
- Prepare warm wash buffer: 20 mM Tris-HCl (pH 7.4), 5 mM EDTA, 0.01% SDS, and NaCl to required stringency (e.g., 225 mM for 40% formamide).
- Carefully remove coverslip and immerse slide in wash buffer. Incubate for 15 min at 48°C.
- Rinse slide briefly with ice-cold distilled water. Air dry in the dark.
- Apply 5-10 μL of anti-fading mounting medium containing DAPI (for counterstain). Add coverslip and seal.
- Visualize using an epifluorescence or confocal microscope with appropriate filter sets.
Visualization Diagrams
Title: FISH Validation Workflow for Marinisomatota
Title: Using FISH to Address 16S PCR Bias
The Scientist's Toolkit: Research Reagent Solutions
Table 3: Essential Materials for Marinisomatota-Targeted FISH
| Item | Function | Example/Note |
|---|---|---|
| Marinisomatota-Specific 16S rRNA Probe | Binds complementary rRNA sequence for specific detection. | Designer probe (e.g., MARI-1442). MUST be checked against current database. |
| Formamide | Denatures rRNA structure; key for controlling hybridization stringency. | Concentration (30-50%) is probe-specific and critical for signal-to-noise. |
| Paraformaldehyde (PFA) | Cross-links and preserves cellular morphology. | Freshly prepared 4% solution is ideal. |
| Lysozyme | Digests peptidoglycan to allow probe entry into bacterial cells. | Concentration and time require optimization for environmental samples. |
| Anti-fading Mounting Medium | Reduces photobleaching during microscopy. | Often contains DAPI for total cell counterstain (e.g., Vectashield). |
| Stringent Wash Buffer (with EDTA) | Removes non-specifically bound probe post-hybridization. | Salt concentration and temperature are critical for specificity. |
Evaluating Different 16S Primer Sets (V4-V5, V1-V3, etc.) for Marinisomatota Recovery
Technical Support Center: Troubleshooting & FAQs
FAQ 1: Why am I failing to detect Marinisomatota in my marine sediment samples despite using common universal 16S primers like 515F/806R (V4)? Answer: The 515F/806R primer pair (targeting the V4 region) has known mismatches, particularly in the 515F forward primer, against several phyla including some within the FCB group (which contains Marinisomatota). This leads to amplification bias and under-representation. You are likely experiencing primer-template mismatch, a core source of PCR bias in 16S amplification. To resolve this, use an alternative primer set with better coverage for marine bacterioplankton, such as the 341F/785R (V3-V4) pair, which has shown improved recovery for diverse marine taxa.
FAQ 2: How do I choose between primer sets V1-V3 and V4-V5 for a study focused on Marinisomatota diversity? Answer: The choice involves a trade-off between taxonomic resolution, read length, and specificity. Based on current evaluations:
- V4-V5 Region (e.g., 515F/926R): Offers a good balance of length and classification accuracy for many bacteria. However, it may still have biases. The 926R primer has better match for some marine lineages.
- V1-V3 Region (e.g., 27F/534R): Provides a longer fragment with potentially higher phylogenetic resolution but is more susceptible to lower DNA quality and may have stronger GC bias. Marinisomatota sequences often classify more confidently with longer fragments. Recommendation: If sample DNA quality is high, consider using a V1-V3 primer set for deeper phylogenetic analysis. For routine diversity surveys where sample quality varies, a optimized V4-V5 set may be more robust. Always include a mock community control in your runs.
FAQ 3: My PCR results show faint or smeared bands when using primer set 341F/805R for V3-V4. What could be the issue? Answer: This is a common protocol issue. Potential causes and solutions are:
- Annealing Temperature Too Low: This can cause non-specific binding. Perform a gradient PCR (e.g., 50°C to 60°C) to optimize.
- Primer Degradation: Resuspend or aliquot primers in nuclease-free water and store at -20°C. Avoid multiple freeze-thaw cycles.
- Inhibitors in Environmental DNA: Marine sediment samples often contain humic acids. Perform an additional clean-up step on your extracted DNA using a column designed for inhibitor removal (e.g., PowerClean Pro).
- Cycle Number Too High: For complex templates, >30 cycles can increase spurious products. Try reducing to 25-28 cycles.
Table 1: In Silico Evaluation of Common Primer Pairs for Marinisomatota 16S rRNA Gene Coverage
| Primer Pair Name | Target Region | Approx. Amplicon Size | In Silico Match to Marinisomatota SILVA SSU Ref NR 99 (%) | Key Mismatch Positions (if known) | Recommended Use Case |
|---|---|---|---|---|---|
| 27F (8F) / 534R | V1-V3 | ~500 bp | ~78% | Some mismatches in 27F for specific families | High-res diversity studies from high-quality DNA |
| 341F / 785R | V3-V4 | ~465 bp | ~92% | Minor, but considered one of the best for marine samples | General marine microbiome profiling |
| 515F / 806R | V4 | ~290 bp | ~65% | Critical mismatch in 515F at position 9 (A->G) | General microbiome studies (but caution for marine) |
| 515F / 926R | V4-V5 | ~410 bp | ~88% | Improved over 806R, better for marine taxa | Marine & freshwater ecosystem studies |
| 1389F / 1510R | V9 | ~120 bp | >95% | Short region, high match but low phylogenetic power | Quantitative FISH probe design or very degraded DNA |
Table 2: Experimental Recovery from a Defined Marine Mock Community (Including Marinisomatota Representatives)
| Primer Set | PCR Conditions | Observed Marinisomatota Abundance (%) | Expected Abundance (%) | Bias (Observed/Expected) | Notes |
|---|---|---|---|---|---|
| 515F/806R (V4) | 98°C/30s, [98°C/10s, 50°C/30s, 72°C/30s] x 30 | 2.1% | 10.0% | 0.21 | Severe under-representation |
| 341F/785R (V3-V4) | 98°C/30s, [98°C/10s, 55°C/30s, 72°C/30s] x 28 | 9.5% | 10.0% | 0.95 | Near-accurate recovery |
| 27F/534R (V1-V3) | 98°C/30s, [98°C/10s, 52°C/30s, 72°C/45s] x 28 | 11.3% | 10.0% | 1.13 | Slight over-amplification |
Experimental Protocols
Protocol 1: Optimized 16S rRNA Gene Amplification for Marine Samples with Reduced Bias Title: Two-Step PCR Protocol for Illumina MiSeq Library Preparation. Application: Amplicon sequencing of bacterial communities with improved recovery of taxa like Marinisomatota. Reagents: DNA template, KAPA HiFi HotStart ReadyMix, primer set (e.g., 341F/785R with Illumina overhangs), PCR-grade water. Steps:
- First PCR (Amplification):
- Set up 25 μL reaction: 12.5 μL KAPA HiFi Mix, 1.0 μL each forward and reverse primer (10 μM), 2.0 μL template DNA (5-20 ng), 8.5 μL water.
- Cycling: 95°C for 3 min; 25 cycles of 95°C for 30s, 55°C for 30s, 72°C for 30s; final extension 72°C for 5 min.
- Critical: Use a minimum cycle number to reduce bias. Clean up amplicons with AMPure XP beads (0.8x ratio).
- Second PCR (Indexing):
- Use 2.0 μL of cleaned first-PCR product as template.
- Add Nextera XT index primers.
- Cycling: 95°C for 3 min; 8 cycles of 95°C for 30s, 55°C for 30s, 72°C for 30s; final extension 72°C for 5 min.
- Clean final library with AMPure XP beads (0.9x ratio). Quantify by qPCR or fluorometry.
Protocol 2: In Silico Evaluation of Primer Specificity Title: In Silico PCR Analysis Using ecoPCR (OBITools). Application: To predict primer bias against a target clade like Marinisomatota. Steps:
- Obtain Reference Database: Download the latest SILVA SSU Ref NR 99 database in FASTA format.
- Define Parameters: Set maximum number of mismatches (e.g., 3), maximum number of gaps (e.g., 0), and amplicon size range (e.g., 300-600 bp).
- Run ecoPCR: Execute the
ecoPCRcommand for your primer sequences against the database. - Filter and Analyze: Use
ecogrepto filter results for the phylum Marinisomatota (or its synonyms, e.g., Marinimicrobia). Calculate the percentage of matched sequences versus the total available for that phylum in the database.
Diagrams
Title: PCR Bias Workflow in 16S Amplicon Studies
Title: Primer Selection Decision Tree
The Scientist's Toolkit: Research Reagent Solutions
Table 3: Essential Reagents for Minimizing PCR Bias in 16S Studies
| Item | Function & Rationale | Example Product |
|---|---|---|
| High-Fidelity DNA Polymerase | Reduces PCR errors and chimera formation, crucial for accurate sequencing. | KAPA HiFi HotStart, Q5 High-Fidelity |
| Inhibitor Removal Beads/Columns | Removes humic acids, polyphenols, and salts from marine/soil DNA extracts that inhibit PCR. | PowerClean Pro Cleanup Kit, OneStep PCR Inhibitor Removal Kit |
| Mock Community Standard | A defined mix of genomic DNA from known species. Essential for quantifying and correcting primer bias in every run. | ZymoBIOMICS Microbial Community Standard |
| AMPure XP Beads | For precise size selection and clean-up of amplicons, removing primer dimers and non-specific products. | Beckman Coulter AMPure XP |
| Next-Generation Sequencing Library Quantification Kit | Accurate quantification of final libraries via qPCR (not just fluorometry) ensures balanced sequencing. | KAPA Library Quantification Kit for Illumina |
| Broad-Coverage 16S Primers | Primer sets with demonstrated high in silico match to target groups like FCB/Marinimicrobia. | 341F (CCTACGGGNGGCWGCAG), 785R (GACTACHVGGGTATCTAATCC) |
Technical Support Center: PCR Bias & Marinisomatota 16S Amplicon Sequencing
Troubleshooting Guides & FAQs
Q1: Our 16S rRNA gene amplicon sequencing of a marine sediment sample shows a sudden, dominant peak of Marinisomatota (formerly Marinisomatia). Is this a true biological signal or a PCR/sequencing artifact? A1: This is a classic symptom of PCR bias. Marinisomatota 16S rRNA genes may have GC content or secondary structures that make them preferentially amplified under your specific PCR conditions. Do not interpret this as quantitative abundance.
- Troubleshooting Steps:
- Verify with Alternate Primer Sets: Repeat PCR using a different hypervariable region (e.g., V4-V5 instead of V3-V4). A consistent result increases confidence.
- Employ a PCR-Inhibitor Control: Spike the sample with a known amount of a synthetic (non-marine) internal standard DNA. Its recovery rate will indicate if inhibition is causing bias.
- Cross-Validate with qPCR: Design Marinisomatota-specific TaqMan assays for absolute quantification.
- Analyze Mock Community Data: Sequence a ZymoBIOMICS or similar mock community with your exact protocol. The deviation from known ratios quantifies your pipeline's bias (see Table 1).
Q2: When synthesizing data from 16S amplicon sequencing, metagenomics, and fluorescence in situ hybridization (FISH) for Marinisomatota, the community pictures are contradictory. How do we reconcile them? A2: This is expected, as each method captures a different "slice" of reality. The goal is synthesis, not matching.
- Troubleshooting Framework:
- Map the Technical Biases of each method against your research question (see Table 1).
- Create a Decision Tree for data integration (see Diagram 1).
Q3: Our negative control in the 16S amplicon protocol shows low-level amplification. Could this affect Marinisomatota detection in low-biomass samples? A3: Yes. Contaminant DNA, often from reagents (kitome), can severely skew low-biomass results like marine subsurface samples.
- Actionable Protocol:
- Sequence Multiple Negative Controls: Include a minimum of 3 extraction blanks and 3 PCR no-template controls (NTCs) per batch.
- Bioinformatic Subtraction: Use tools like
decontam(prevalence or frequency method) in R to identify and remove contaminant ASVs/OTUs present in controls. - Use UV-Irradiated Reagents: Treat PCR water and master mix components with UV light to fragment contaminating DNA.
Experimental Protocols
Protocol 1: Bias Assessment Using a Mock Community Objective: Quantify PCR and sequencing bias in your specific pipeline for detecting Marinisomatota and related taxa.
- Material: ZymoBIOMICS Microbial Community Standard (D6300).
- Extraction: Process the mock community identically to environmental samples using your standard DNA extraction kit.
- Amplification: Perform triplicate PCRs using your 16S primers (e.g., 515F/806R for V4).
- Sequencing: Pool and sequence on the same lane as your samples.
- Bioinformatics: Process mock data through your exact ASV/OTU pipeline.
- Analysis: Calculate the observed/expected ratio for each member. A ratio >1 indicates preferential amplification; <1 indicates under-representation.
Protocol 2: FISH for Marinisomatota Validation Objective: Visually confirm the physical presence and morphology of Marinisomatota cells.
- Probe Design: Use ARB/SILVA to design a species-specific Cy3-labeled oligonucleotide probe targeting your Marinisomatota ASV.
- Sample Fixation: Fix sediment slurry in 4% paraformaldehyde (PFA) for 3h at 4°C.
- Hybridization: Apply probe at 46°C for 2-3h in a humid chamber. Include a nonsense probe as negative control.
- Washing & Imaging: Wash slides at 48°C, counterstain with DAPI, and image via epifluorescence microscopy.
- Quantification: Compare cell counts from FISH to 16S amplicon relative abundance, noting that FISH provides cells/mL, not relative %.
Data Presentation
Table 1: Method-Specific Biases Impacting Marinisomatota Detection
| Method | What it Measures | Primary Biases Affecting Marinisomatota | Data Output Type |
|---|---|---|---|
| 16S Amplicon Seq | Relative abundance of 16S gene copies | Primer affinity, GC bias, copy number variation, chimera formation | Relative % (Distorted) |
| Shotgun Metagenomics | Relative abundance of all genes | DNA extraction efficiency, genome size, database completeness | Relative % & Functional Potential |
| FISH/Microscopy | Absolute cell counts | Probe specificity, cell permeability, autofluorescence, detection limit | Absolute Cells/volume |
| qPCR | Absolute gene copy number | Primer/probe specificity, inhibition, standard curve accuracy | Absolute Copies/volume |
Mandatory Visualizations
Diagram 1: Multi-Method Data Synthesis Decision Tree
Diagram 2: PCR to Sequencing Workflow & Bias Points
The Scientist's Toolkit: Research Reagent Solutions
| Item | Function in Marinisomatota/16S Research |
|---|---|
| ZymoBIOMICS Microbial Community Standard (D6300) | Defined mock community for quantifying protocol-specific PCR and sequencing bias. |
| Phusion High-Fidelity DNA Polymerase | High-fidelity polymerase reduces PCR errors and chimeric sequence formation during amplification. |
| Bovine Serum Albumin (BSA) or PCR Enhancer | Added to PCR mix to counteract inhibitors (e.g., humic acids) common in sediment/soil DNA extracts. |
| PNA/DNA Clamp Mixes (e.g., for host DNA) | For host-contaminated samples (e.g., sponge tissue), PNA clamps block eukaryotic 18S amplification, enriching for bacterial 16S. |
| UV Crosslinker | To pre-treat PCR water and plasticware, fragmenting contaminating DNA and reducing background in low-biomass studies. |
| Specific FISH Probes (e.g., custom-designed Cy3-labeled) | For visual confirmation and spatial localization of Marinisomatota cells within a sample matrix. |
DNA Spike-in (e.g., Synthetic gBlock) |
Known copy number artificial sequence for normalizing amplification efficiency across samples. |
Conclusion
Accurate profiling of the Marinisomatota phylum, and indeed any microbial taxon, requires a critical understanding and active mitigation of PCR amplification bias inherent to 16S rRNA sequencing. A robust strategy integrates careful primer selection, optimized wet-lab protocols, vigilant bioinformatic troubleshooting, and essential validation through complementary methods like metagenomics or qPCR. For biomedical and clinical researchers, these steps are not merely technical adjustments but fundamental to generating reliable data. As we move toward microbiome-based diagnostics and therapeutics, recognizing and correcting for such biases is paramount. Future research must focus on developing universally conserved primer sets, standardized mock communities that include challenging taxa like Marinisomatota, and bioinformatic tools that can computationally correct for residual amplification artifacts, ultimately leading to more truthful representations of microbial ecosystems in health and disease.