The Heteroresistance Tug-of-War: How Bacteria Optimize Gene Copy Number to Balance Fitness Cost and Survival
This article provides a comprehensive analysis of the critical balance between amplified antimicrobial resistance gene copy number and the associated cellular fitness cost in bacterial heteroresistance.
The Heteroresistance Tug-of-War: How Bacteria Optimize Gene Copy Number to Balance Fitness Cost and Survival
Abstract
This article provides a comprehensive analysis of the critical balance between amplified antimicrobial resistance gene copy number and the associated cellular fitness cost in bacterial heteroresistance. Targeting researchers and drug development professionals, we explore the molecular mechanisms driving subpopulation variation, detail cutting-edge methodologies for quantifying this trade-off, address common experimental challenges, and validate findings through comparative analysis across pathogens and resistance mechanisms. The synthesis aims to inform novel therapeutic strategies that exploit this fragile equilibrium to combat resilient infections.
Decoding the Trade-Off: The Fundamental Principles of Gene Amplification and Fitness Cost in Heteroresistant Subpopulations
Heteroresistance Research Support Center
Welcome to the Technical Support Center. This guide addresses common experimental challenges in heteroresistance research, framed within the critical thesis of balancing gene copy number amplification with associated fitness costs.
Troubleshooting Guides
Issue 1: Inconsistent Population Analysis Profiling (PAP) Results
- Problem: PAP assays show high variability in the size of the resistant subpopulation between technical replicates.
- Solution:
- Standardize Inoculum: Use a defined growth phase (e.g., mid-log) and precise normalization (OD600). Avoid using saturated cultures.
- Optimize Plating: Use a cell spreader for even distribution. For each antibiotic concentration, plate at least three technical replicates of a 10-µL spot from serial dilutions.
- Control Environment: Ensure antibiotic plates are freshly prepared or stored at -20°C for <2 weeks. Let plates warm to room temperature before use to prevent condensation.
Issue 2: Unstable Heteroresistance Phenotype in Serial Passage
- Problem: The resistant subpopulation diminishes rapidly during passaging in antibiotic-free media, complicating fitness cost studies.
- Solution: This is likely due to high fitness cost. Implement a "cyclic selection" protocol:
- Passage the population in antibiotic-free media for 4-6 generations.
- Then, expose a sample to a selective antibiotic concentration (e.g., 2-4x MIC of main population) for 12-24 hours to re-enrich the resistant subpopulation.
- Cycle between these conditions to maintain the dynamic equilibrium for study.
Issue 3: Difficulty Linking Gene Copy Number Variation (CNV) to Phenotype
- Problem: PCR or qPCR data on gene amplification does not correlate well with observed resistance levels in subpopulations.
- Solution:
- Single-Cell Resolution: Use droplet digital PCR (ddPCR) on single-cell sorted colonies from PAP plates to directly link copy number in a resistant colony-forming unit (CFU) to its survival concentration.
- Check Genomic Context: Ensure primers/probes target the precise amplicon region. Flanking repeats or mobile elements can lead to inaccurate CNV estimates by standard qPCR.
Frequently Asked Questions (FAQs)
Q1: What is the operational definition of heteroresistance, and how does it differ from mixed populations or persistence? A: Heteroresistance is defined as the presence of a stable, dynamic subpopulation of isogenic cells with a higher Minimum Inhibitory Concentration (MIC) than the dominant population. Unlike a mixed population from contamination, it is clonal. Unlike persistence, the resistant state is heritable (genetically or epigenetically) and can be amplified under selection, but may revert due to fitness costs. The core of our thesis is studying the genetic mechanisms (e.g., tandem amplifications) that enable this dynamic balance.
Q2: How do I determine the appropriate antibiotic concentration range for a Population Analysis Profile (PAP) assay? A: Start with a range from 0.25x to 16x the MIC of the main susceptible population. Run an initial broad screening (e.g., 2-fold dilutions across this range). Subsequent experiments should use narrower increments (e.g., 0.5x steps) around the concentration where the subpopulation survival drops sharply (the "heteroresistance MIC" or hMIC).
Q3: What are the best methods to quantify the fitness cost associated with the resistant subpopulation? A: Key metrics are summarized in the table below.
Table 1: Quantitative Measures of Fitness Cost in Heteroresistance
| Metric | Method | Interpretation in Thesis Context |
|---|---|---|
| Growth Rate (μ) | Measure OD600 or CFU/mL over time in antibiotic-free broth. | Slower μ indicates a higher fitness cost, which limits the stable maintenance of high gene copy number amplifications. |
| Competitive Index (CI) | Co-culture resistant and susceptible isogenic strains (or subpopulations) at a 1:1 ratio. Sample over 24-72h and plate on selective & non-selective media. | CI < 1 indicates a fitness cost for the resistant subpopulation. The rate of CI decline informs the stability of the resistance mechanism. |
| Relative Area Under Curve (rAUC) | Calculate from PAP data: AUC of test strain / AUC of susceptible control strain across antibiotic concentrations. | A lower rAUC indicates a higher fitness cost, as fewer resistant cells survive at baseline without selection pressure. |
Q4: Can you provide a standard protocol for a Population Analysis Profile (PAP) / Area Under Curve (AUC) analysis? A: Detailed PAP/AUC Protocol:
- Culture Preparation: Grow test strain and a susceptible control to mid-log phase (OD600 ~0.5-0.6) in appropriate broth.
- Normalization & Dilution: Normalize cultures to ~1 x 10^8 CFU/mL. Perform 10-fold serial dilutions in saline or PBS (10^-1 to 10^-6).
- Spot Plating: For each antibiotic concentration plate (including a 0 µg/mL control), spot 10 µL of each dilution onto the agar surface. Let spots dry.
- Antibiotic Plates: Prepare Mueller-Hinton (or relevant) agar plates with 2-fold serial dilutions of antibiotic. Include a drug-free control.
- Incubation & Counting: Incubate at 37°C for 18-24 hours. Count colonies from spots yielding 5-50 colonies.
- Calculation: Calculate CFU/mL per spot, then per antibiotic concentration. Plot log10(CFU/mL) vs. Antibiotic Concentration.
- AUC Analysis: Use the trapezoidal rule to calculate the AUC for the test and control strains from 0 to the max concentration tested. Calculate rAUC = AUC(test) / AUC(control).
The Scientist's Toolkit: Research Reagent Solutions
Table 2: Essential Reagents for Heteroresistance Mechanistic Studies
| Item | Function & Relevance to Thesis |
|---|---|
| Phusion High-Fidelity DNA Polymerase | For accurate amplification of genomic regions suspected of undergoing tandem duplication (e.g., antibiotic resistance genes with flanking repeats). |
| Droplet Digital PCR (ddPCR) Supermix | Enables absolute, single-molecule quantification of gene copy number variation (CNV) from single colonies or low-abundance subpopulations. Critical for linking CNV to phenotype. |
| Flow Cytometry Cell Sorter | To physically isolate single cells or small subpopulations from the tail of a PAP assay for downstream genomic (sequencing) or phenotypic analysis. |
| Competitive Growth Media | Defined minimal media or media with sub-inhibitory stress (e.g., low nutrients) to accurately measure the fitness cost of amplified resistance genes. |
| TaqMan Probes for qPCR | For specific, sensitive quantification of the copy number of a target resistance gene relative to a single-copy housekeeping gene. |
| Chromosomal DNA Extraction Kit | High-quality, high-molecular-weight DNA is essential for long-read sequencing (e.g., Oxford Nanopore, PacBio) to resolve the structure of amplified genomic regions. |
Visualization: Experimental and Conceptual Diagrams
Title: Population Analysis Profile (PAP) Workflow
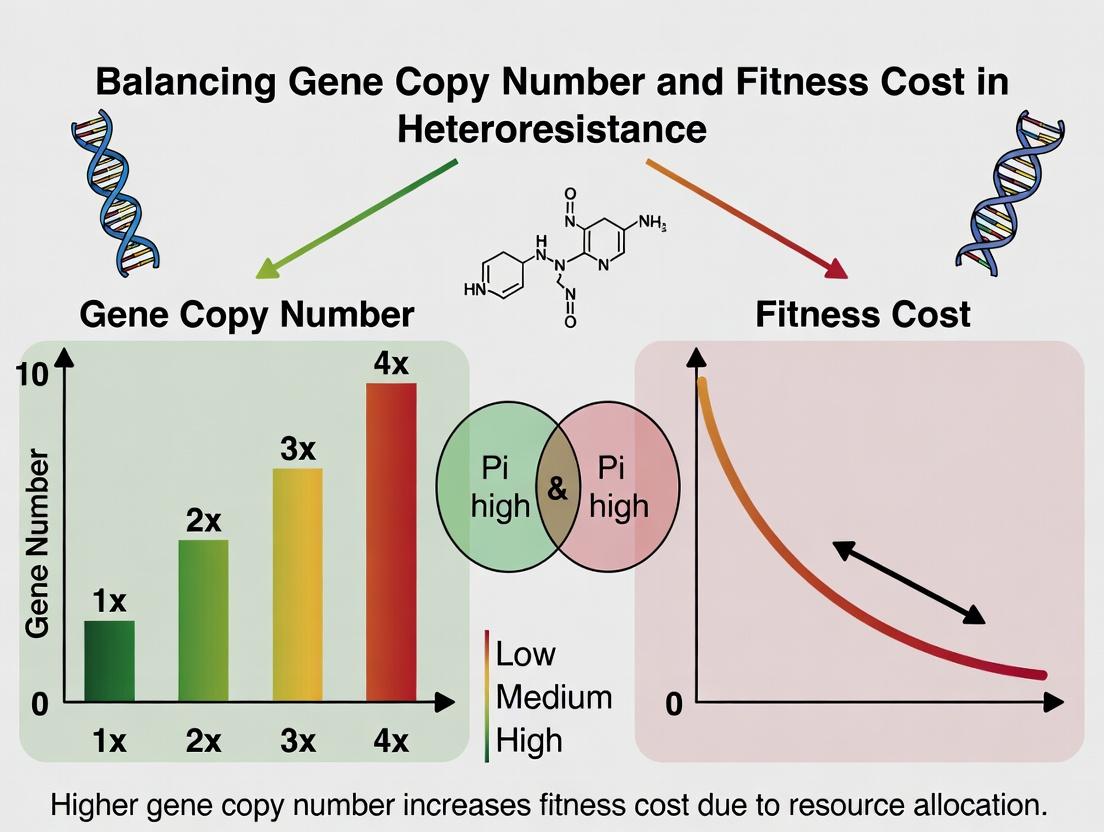
Title: Gene Copy Number & Fitness Cost Balance
Technical Support Center: Troubleshooting Gene Copy Number Amplification Experiments
FAQs and Troubleshooting Guides
Q1: In my plasmid-mediated heteroresistance assay, I observe no fitness cost in strains with high-copy-number resistance plasmids, contrary to my hypothesis. What could be the issue? A: This is a common observation. Potential causes and solutions:
- Compensatory Evolution: The host strain may have acquired compensatory mutations that reduce the fitness burden. Solution: Sequence the host genome of your evolved strain and compare to the ancestor.
- Plasmid Stability: The plasmid may carry beneficial genes (e.g., metabolic) offsetting the cost. Solution: Perform a plasmid curing experiment and re-measure fitness.
- Growth Conditions: The fitness cost is condition-dependent. Solution: Measure fitness under multiple, relevant environmental conditions (e.g., different media, temperatures).
- Measurement Sensitivity: Your fitness assay (e.g., growth curve) may lack resolution. Solution: Use competitive co-culture assays with a neutral fluorescent marker and measure by flow cytometry over 50+ generations.
Q2: My qPCR data for tandem gene amplification is highly variable between technical replicates. How can I improve accuracy? A: Variability often stems from inefficient DNA isolation or primer issues.
- Troubleshooting Steps:
- DNA Quality: Ensure you are using a genomic DNA isolation protocol optimized for long fragments (e.g., phenol-chloroform extraction). Check DNA integrity on a pulsed-field gel.
- Primer Design: Design primers in unique, conserved single-copy regions flanking the amplified unit. Avoid primers within the repeat unit itself.
- Standard Curve: Use a carefully quantified standard (e.g., BAC clone containing the locus) for absolute quantification. Include a single-copy reference gene control.
- Inhibition Test: Perform a dilution series of your template to check for PCR inhibitors.
- Reporter System: Engineer a promoterless fluorescent or luminescent gene onto the transposon. Activation signals a new insertion event. Use flow cytometry or time-lapse microscopy to track.
- Deep Sequencing: Use a Tn-seq approach. Perform high-throughput sequencing of transposon-genome junctions from population samples taken at multiple time points during antibiotic exposure. This provides a quantitative map of insertion sites and their frequencies over time.
Q4: When attempting to induce tandem amplifications via antibiotic stress, my bacterial population simply dies. How do I find the sub-inhibitory "selection window"? A: Determining the correct pressure is critical.
- Protocol: Determination of Amplification-Inducing Pressure:
- Perform a minimum inhibitory concentration (MIC) assay in your growth medium.
- In a separate flask or plate, expose a large initial population (e.g., >10^10 cells) to a gradient of antibiotic concentrations from 0.25x MIC to 4x MIC.
- Incubate for 48-72 hours. Monitor OD600.
- Subculture visibly turbid wells/tubes onto antibiotic-containing agar plates.
- The concentration that yields the highest number of resistant colonies is likely within the amplification selection window. This is typically at or just above the MIC of the parent strain.
Table 1: Comparative Metrics of Gene Copy Number Increase Mechanisms
| Mechanism | Typical Copy Number Increase | Stability (Inheritance) | Rate of Formation | Primary Horizontal Transfer? | Common in Heteroresistance? |
|---|---|---|---|---|---|
| Plasmids | 1 - 100+ copies/cell | High (vertical), can be lost without selection | Low (acquisition event) | Yes (conjugation, transformation) | Yes (e.g., blaKPC on plasmids) |
| Transposons | 1 - ~5 copies/cell (per element) | Moderate (replicative transposition) | Moderate (10^-3 to 10^-7 per generation) | Yes, via plasmid/ phage vectors | Yes (e.g., IS elements amplifying mecA) |
| Tandem Amplifications (DR) | 2 - 50+ copies/cell | Low (unequal crossing over) | High under strong selection (10^-2) | No (vertical only) | Yes (e.g., ampC in E. coli, drug target gene amplification) |
| Tandem Amplifications (Rolling Circle) | 10 - 100s+ copies/cell | Very Low (extrachromosomal) | Very High under selection | Potentially (via transformation) | Emerging (e.g., blaOXA-58 in Acinetobacter) |
Table 2: Experimental Techniques for Detection and Quantification
| Technique | Mechanism Detected | Quantitative Output | Required Controls | Approximate Cost per Sample |
|---|---|---|---|---|
| qPCR/ddPCR | Plasmids, Tandem Amps | Absolute Copy Number | Single-copy genomic reference gene | $5 - $15 |
| Whole Genome Sequencing (Short-Read) | All, but limited for tandem repeats | Read Depth Coverage, Insertion Sites | Unamplified parent strain sequence | $50 - $200 |
| Long-Read Sequencing (ONT, PacBio) | All, especially tandem amps | Direct de novo assembly of repeat structures | Base-called control DNA | $200 - $500 |
| Pulsed-Field Gel Electrophoresis (PFGE) | Large Tandem Amps | Size of chromosomal region | Size standard, restriction enzyme control | $10 - $20 |
| Southern Blot | Tandem Amps, Transposons | Hybridization band size/number | Probe for non-amplified locus | $15 - $30 |
Detailed Experimental Protocols
Protocol 1: Detecting Tandem Amplifications via qPCR and Southern Blot Objective: Confirm and quantify tandem amplifications of a chromosomal drug target gene. Materials: See "Scientist's Toolkit" below. Steps:
- DNA Extraction: Isolate genomic DNA from pre- and post-selection populations using a kit optimized for long DNA.
- qPCR Setup:
- Design Target Primers amplifying a 100-150 bp region within the suspected amplified unit.
- Design Reference Primers amplifying a 100-150 bp region of a known single-copy gene (e.g., rpoB).
- Run reactions in triplicate using a SYBR Green master mix. Use a serial dilution of a control genomic DNA to generate a standard curve for both target and reference.
- Calculation: Use the ΔΔCq method or absolute quantification from standard curves to determine target gene copy number relative to the reference.
- Southern Blot Validation:
- Digest 2-5 µg of genomic DNA with a restriction enzyme that cuts once within the amplified unit and nowhere else in the immediate flanking region.
- Run digest on a 0.8% agarose gel at 25V for 16 hours for optimal separation of large fragments.
- Depurinate, denature, and neutralize DNA in-gel. Transfer to a nylon membrane via capillary blotting.
- Prepare a digoxigenin (DIG)-labeled DNA probe targeting a sequence inside the repeat unit.
- Hybridize probe to membrane overnight at 42°C. Wash stringently.
- Detect using anti-DIG-AP conjugate and CDP-Star chemiluminescent substrate. Image. A ladder of bands indicates tandem repeats of different copy numbers.
Protocol 2: Tn-seq for Tracking Transposon Amplification Dynamics Objective: Quantify transposon insertion site abundance changes under antibiotic selection. Steps:
- Library Preparation: Create a saturating mariner transposon mutant library in your target strain.
- Selection: Challenge the library with your antibiotic of interest at sub-MIC and MIC levels. Include an untreated control. Harvest cells at multiple time points (0h, 6h, 24h).
- DNA Prep & Sequencing: Isolate genomic DNA. Fragment and ligate to adapters that specifically amplify from the transposon end into the flanking genomic DNA.
- Bioinformatics: Map sequenced reads to the reference genome. Count reads for each unique insertion site. Normalize counts by total reads per sample.
- Analysis: Compare insertion site abundances between time points and conditions. Sites that significantly increase in abundance under selection indicate loci where insertion provides a fitness advantage (potentially through gene amplification if in tandem).
Visualizations
Diagram 1: Mechanisms of Gene Copy Number Increase (Max Width: 760px)
Diagram 2: Experimental Workflow for Amplification Research (Max Width: 760px)
The Scientist's Toolkit: Research Reagent Solutions
Table 3: Essential Materials for Amplification Research
| Item | Function in Experiment | Example Product/Catalog # (for illustration) |
|---|---|---|
| High-Fidelity DNA Polymerase | Accurate amplification of probes and fragments for cloning/qPCR standards. | Thermo Fisher Scientific Platinum SuperFi II |
| Long Fragment DNA Isolation Kit | Isolation of intact genomic DNA for Southern blot/PFGE. | Qiagen Genomic-tip 100/G |
| DIG DNA Labeling & Detection Kit | Non-radioactive labeling and detection for Southern blot probes. | Roche DIG-High Prime DNA Labeling and Detection Starter Kit II |
| Pulsed-Field Certified Agarose | Gel matrix for separating large DNA fragments (10 kb - 2 Mb+). | Bio-Rad Certified Megabase Agarose |
| ddPCR Supermix for Copy Number | Digital PCR mix for absolute quantification of gene copy number without standard curves. | Bio-Rad ddPCR Supermix for Probes (No dUTP) |
| Mariner Transposon Donor Plasmid | For generating saturated transposon mutant libraries for Tn-seq. | EZ-Tn5 pMOD |
| Next-Generation Sequencing Kit | Preparing libraries for Illumina-based Tn-seq or WGS. | Illumina Nextera XT DNA Library Prep Kit |
| Competitive Fitness Reference Strain | Fluorescently tagged, isogenic susceptible strain for precise fitness cost measurement. | Construct via allelic exchange (e.g., gfp or mCherry at neutral site) |
| Automated Cell Counter/Flow Cytometer | Precise enumeration for competitive co-culture assays. | BioRad TC20 / BD Accuri C6 Plus |
Troubleshooting & FAQs for Heteroresistance Fitness Cost Assays
Q1: In my competitive fitness assay, the resistant subpopulation is consistently outcompeted, but the final colony counts are lower than expected. What could be causing this? A: This often indicates an excessive fitness burden or an issue with the assay conditions. First, verify the initial inoculum ratio using qPCR or selective plating to confirm your starting point. Ensure the growth medium does not inadvertently favor the susceptible population; use a rich, non-selective medium like Mueller-Hinton II broth or LB broth. Check the duration of the assay; if it runs too long, the fitness cost may lead to secondary compensatory mutations, skewing results. A standard duration is 24-48 growth cycles (approximately 5-10 serial passages). Ensure proper aeration and temperature control throughout.
Q2: When measuring metabolic flux using Seahorse or similar analyzers, my resistant bacterial strains show high variability in Oxygen Consumption Rate (OCR) and Extracellular Acidification Rate (ECAR). How can I improve reproducibility? A: High variability often stems from inconsistent culture preparation. Key steps:
- Standardize Growth Phase: Always harvest cells from the same growth phase (mid-log phase is recommended, e.g., OD600 ~0.5). Use optical density monitoring rigorously.
- Normalize Cell Count: Do not rely solely on OD. Use a hemocytometer or automated cell counter to seed an exact number of cells per well (e.g., 2x10^5 bacterial cells/well for a 96-well plate).
- Assay Medium: Use a substrate-limited, buffered assay medium (like DMEM without glucose/pyruvate, supplemented with 10mM glucose, 1mM pyruvate, and 2mM L-glutamine, pH 7.4) to force reliance on oxidative phosphorylation. Allow 30-60 minutes for temperature and pH equilibration in the analyzer before starting measurements.
- Inhibitor Controls: Include wells with standard inhibitors (e.g., 1µM Oligomycin, 1.5µM FCCP, 100nM Rotenone/1µM Antimycin A) in every run to validate assay function.
Q3: My time-kill curve analysis for heteroresistant populations fails to show the characteristic "regrowth" phase. What are the potential protocol errors? A: The absence of regrowth typically suggests the drug concentration is too high, fully suppressing the resistant subpopulation, or the sampling frequency is insufficient.
- Drug Concentration: Use a range of multiples (e.g., 0.5x, 1x, 2x, 4x, 8x) of the MIC for the main population. The regrowth of heteroresistant strains is often visible at 2-4x MIC.
- Sampling Frequency: Increase sampling points, especially between hours 8 and 24. Sample every 2 hours for the first 12 hours, then at 18h and 24h. Plate large volumes (100µL) of undiluted and serially diluted culture to capture low-frequency subpopulations.
- Population Verification: Confirm the presence of the resistant subpopulation at the start of the experiment using population analysis profiling (PAP).
Q4: How do I accurately quantify the trade-off between resistance gene copy number and growth rate in a plasmid-borne resistance model? A: This requires correlating copy number with a direct growth metric.
- Copy Number Quantification: Extract plasmid DNA from samples taken at mid-log phase. Use digital droplet PCR (ddPCR) with one probe for a plasmid-specific gene (e.g., blaCTX-M) and one for a single-copy chromosomal reference gene (e.g., rpoB). The ratio gives absolute copy number per cell.
- Growth Rate Measurement: Simultaneously, measure the maximum growth rate (µmax) in the same culture using a high-frequency (every 10 min) OD600 reading in a microplate reader. Calculate µmax as the slope of the ln(OD600) vs. time plot during exponential phase.
- Correlation: Plot plasmid copy number against µmax for different isolates or under different inducer concentrations. Use linear regression to model the fitness cost per copy.
Essential Research Reagent Solutions
| Item | Function in Fitness Cost Assays |
|---|---|
| Mueller-Hinton II Broth (Cation-Adjusted) | Standard, reproducible broth for antimicrobial susceptibility and competitive growth assays. |
| BD Bactec Blood Culture Media | For simulating in vivo-like conditions and studying fitness of bacterial subpopulations from blood. |
| Seahorse XFp Cell Energy Phenotype Test Kit | Enables simultaneous measurement of OCR and ECAR to classify metabolic phenotype (quiescent vs. active). |
| Digital Droplet PCR (ddPCR) Supermix | For absolute, precise quantification of resistance gene copy number variance within a heteroresistant population. |
| Population Analysis Profile (PAP) Agar Plates | Agar plates containing a gradient of antibiotic concentration (e.g., 0-32x MIC) to visualize and quantify subpopulations. |
| SYTOX Green Nucleic Acid Stain | Membrane-impermeant dye to measure cell viability and membrane integrity changes linked to metabolic stress. |
| CellTiter-Glo Microbial Cell Viability Assay | Luminescent assay to quantify ATP levels as a direct correlate of metabolically active cells. |
| pUC19 ori High-Copy Plasmid Vectors | Standard vectors for constructing and controlling gene copy number in model fitness cost experiments. |
Table 1: Metabolic Parameters in Isogenic Susceptible vs. Resistant Strains
| Strain (E. coli) | MIC (µg/mL) | Max Growth Rate (µmax, h⁻¹) | Lag Time (h) | ATP (nmol/10^9 cells) | Basal OCR (pmol/min) |
|---|---|---|---|---|---|
| WT Susceptible | 1 | 0.92 ± 0.04 | 0.5 ± 0.1 | 4.1 ± 0.3 | 125 ± 8 |
| gyrA Mutant | 32 | 0.61 ± 0.05 | 1.2 ± 0.2 | 2.8 ± 0.4 | 85 ± 10 |
| Plasmid-borne ESBL | 64 | 0.53 ± 0.06 | 1.5 ± 0.3 | 2.5 ± 0.5 | 78 ± 12 |
Table 2: Fitness Cost of Common Resistance Mechanisms in P. aeruginosa
| Resistance Mechanism | Relative Fitness (CFU ratio after 10 gens) | Estimated % Reduction in Growth Rate | Compensatory Mutation Frequency |
|---|---|---|---|
| Wild-type (PAO1) | 1.00 (ref) | 0% | N/A |
| oprD knockout | 0.89 ± 0.07 | ~8% | 1 x 10⁻⁹ |
| mexR mutation | 0.95 ± 0.05 | ~4% | 5 x 10⁻⁸ |
| Carbapenemase (VIM) plasmid | 0.62 ± 0.11 | ~35% | 2 x 10⁻⁶ |
Detailed Experimental Protocols
Protocol 1: Competitive Fitness Assay (In Vitro) Objective: Quantify the relative fitness of antibiotic-resistant vs. susceptible isogenic strains.
- Strain Preparation: Grow overnight cultures of resistant (R) and susceptible (S) strains in separate tubes.
- Mixing: Mix R and S cultures at a 1:1 ratio in a fresh, pre-warmed flask of non-selective broth. Verify the initial ratio (CFU R / CFU S) by plating on selective and non-selective agar (Time = 0).
- Serial Passage: Incubate the mixed culture at 37°C with shaking. Every 24 hours (approximately 10-12 generations), dilute 1:1000 into fresh, pre-warmed broth. This constitutes one passage.
- Sampling & Plating: At each passage (e.g., 0, 1, 5, 10), sample the culture, perform serial dilutions, and plate on both non-selective agar and agar containing the antibiotic at a concentration that inhibits the S strain.
- Calculation: Calculate the competitive index (CI) at time t: CI = (CFURt / CFUSt) / (CFUR0 / CFUS0). A CI < 1 indicates a fitness cost for the resistant strain.
Protocol 2: Metabolic Profiling using a Seahorse XF Analyzer (Microbes) Objective: Compare the real-time metabolic phenotypes of bacterial strains.
- Cell Preparation: Grow strains to mid-log phase. Wash cells twice in sterile PBS, then resuspend in Seahorse assay medium (e.g., unbuffered RPMI, pH 7.4).
- Loading: Normalize cell suspension to an OD600 of 0.1 (or a predetermined cell count). Load 175 µL into each well of a Seahorse XFp cell culture plate.
- Centrifugation: Centrifuge the plate at 2000 x g for 10 minutes to create a bacterial monolayer. Carefully add 135 µL of fresh assay medium on top without disturbing the pellet.
- Sensor Cartridge Hydration: Hydrate the sensor cartridge in a CO2-free incubator overnight.
- Assay Run: Load the designated ports of the sensor cartridge with compounds (e.g., glucose, inhibitors). Calibrate the instrument. Run the assay program (e.g., 3 min mix, 2 min wait, 3 min measure) for baseline and after each compound injection.
- Analysis: Use Wave software to normalize data to cell count (post-experiment, lyse cells and measure DNA content) and calculate key parameters: Basal OCR, Basal ECAR, ATP-linked respiration, etc.
Diagrams
Title: Gene Copy Number Impact on Fitness Burden
Title: Experimental Workflow for Fitness Burden Quantification
Troubleshooting Guides & FAQs
Q1: Our fluctuation assay for heteroresistance shows inconsistent amplification rates of the resistant subpopulation between replicates. What are the key variables to control? A1: Inconsistent amplification often stems from uncontrolled pre-culture conditions. Key variables are:
- Inoculum Size: Use a standardized inoculum from a mid-log phase culture (OD600 ~0.4-0.6). Avoid stationary phase cells.
- Antibiotic Pre-exposure: Ensure the pre-culture is grown in the complete absence of the antibiotic being studied.
- Population Bottleneck: Precisely control the number of cells used to initiate the assay (typically 100-1000 cells). Use serial dilution and plate counting for accuracy.
- Growth Phase Harvesting: For chromosomal copy number variation studies, harvest cells at the same growth phase (mid-log) for DNA extraction.
Q2: When measuring fitness cost via growth curves, the resistant isolate sometimes shows no cost, contradicting competition assay results. Why? A2: This discrepancy typically indicates a measurement sensitivity issue.
- Isolated vs. Competitive Growth: Growth in pure culture allows full resource access, masking subtle costs. Competition assays with an isogenic susceptible strain are more sensitive.
- Protocol Adjustment: Run parallel growth curves in mono- and co-culture. For co-culture, use differentially selectable markers (e.g., different antibiotic resistance genes not under study, or fluorescent tags) to quantify ratios via plating on selective media or flow cytometry over 24-48 hours.
- Media Richness: Fitness costs are often magnified in minimal media. Repeat assays in both rich and minimal media.
Q3: During qPCR analysis of gene copy number variation (CNV), the fold-change values are extremely high and variable. What could be wrong? A3: This usually points to issues with DNA quality, primer specificity, or normalization.
- DNA Quality: Ensure genomic DNA is free of RNA and contaminants. Use RNase A treatment and validate purity via A260/A280 ratio (~1.8-2.0).
- Primer Specificity: Confirm primers are unique to the target amplicon and do not bind to homologous sequences. Perform melt curve analysis and run an agarose gel to check for a single product.
- Normalization Gene: Use a stable, single-copy chromosomal gene for normalization (e.g., rpoB, gyrB). Never use rRNA genes, as their copy number can vary. Validate that the Cq of your normalizer is consistent across all samples.
Q4: How can we distinguish a "fixed" mutation from a reversible amplification in a heteroresistant population after prolonged drug exposure? A4: A stability assay is required.
- Protocol: Passage the resistant population in drug-free liquid medium for ~50-100 generations. Every 10 generations, plate samples on both non-selective and drug-containing agar. Calculate the ratio of CFUs on drug-containing vs. non-selective plates.
- Interpretation: A stable, fixed mutation will maintain a high resistance frequency (~100%). A reversible amplification (unstable) will show a rapid decline in the resistant subpopulation frequency.
Q5: Our competition assays between resistant and susceptible strains show high variability. How can we improve precision? A5: Focus on assay initialization and sampling.
- Standardized Starting Ratio: Begin with a precise 1:1 ratio, determined by plate counting, not OD600 estimation.
- Consistent Total Population Density: Keep the total population density below carrying capacity to avoid stationary phase effects. Typically, start at ~10^5 CFU/mL total.
- Adequate Replication: Perform at least 6 biological replicates.
- Freeze-down Aliquots: Prepare a single large batch of each competitor strain, aliquot, and freeze at -80°C. Use a fresh aliquot for each experiment to minimize founder effects.
Table 1: Common Genetic Mechanisms in Heteroresistance & Their Stability Profiles
| Mechanism | Typical Gene Targets | Fluctuation Rate | Fitness Cost (Typical Range) | Stability (Without Drug) | Detection Method |
|---|---|---|---|---|---|
| Tandem Amplification | Drug efflux pumps (mepA, adeABC), DHFR enzymes | High (10^-2 - 10^-4/cell/division) | Moderate-High (5-40% growth defect) | Unstable (Reversible) | qPCR, WGS |
| Plasmid Copy Number Variation | Beta-lactamases (blaCTX-M, blaKPC) | Moderate (10^-3 - 10^-5) | Low-Moderate (0-20%) | Variable (Stable if addiction systems present) | Plasmid isolation, qPCR |
| Phase Variation | Regulators (arnT for LPS modification) | High (10^-1 - 10^-3) | Low (Often context-dependent) | Reversible | Sequencing of slippage tracts |
| Episomal Integration/Excision | Multiple, via mobile elements | Low-Moderate (10^-4 - 10^-6) | Variable | Semi-stable | PCR across junctions, WGS |
| Point Mutation (Fixed) | RNA polymerase (rpoB), Gyrase (gyrA) | Very Low (10^-7 - 10^-9) | High (Can be >50%) | Stable (Permanent) | Targeted Sequencing |
Table 2: Comparison of Key Methodologies for Quantifying Heteroresistance
| Method | What it Measures | Throughput | Cost | Key Quantitative Output | Best For |
|---|---|---|---|---|---|
| Population Analysis Profile (PAP) | Frequency of subpopulations at different drug concentrations | Low | Low | MIC and subpopulation frequency | Screening, phenotypic confirmation |
| Fluctuation Assay | Rate of emergence of resistant subpopulation | Medium | Low | Amplification/mutation rate per cell per division | Measuring genetic instability |
| qPCR/ddPCR | Gene copy number variance in a population | High | Medium | Mean copy number & variance | Tracking CNV dynamics in bulk |
| Single-Cell Imaging (Microfluidics) | Growth rate & division history of single cells under stress | Low | High | Lineage trees, single-cell MICs | Linking phenotype to genealogy |
| Whole Genome Sequencing (Bulk) | Genetic basis of resistance (mutations, amplifications) | Medium | High | Genomic map of variants | Identifying mechanisms |
| Whole Genome Sequencing (Single-Cell) | Genetic heterogeneity within a population | Very Low | Very High | Genotype of individual cells | Directly linking genotype to phenotype |
Experimental Protocols
Protocol 1: Fluctuation Assay to Measure Amplification Rate of a Resistance Gene Objective: Quantify the rate at which a susceptible progenitor cell generates a subpopulation with an increased copy number of a target resistance gene.
- Pre-culture: Grow the susceptible strain (confirmed low baseline copy number) overnight in antibiotic-free liquid medium.
- Inoculation: Dilute the culture to ~1000 cells/mL. Dispense 100µL (~100 cells) into each of 50-100 tubes containing 1mL of fresh, antibiotic-free medium. Also, plate 100µL of a 10^-6 dilution to determine the exact average number of cells per tube (N0).
- Outgrowth: Incubate all tubes until saturation (~24-48h, depending on species). This allows amplifications to occur independently in each parallel population.
- Selection: From each tube, plate the entire culture (or a known volume) onto agar containing the antibiotic at a concentration that inhibits the baseline susceptible population. Also plate an appropriate dilution (e.g., 10^-6) onto drug-free agar to determine the total viable count (Nt) for each culture.
- Calculation: Count colonies after 24-48h. The number of tubes with 0 resistant colonies (r) and the total number of resistant colonies from all tubes (R) are used to calculate the rate (m) using the Ma-Sandri-Sarkar Maximum Likelihood Estimator (via tools like bz-rates or Fluctuation Analysis Calculator). The amplification rate is m / (Nt - N0).
Protocol 2: Head-to-Head Competition Assay for Fitness Cost Objective: Precisely measure the relative fitness disadvantage of a resistant isolate compared to an isogenic susceptible strain in the absence of drug pressure.
- Strain Preparation: Use a resistant isolate (R) and a susceptible (S) progenitor. Introduce a neutral, differential marker (e.g., lacZ deletion, an antibiotic resistance not under study, or a fluorescent protein) into one strain to allow discrimination. Grow separate overnight cultures.
- Initial Mixture: Mix the R and S cultures in a 1:1 ratio based on exact plate counts (not OD). Dilute the mixture to a starting density of ~10^5 CFU/mL in fresh, drug-free medium.
- Competition: Incubate the co-culture with shaking. Sample at time T0 (immediately after mixing) and approximately every 12 hours for 2-3 days (~10-15 generations).
- Plating & Enumeration: At each time point, perform serial dilutions and plate on:
- Non-selective media: To determine total CFU/mL.
- Selective media: To determine the count of the marked strain (e.g., containing X-gal, or a neutral antibiotic).
- Calculation: For each time point, calculate the ratio of R/S. The selection rate coefficient (s) per generation is calculated as: s = [ln(R/S)final - ln(R/S)initial] / number of generations. A negative s indicates a fitness cost. Relative fitness (W) = e^s or 1 + s (for small s).
Diagrams
Diagram 1: Heteroresistance Stability Assay Workflow
Diagram 2: Gene CNV Impact on Fitness & Resistance
The Scientist's Toolkit: Key Research Reagent Solutions
| Item | Function & Application in Heteroresistance Research |
|---|---|
| Glycerol Stock Solution (50%) | Long-term archiving of isogenic progenitor and variant strains at -80°C to ensure reproducible lineage comparisons. |
| Neutral Differential Marker Plasmids/Kits (e.g., pUA66-GFP, pCMR-RFP, lacZ mutagenesis kit) | To tag susceptible/resistant strains with fluorescent or selectable markers for precise quantification in competition assays. |
| qPCR/ddPCR Master Mix with Evagreen or Probe Chemistry | Accurate quantification of gene copy number variation (CNV) in mixed populations. ddPCR is superior for detecting rare, high-copy variants. |
| PhaseLock/Gel Extraction Kits | High-quality, pure genomic DNA extraction for qPCR and sequencing, minimizing shearing which complicates CNV analysis. |
| Muller-Hinton or Cation-Adjusted Broth | Standardized media for antibiotic susceptibility testing (PAP assays) to ensure reproducible drug activity. |
| Microfluidic Plates/Chips (e.g., Mother Machine style) | For single-cell, long-term imaging to track growth, division, and resistance expression in real-time under controlled environments. |
| Ma-Sandri-Sarkar Rate Calculator (bz-rates Web Tool) | Essential bioinformatics tool for accurately calculating mutation/amplification rates from fluctuation assay data. |
| Next-Generation Sequencing Library Prep Kit | For preparing libraries from both bulk populations and single-cell sorted isolates to identify genetic mechanisms of heterogeneity. |
| Tetrazolium Dye (e.g., MTT, TTC) | To improve visualization of colony forming units (CFUs) on agar plates, especially for faintly growing resistant subpopulations. |
| Antibiotic Gradient Strips (Etest) or MIC Panels | For rapid, preliminary screening of heterogeneous resistance profiles within a bacterial population. |
Technical Support Center: Troubleshooting Heteroresistance Experiments
This support center addresses common experimental challenges in heteroresistance research, framed within the thesis context of balancing gene copy number and fitness cost.
FAQs & Troubleshooting Guides
Q1: During population analysis profiling (PAP) for colistin heteroresistance in Acinetobacter baumannii, I observe inconsistent subpopulation distributions between replicates. What could be the cause? A: This is often due to the instability of the mcr-1 plasmid or variations in the expression of the pmrCAB operon, which is sensitive to subtle environmental calcium/magnesium fluctuations. Ensure consistent medium preparation, especially divalent cation concentrations. Pre-culture all biological replicates from a single colony in identical media for the same number of generations before the PAP assay.
Q2: When measuring the fitness cost of mecA amplification in MRSA heteroresistant strains via competitive growth assays, the cost seems negligible, contradicting literature. What might be wrong? A: The fitness cost of mecA amplification can be masked by compensatory mutations or influenced by the experimental growth medium. Try the following:
- Use a defined, nutrient-limited medium (e.g., RPMI) instead of rich broth (TSB) to stress metabolic burdens.
- Sequence the strain after passage to check for compensatory changes in mecR1 or fem factors.
- Ensure your reference strain is isogenic, differing only in the resistance determinant.
Q3: My time-kill curves for Candida auris against echinocandins show a "rebound" growth, but I cannot confirm heteroresistance via single-cell imaging. What alternative method can I use? A: Rebound growth may be due to persister cells rather than genetically heteroresistant clones. To distinguish:
- Perform a Subculturing Assay: Plate cells from the "rebound" growth onto drug-free media. Then, re-challenge the new colonies with the echinocandin. True heteroresistant colonies will maintain elevated MICs, while persister-derived colonies will be drug-sensitive.
- Quantify FKS1 Mutant Alleles: Use droplet digital PCR (ddPCR) on the rebound population to detect and quantify low-frequency FKS1 hotspot mutations, providing a direct, quantitative link to resistance gene copy number variation.
Q4: How can I accurately quantify the gene copy number variation of a resistance gene (e.g., mcr-1, mecA) within a heteroresistant population? A: Standard qPCR can be imprecise for copy number variation in mixed populations. Implement digital PCR (dPCR) or ddPCR.
- Protocol Outline:
- Extract genomic DNA from the heteroresistant population at various time points (pre- and post-antibiotic exposure).
- Design primers/probes for the target resistance gene and a single-copy reference gene (e.g., rpoB for bacteria, ACT1 for yeast).
- Partition the sample into thousands of individual reactions (via chips or droplets).
- Perform endpoint PCR and analyze the fraction of positive reactions for each target. The ratio of target to reference concentrations directly yields the average copy number in the population, sensitive to minor subpopulations.
Key Quantitative Data in Heteroresistance
Table 1: Key Resistance Genes, Mechanisms, and Associated Fitness Costs in Model Pathogens
| Pathogen | Resistance Gene(s) | Mechanism of Heteroresistance | Typical Copy Number Variation (Approx. Range) | Measurable Fitness Cost (Relative Growth Rate) | Primary Detection Method |
|---|---|---|---|---|---|
| Acinetobacter baumannii | pmrCAB (chromosomal) | LPS modification via gene amplification | 1x to 8-16x | Moderate to High (0.7-0.9) | PAP, ddPCR, WGS |
| Staphylococcus aureus (MRSA) | mecA (SCCmec element) | mecA expression variation & SCCmec rearrangements | 1x to 3-5x | Low to Moderate (0.85-0.98)* | PAP, cefoxitin Etest, Flow-Cytometry |
| Enterobacteriaceae | mcr-1 (plasmid) | Plasmid copy number variation & instability | 1-3x to >10x | Low (0.92-1.0) | PAP, plasmid quantification, ddPCR |
| Candida auris | FKS1 (chromosomal) | Aneuploidy (Chr5 duplication) or point mutations | 1x (mutant) to 2x (disomy) | High for disomy (0.6-0.8) | WGS, ddPCR, MiCAM |
Cost can be ameliorated by compensatory mutations. *Cost is often plasmid-dependent and can be low in permissive hosts.
Experimental Protocol: Population Analysis Profiling (PAP) for Colistin Heteroresistance
Objective: To quantify the frequency of resistant subpopulations within a bacterial strain capable of growing at elevated antibiotic concentrations.
Materials:
- Cation-adjusted Mueller Hinton Broth (CAMHB)
- Colistin sulfate stock solution
- Agar plates
- Bacterial culture (overnight, adjusted to 0.5 McFarland)
- Sterile spreaders or beads
Procedure:
- Prepare a series of agar plates containing colistin at concentrations ranging from 0x to 10x the MIC of the main population (e.g., 0, 0.5, 1, 2, 4, 8, 16 µg/mL).
- Perform serial 10-fold dilutions (up to 10⁻⁶) of the standardized bacterial suspension in sterile saline.
- Spot 10 µL of each dilution onto the corresponding colistin-containing plate and a drug-free control plate. Alternatively, spread 100 µL of selected dilutions for a precise colony count.
- Incubate plates at 35°C for 24-48 hours.
- Count colonies on plates with 20-200 colonies. The frequency of resistant subpopulations is calculated as (CFU/mL on drug plate) / (CFU/mL on drug-free plate).
The Scientist's Toolkit: Research Reagent Solutions
Table 2: Essential Reagents for Heteroresistance Research
| Item | Function in Heteroresistance Research |
|---|---|
| Cation-Adjusted Mueller Hinton Broth | Standardized medium for MIC/PAP assays; correct cation levels are critical for polymyxin activity. |
| Etest Gradient Strips | Preliminary screening for heteroresistance phenotypes by detecting "trailing" or sub-populations within the ellipse. |
| Digital PCR (dPCR/ddPCR) Master Mix | Absolute, precise quantification of resistance gene copy number variation without a standard curve. |
| Propidium Monoazide (PMA) | Viability dye for PCR; distinguishes viable heteroresistant cells from dead cells with residual DNA in time-kill assays. |
| Synthetic Human Serum | For in vitro models that mimic host conditions, influencing expression of resistance and fitness costs. |
| Anti-FKS1 monoclonal antibody | For tracking Fks1 expression levels in single Candida cells via flow cytometry to correlate with echinocandin resistance. |
Diagrams
Title: Heteroresistance Population Dynamics Cycle
Title: Balancing Gene Copy Number and Fitness Cost
Measuring the Equilibrium: Advanced Techniques to Quantify Copy Number Dynamics and Fitness Landscapes
Technical Support Center: Troubleshooting & FAQs
Context: This support center is designed for researchers investigating heteroresistance, specifically balancing plasmid-borne gene copy number and associated fitness costs, using ddPCR, qPCR, and WGS.
Frequently Asked Questions (FAQs)
Q1: In ddPCR for quantifying plasmid copy number (PCN), my positive control shows unexpected low amplitude. What could be wrong? A: This typically indicates suboptimal PCR efficiency or droplet generation failure. First, verify the droplet generator gaskets and seals for wear. Ensure your DNA is not heavily contaminated with EDTA or salts, which can inhibit amplification. Perform a fresh 1:10 dilution of your template in TE buffer (pH 8.0) and re-run.
Q2: My qPCR amplification curves for a fitness cost marker gene (e.g., rpsL) are sigmoidal but show very late Cq values (>35) even for undiluted genomic DNA. A: Late Cq values suggest low template quality or quantity, or primer/probe issues.
- Troubleshooting Steps:
- Check DNA integrity on a 1% agarose gel. Degraded DNA will appear as a smear.
- Re-quantify DNA using a fluorometric method (e.g., Qubit). UV absorbance (A260) can overestimate concentration if contaminants are present.
- Verify primer and probe sequences align perfectly with your strain's genome (from your WGS data). A single SNP can drastically reduce efficiency.
Q3: After whole-genome sequencing of heteroresistant populations, I cannot confidently identify low-frequency plasmid variants. What bioinformatic parameters should I adjust? A: Identifying low-frequency variants requires high sequencing depth and stringent variant calling.
- Protocol Adjustment: Sequence to a minimum depth of 200x for the population.
- Bioinformatic Protocol: In your variant caller (e.g.,
breseq,LoFreq), lower the minimum variant frequency threshold to 0.01 (1%) but increase the minimum supporting read count to 20 and minimum base quality to Q30. Always compare against a matched, high-quality reference genome from an ancestral strain.
Q4: How do I differentiate between increased gene expression and increased gene copy number as a mechanism in my heteroresistance model using these tools? A: This requires a parallel experimental design.
- Experimental Protocol:
- Copy Number: Use ddPCR on genomic DNA with assays targeting the resistance gene and a single-copy chromosomal reference gene (e.g., gyrB). Calculate the ratio.
- Expression: Use qPCR on cDNA (reverse-transcribed from RNA) from the same culture with assays for the resistance gene's mRNA and a stable housekeeping gene (e.g., rpoD). Calculate the ΔΔCq.
- Interpretation: A change in ddPCR ratio indicates a copy number variation. A change in qPCR ΔΔCq on cDNA, after normalizing for any copy number change detected by ddPCR, indicates a change in expression per gene copy.
Table 1: Comparison of Key Quantitative Techniques for Heteroresistance Research
| Feature | ddPCR | qPCR | Whole-Genome Sequencing (Illumina) |
|---|---|---|---|
| Primary Use | Absolute quantification of CNV & rare variants | Relative quantification of DNA/RNA; high-throughput screening | Identification of SNVs, indels, large deletions, plasmid structures |
| Precision | High (Poisson-based) | Moderate (depends on standard curve) | High for high-frequency variants |
| Variant Detection Sensitivity | ~0.001% (1 in 100,000) | ~1-10% (for SYBR Green) | ~1-5% (standard pipeline); <1% with specialized tools |
| Typical Sample Throughput | Low to Medium (1-96 samples) | High (96-384 well plates) | High (multiplexed libraries per run) |
| Best for Fitness Cost Studies | Tracking plasmid copy number dynamics under drug pressure | Profiling expression of fitness-linked genes | Finding compensatory mutations in chromosomal DNA |
Table 2: Common Experimental Artifacts and Solutions
| Problem | Likely Cause | Recommended Solution |
|---|---|---|
| ddPCR: High rate of rain (intermediate droplets) | Suboptimal thermal cycling or droplet instability. | Increase annealing/extension temperature by 1-2°C; ensure consistent thermocycler lid temperature. |
| qPCR: Poor replicate reproducibility | Pipetting error or uneven mixing of master mix. | Centrifuge plates before run; prepare a single, large-volume master mix for all replicates. |
| WGS: Low coverage of plasmid regions | Bias in library prep (e.g., fragmentation) or plasmid loss. | Use a library prep kit validated for plasmids; extract DNA from a culture under selection. |
Essential Experimental Protocols
Protocol 1: Absolute Plasmid Copy Number (PCN) Determination via ddPCR
- DNA Isolation: Extract genomic DNA using a kit that efficiently recovers large plasmids (e.g., Qiagen Plasmid Midi Kit modified with an extended lysis step). Treat with RNase A.
- Assay Design: Design QX200 ddPCR assays (Bio-Rad) for a target on the plasmid (e.g., blaCTX-M-15) and a single-copy chromosomal reference (e.g., phoB). Validate assay efficiency (90-110%) via qPCR first.
- Droplet Generation & PCR: Combine 11µL of 2x ddPCR Supermix, 1.1µL of each 20x assay, and ~10ng of gDNA (in up to 5.8µL nuclease-free water). Generate droplets in the QX200 Droplet Generator. Transfer 40µL to a 96-well plate and seal. Run PCR: 95°C for 10 min; 40 cycles of 94°C for 30s and 58-60°C (assay-specific) for 60s; 98°C for 10 min (ramp rate: 2°C/s).
- Analysis: Read plate on QX200 Droplet Reader. Use QuantaSoft software to set amplitude thresholds. Calculate PCN = (Concentration of Target / Concentration of Reference).
Protocol 2: Identifying Compensatory Mutations via Whole-Genome Sequencing
- Sample Selection: Sequence three biological replicates each of: (a) Ancestral susceptible strain, (b) Heteroresistant population after antibiotic exposure, (c) Resistant population after prolonged passaging.
- Library Preparation: Use 50ng of gDNA with the Illumina DNA Prep kit. Fragment to ~550 bp. Use dual-index adapters to enable multiplexing.
- Sequencing & QC: Sequence on an Illumina NovaSeq to achieve >100x median coverage. Use FastQC to assess read quality. Trim adapters with Trimmomatic.
- Variant Calling: Align reads to the reference genome with BWA-MEM. Use
breseqin "polymorphism" mode with default parameters to call variants present in the heteroresistant or resistant populations but absent in the ancestor. Manually inspect low-frequency variants in IGV.
The Scientist's Toolkit: Research Reagent Solutions
| Item | Function in Heteroresistance Research |
|---|---|
| QX200 Droplet Digital PCR System (Bio-Rad) | Provides absolute quantification of plasmid copy number and low-frequency resistance alleles without a standard curve. |
| RNase-Free DNase Set (Qiagen) | Critical for preparing RNA samples for expression (qPCR) analysis to remove genomic DNA contamination. |
| Nextera XT DNA Library Prep Kit (Illumina) | Enables rapid, multiplexed preparation of whole-genome sequencing libraries from low-input genomic DNA. |
| ZymoBIOMICS Microbial Community Standard | Serves as a positive control and calibrator for both ddPCR and WGS runs to identify technical biases. |
| Phusion High-Fidelity DNA Polymerase (NEB) | Used for high-fidelity amplification of plasmid or genomic regions for validation of WGS-identified mutations. |
Diagrams
Title: Workflow for Linking Copy Number to Fitness Cost
Title: ddPCR Troubleshooting Decision Tree
Technical Support Center: Troubleshooting Guides & FAQs
Frequently Asked Questions (FAQs)
Q1: During growth curve analysis, my resistant subpopulation shows no detectable fitness defect compared to the wild-type, contradicting my hypothesis. What could be wrong? A: This is often a measurement sensitivity issue. Heteroresistant populations may have a very small fitness cost that is masked by the growth dynamics of the dominant susceptible population. Ensure you are using a sufficiently high initial inoculum ratio (e.g., 1:1) of resistant to susceptible cells in your head-to-head competition and measure over a long enough period (≥20 generations). Consider using selective plates with a sub-inhibitory antibiotic concentration to better distinguish subpopulations during plating for CFU counts.
Q2: My Competitive Index (CI) assay results are highly variable between replicates. How can I improve consistency? A: High variability typically stems from inconsistent initial conditions or sampling error.
- Standardize Inoculum: Use cells harvested from the same growth phase (mid-log is recommended) and normalize optical density precisely.
- Increase Biological Replicates: Perform at least 6-8 independent competition experiments.
- Optimize Sampling: Ensure thorough mixing before each sample is taken for plating. Plate technical replicates of serial dilutions to obtain accurate CFU counts.
- Control Environment: Use the same incubator and media batch for all replicates of a given experiment.
Q3: In my animal model, I cannot recover enough bacterial cells from infection sites to calculate a meaningful Competitive Index. What are my options? A: This indicates a potential bottleneck or high immune clearance.
- Increase Inoculum: Use a higher initial co-infection dose while ensuring it remains sub-lethal and models natural infection.
- Alternative Readouts: Implement luciferase or fluorescent reporter tags on strains for in vivo imaging, allowing longitudinal tracking without sacrificing animals at each time point. Use qPCR on tissue homogenates with strain-specific primers to quantify relative abundance.
- Pool Tissues: For small animal models (e.g., mice), homogenize and plate the entire infected organ (e.g., spleen) to maximize recoverable cells.
Q4: How do I distinguish the fitness cost of gene amplification from other compensatory mutations that may arise during the experiment? A: This requires careful experimental design and post-hoc validation.
- Clone Tracking: Isolate multiple single clones from both input and output populations of competition assays. Re-test their antibiotic susceptibility and fitness.
- Whole-Genome Sequencing: Perform WGS on pre- and post-competition isolates from both strains to identify any secondary mutations that may confer a compensatory benefit unrelated to copy number.
- Control Passaging: Include a passaged control (each strain grown alone) to identify mutations that arise simply during growth, not competition.
Troubleshooting Guides
Issue: Growth Curves Show High Noise in the Late Stationary/Death Phase.
| Potential Cause | Diagnostic Step | Solution |
|---|---|---|
| Evaporation in microplate wells | Inspect plate edges for condensation; compare outer vs. inner well OD. | Use a microplate with a sealing lid, add a humidifying chamber in the reader, or ignore data points beyond 24h. |
| Cell Clumping/Aggregation | Check culture under a microscope. | Increase dispersing agent (e.g., Tween 20) concentration in media, sonicate samples briefly before reading, or use filtered media. |
| Reader Temperature Instability | Log ambient temperature during run. | Use a reader with active temperature control and pre-warm the plate to the assay temperature. |
Issue: Competitive Index Calculates as Zero or Infinity.
| Potential Cause | Diagnostic Step | Solution |
|---|---|---|
| One strain completely outcompetes the other | Check input and output CFU on non-selective and selective plates. | Dilute the fitter strain in the initial inoculum (e.g., 1:100 ratio) to prolong the competition. |
| Incorrect selective antibiotic concentration | Plate serial dilutions of each strain alone on the selective plate to confirm 100% kill of the sensitive strain. | Titrate the antibiotic in the selective agar to ensure it fully inhibits the susceptible strain but allows growth of the resistant strain. |
| Overgrown plates affecting CFU count accuracy | Review plating methodology. | Plate multiple dilutions (in triplicate) to ensure counts are in the 30-300 CFU range. |
Issue: Animal Model Co-infection Shows Skewed Recovery Not Reflecting In Vitro Fitness.
| Potential Cause | Diagnostic Step | Solution |
|---|---|---|
| Strain-specific differences in tissue tropism | Compare bacterial loads of each strain alone in different organs. | Calculate CI separately for each organ/tissue site. Focus analysis on the primary infection site. |
| Differential immune clearance | Perform flow cytometry or cytokine analysis on infected tissue. | Use immunocompromised animal models for initial fitness cost studies to reduce immune confounding variables. |
| Bottleneck effect during infection | Vary the infection route (e.g., IV vs. IP vs. inhalation). | Choose an infection route that delivers bacteria directly to the target site with minimal stochastic bottleneck. |
Table 1: Typical Competitive Index Ranges and Interpretations
| CI Value Range | Fitness Interpretation | Implication for Gene Copy Number Cost |
|---|---|---|
| >1.2 | Resistant strain is more fit | No detectable cost; possible compensatory evolution. |
| 0.8 - 1.2 | Neutral fitness | Fitness cost is negligible or balanced. |
| 0.5 - 0.8 | Mild fitness defect | Measurable but potentially tolerable cost for amplification. |
| 0.2 - 0.5 | Significant fitness defect | High cost likely to limit amplification in absence of antibiotic. |
| <0.2 | Severe fitness defect | Amplification is highly detrimental; requires strong selective pressure. |
Table 2: Key Parameters for Growth Curve Analysis in Fitness Studies
| Parameter | Recommended Value/Method | Purpose in Fitness Cost Analysis |
|---|---|---|
| Culture Volume | ≥150 µL in 96-well plate | Prevents evaporation bias. |
| Growth Temperature | 37°C (or host-specific) | Standardizes metabolic rate. |
| Measurement Interval | Every 15-30 minutes | Captures precise growth kinetics. |
| Key Metric Derived | Maximum Growth Rate (µ_max) | Most sensitive indicator of physiological fitness. |
| Analysis Software | Growthcurver (R), PRECOG | Automates lag time, µ_max, and carrying capacity calculation. |
Experimental Protocols
Protocol 1: Head-to-Head Growth Competition for CI Calculation
Objective: To quantitatively compare the in vitro fitness of an antibiotic-resistant (gene-amplified) strain against an isogenic susceptible strain.
- Strain Preparation: Grow overnight cultures of resistant (R) and susceptible (S) strains in appropriate media.
- Normalization: Dilute cultures to the same optical density (OD600 ~0.1) in fresh, pre-warmed media.
- Co-culture Inoculation: Mix R and S strains at a 1:1 ratio in a fresh flask containing pre-warmed media. Use a starting total OD600 of ~0.001.
- Growth Competition: Incubate at 37°C with shaking. Do not allow culture to enter stationary phase for >4 hours. Periodically dilute into fresh media to maintain logarithmic growth for ~20 generations.
- Sampling and Plating:
- T0 Sample: Immediately after mixing, perform serial dilution and plate on:
- Non-selective agar: To determine total CFU/mL (R+S).
- Antibiotic-containing agar: To determine CFU/mL of the resistant strain (R).
- Tfinal Sample: After ~20 generations, repeat the plating procedure.
- T0 Sample: Immediately after mixing, perform serial dilution and plate on:
- Calculation:
- Competitive Index (CI) = (Rfinal/Sfinal) / (Rinitial/Sinitial)
- S counts are derived by subtracting R counts from total counts on non-selective plates.
Protocol 2:In VivoCompetitive Index Assay in a Murine Thigh Infection Model
Objective: To assess the fitness cost of gene amplification in a live host environment.
- Animal Preparation: Use specific pathogen-free, female mice (e.g., 6-8 week old BALB/c). Render mice neutropenic via cyclophosphamide injections (150 mg/kg and 100 mg/kg at 4 days and 1 day pre-infection).
- Bacterial Inoculum: Prepare a 1:1 mixed suspension of R and S strains in saline, targeting a total inoculum of ~10⁶ CFU per mouse (50 µL volume).
- Infection: Anesthetize mice and inject the 50 µL inoculum into the posterior thigh muscle.
- Harvesting: At a predetermined time point (e.g., 24h post-infection), euthanize mice, aseptically remove the infected thighs, and homogenize each thigh in 1 mL of saline.
- Plating and Calculation: Perform serial dilutions of homogenate and plate on non-selective and antibiotic-selective agar as in Protocol 1. Calculate the in vivo CI for each mouse.
Visualizations
Title: Workflow for Tracking Fitness Costs in Heteroresistance
Title: Competitive Index Assay Workflow and Calculation
The Scientist's Toolkit: Research Reagent Solutions
Table 3: Essential Materials for Fitness Cost Experiments
| Item | Function/Description | Example Product/Catalog |
|---|---|---|
| Isogenic Strain Pair | Resistant (gene-amplified) and susceptible strains differing only at the locus of interest. Essential for clean fitness comparisons. | Constructed via allelic exchange or phage transduction. |
| Automated Microbiology Growth Curver | High-throughput, precise measurement of OD over time in multiple cultures. | Bioscreen C, Growth Profiler, or plate reader with shaking/incubation. |
| Selective Agar Media | Contains specific antibiotic at a concentration that fully inhibits the susceptible strain but allows growth of the resistant strain. | Mueller-Hinton Agar with titrated antibiotic (e.g., 2x MIC for S strain). |
| Cell Homogenizer | For lysing animal tissues to recover bacterial cells for plating in in vivo CI assays. | Bertin Preecllys 24 or similar bead-beating homogenizer. |
| Reporter Tags | Fluorescent (GFP/mCherry) or luminescent (lux) tags for in vivo imaging and strain differentiation without plating. | Chromosomal-integration plasmids (e.g., pUC18-mini-Tn7 series). |
| Strain-Specific Primers | For qPCR quantification of strain ratios directly from tissue homogenate or competition culture. | Designed against unique genetic variants (SNP, amplification marker). |
| Neutropenic Animal Model | Immunocompromised hosts (e.g., cyclophosphamide-treated mice) to reduce immune-mediated clearance variables. | BALB/c or CD-1 mice with cyclophosphamide regimen. |
Technical Support Center: Troubleshooting Guides & FAQs
Frequently Asked Questions (FAQs)
Q1: In our Population Analysis Profiling (PAP) assay, we see no sub-population growth at high antibiotic concentrations, even with a known heteroresistant strain. What could be wrong? A: This is often due to an incorrect inoculum or antibiotic preparation.
- Check Inoculum Density: Ensure the initial cell suspension is precisely adjusted to ~1.5 x 10^8 CFU/mL. Using a densitometer? Calibrate it with a McFarland standard. Using optical density (OD600)? Validate the OD600-to-CFU/mL correlation for your specific organism and growth medium.
- Verify Antibiotic Stock: Prepare fresh antibiotic stock solutions from powder, if possible. Check the concentration and purity of the stock. Ensure serial dilutions in the correct medium (e.g., cation-adjusted Mueller-Hinton Broth) are performed accurately.
- Confirm Agar Incorporation: The antibiotic must be uniformly mixed with the molten agar (cooled to 48-50°C) before pouring plates. Inadequate mixing leads to gradient effects.
Q2: Our time-kill curve results show high variability between replicates. How can we improve reproducibility? A: Key factors are culture synchronization and precise sampling.
- Standardize Pre-culture: Start all replicates from the same frozen stock, grown under identical conditions (medium, temperature, time). Use mid-log phase cultures (e.g., OD600 ~0.5).
- Control Sampling Time Points: Sample at exact time intervals (e.g., 0, 1, 2, 4, 6, 24h). Use a dedicated, calibrated pipette for each time point to avoid cross-contamination.
- Optimize Dilution Series: For accurate colony counts, ensure a thorough vortex of the culture before sampling. Perform serial dilutions in sterile saline or broth. Plate appropriate dilutions in technical duplicate. Colonies should be between 20-200 for countable plates.
Q3: How do we correlate a resistant sub-population from PAP with a specific genomic change when the sub-population is low frequency (<0.1%)? A: This is a central challenge in heteroresistance research. A combined phenotypic-genomic enrichment strategy is required.
- Phenotypic Enrichment: Pick colonies from the highest antibiotic concentration plate in the PAP assay. Pool and grow them in liquid medium without antibiotic to amplify the biomass.
- Genomic DNA Extraction: Extract high-quality genomic DNA from both the enriched resistant pool and the original susceptible parent population.
- Sequencing & Analysis: Perform whole-genome sequencing on both samples. Use comparative genomics pipelines (e.g., Breseq, Snippy) to identify single nucleotide polymorphisms (SNPs), insertions/deletions (indels), and copy number variations (CNVs) unique to or highly enriched in the resistant pool. Target genes often include efflux pumps, drug-modifying enzymes, or ribosomal targets.
Q4: When performing fitness cost assays, the growth curves of resistant isolates are too noisy to detect a significant cost. What parameters should we adjust? A: Increase biological replicates and use a controlled growth environment.
- Increase Replication: Perform a minimum of 6 biological replicates (independent colonies) per strain.
- Use a Plate Reader: Perform the growth assay in a microplate reader with temperature control and continuous, low-amplitude shaking. This provides high-density, consistent data.
- Normalize Data: Normalize the growth curve data to the initial OD. Use the area under the curve (AUC) or maximum growth rate (µmax) derived from the exponential phase for robust statistical comparison between the resistant mutant and the isogenic parent strain.
Experimental Protocols
Protocol 1: Standardized Population Analysis Profiling (PAP) Purpose: To detect and quantify heteroresistant sub-populations within a bacterial isolate. Method:
- Prepare Antibiotic Plates: Prepare two-fold serial dilutions of the antibiotic in sterile water. Mix 1 mL of each dilution with 19 mL of molten Mueller-Hinton Agar (cooled to 48-50°C) to create a range of plates (e.g., 0.5x to 32x MIC). Include a drug-free control plate.
- Prepare Inoculum: Grow the test strain to mid-log phase. Adjust turbidity to 0.5 McFarland standard (~1.5 x 10^8 CFU/mL) in saline.
- Spotting: Perform a 10-fold serial dilution of the adjusted suspension down to 10^-6. Using a calibrated micropipette, spot 10 µL drops of each dilution onto the antibiotic-containing and control agar plates.
- Incubation & Analysis: Let spots dry, invert, and incubate at 35°C ± 2°C for 18-24 hours. Count colonies from the spot yielding 20-200 colonies. Calculate the CFU/mL on each antibiotic concentration. Plot log10(CFU/mL) versus antibiotic concentration.
Protocol 2: Time-Kill Curve Assay Purpose: To evaluate the rate and extent of bactericidal activity of an antibiotic over time. Method:
- Inoculum Preparation: Prepare a bacterial suspension of ~5 x 10^5 CFU/mL in pre-warmed broth in a flask.
- Antibiotic Addition: Add antibiotic to achieve desired multiples of the MIC (e.g., 1x, 4x, 10x MIC). Maintain a growth control (no antibiotic) and a sterility control (broth only).
- Incubation & Sampling: Incubate at 35°C with shaking. At predetermined time points (0, 2, 4, 6, 24 hours), remove a 100 µL sample.
- Viable Count: Serially dilute each sample in sterile saline and plate 100 µL onto drug-free agar plates in duplicate. Incubate plates for 18-24 hours and count colonies. Plot log10(CFU/mL) versus time.
Data Presentation
Table 1: Example PAP Results for E. coli Isolate A123 Against Meropenem
| Meropenem Conc. (µg/mL) | CFU/mL on Drug Plate | Log10(CFU/mL) | % of Inoculum Surviving |
|---|---|---|---|
| 0 (Control) | 1.5 x 10^8 | 8.18 | 100.00% |
| 0.5 | 3.2 x 10^7 | 7.51 | 21.33% |
| 1.0 | 5.0 x 10^6 | 6.70 | 3.33% |
| 2.0 | 1.1 x 10^5 | 5.04 | 0.07% |
| 4.0 | 2.0 x 10^3 | 3.30 | 0.0013% |
| 8.0 | 1.5 x 10^2 | 2.18 | 0.0001% |
Table 2: Comparative Fitness Costs of Resistant Mutants
| Strain (Genotype) | Mean Generation Time (minutes) | Mean AUC (0-24h) | p-value (vs. WT) |
|---|---|---|---|
| WT (Parental) | 28.5 ± 1.2 | 15.8 ± 0.5 | - |
| Mutant 1 (gyrA S83L) | 29.1 ± 1.5 | 15.5 ± 0.7 | >0.05 (NS) |
| Mutant 2 (ompF knockout) | 35.4 ± 2.3 | 12.1 ± 0.9 | <0.01 |
| Mutant 3 (ampC amplification) | 32.8 ± 1.8 | 14.2 ± 0.6 | <0.05 |
Data presented as mean ± standard deviation (n=6). AUC: Area Under the growth Curve. NS: Not Significant.
The Scientist's Toolkit: Key Research Reagent Solutions
| Item | Function & Rationale |
|---|---|
| Cation-Adjusted Mueller Hinton Broth (CAMHB) | Standardized medium for antimicrobial susceptibility testing, ensuring consistent cation levels (Ca2+, Mg2+) that affect aminoglycoside and polymyxin activity. |
| Mueller Hinton Agar (MHA) | The standard solid medium for PAP and plating in time-kill assays, providing low levels of inhibitors and thymidine. |
| Precision Densitometer (e.g., McFarland Standard) | Essential for accurate and reproducible adjustment of bacterial inoculum density for both PAP and time-kill assays. |
| 96-Well Microplates (Sterile, Tissue-Culture Treated) | For high-throughput fitness cost assays and MIC determinations in plate readers. |
| Automated Plate Reader with Shaking | Enables continuous, high-resolution monitoring of growth kinetics for fitness cost assessments with multiple replicates. |
| High-Fidelity DNA Polymerase & WGS Library Prep Kit | For accurate amplification of genomic regions and preparation of sequencing libraries to identify mutations and gene amplifications. |
| Bioinformatics Pipeline (e.g., Breseq, CLC Genomics) | Software tools specifically designed for identifying mutations from microbial genome sequencing data, crucial for genotype-phenotype correlation. |
Visualizations
Technical Support Center
FAQs & Troubleshooting Guides
Q1: My in silico model predicts rapid loss of the amplified unit, but my in vivo data shows stability over many generations. What could cause this discrepancy?
A: This often stems from inaccurate fitness cost parameterization.
- Troubleshooting Steps:
- Re-evaluate Fitness Function: Ensure your fitness cost model incorporates non-linear effects. A simple linear burden may underestimate stability. Implement a decelerating cost function (e.g., logarithmic burden).
- Check for Compensatory Mutations: Your model may lack a module for simulating suppressor mutations elsewhere in the genome that alleviate the cost. Implement a random mutation search space in other genes.
- Validate Growth Rate Assumptions: Cross-check the basal growth rate and plasmid copy number (PCN) inheritance variance used in your simulation against freshly measured experimental data.
- Protocol: Measuring In Vivo Plasmid Stability & Cost.
- Co-culture plasmid-bearing and plasmid-free cells in serial batch cultures for ~50-100 generations in non-selective media.
- Plate samples daily on selective and non-selective agar to determine the proportion of plasmid-carrying cells.
- Fit the data to the
s = (1/μ) * ln([P+]_t/[P+]_0)model, wheresis the selection coefficient,μis the growth rate, and[P+]is plasmid-bearing population size.
Q2: The evolutionary trajectory simulation becomes computationally intractable when I scale beyond 5 genes and 1000 cell lineages. How can I optimize this?
A: This is a common scalability issue.
- Troubleshooting Steps:
- Switch Algorithms: Move from an agent-based modeling (ABM) framework to a Wright-Fisher or Moran process model if tracking every cell is not essential. Use population genetics approximations.
- Implement a "Binning" Strategy: Instead of tracking unique multi-locus genotypes, bin genotypes with similar fitness and amplification states.
- Leverage GPU Computing: Refactor your code to use GPU-accelerated libraries (e.g., CUDA for C++, JAX for Python) for parallel fitness calculations.
- Protocol: Setting Up a Wright-Fisher Simulation for Gene Amplification.
- Initialize a population of N haploid individuals, each with a defined gene copy number vector.
- For each generation:
- Calculate fitness
w_ifor each individualibased on its copy number vector and a cost function. - Sample N individuals with replacement from the current population with probability proportional to
w_i. - Apply mutation: for each selected individual, randomly increase/decrease copy number per locus with a defined probability.
- Calculate fitness
Q3: How do I parameterize the probability of gene amplification and deamplification events per cell division in my model?
A: These rates are critical and organism-specific.
- Troubleshooting Steps:
- Use FLP/FRT or Cre/lox Systems: Engineer direct repeats flanking your target locus to measure amplification rates via recombination.
- Analyze Fluctuation Tests: Perform Luria-Delbrück fluctuation assays under very weak selection. Use the Ma-Sandri-Sarkar (MSS) maximum likelihood method to estimate the amplification rate from the distribution of resistant colonies.
- Leverage Long-Read Sequencing Data: If available, use PacBio or Nanopore data from evolved populations to identify amplicon structures and infer rearrangement rates.
- Protocol: Fluctuation Test for Amplification Rate Estimation.
- Inoculate many (~50-100) independent, small cultures from a low-copy-number ancestor.
- Grow to saturation.
- Plate each entire culture on agar containing a sub-inhibitory antibiotic concentration that favors amplifications.
- Count resistant colonies from each culture. Use the
rvalue (median number of amplification events) and the final cell countN_tin the formula: Rate =r / N_t. Thervalue is derived from the MSS algorithm applied to the colony count distribution.
Research Reagent Solutions Toolkit
| Reagent / Material | Function in Heteroresistance & Amplification Studies |
|---|---|
| Sub-MIC Antibiotic Plates | Selective pressure to enrich for and maintain low-level amplified units without killing the population. |
| Fluorescent Protein Reporters | Fused to genes of interest to quantify copy number variation per cell via flow cytometry. |
| lacZα Complementation Plasmids | Reporters for gene amplification via increased blue colony intensity on X-gal plates. |
| CRISPR-nuclease dead (dCas9) Fusions | To visually localize amplified genetic loci (e.g., dCas9-GFP) or track their replication timing. |
| Unstable, High-Copy Plasmid Vectors | Model systems for studying the pure fitness cost of genetic load, independent of specific gene function. |
| Next-Gen Sequencing Kits (Illumina) | For whole-genome sequencing of evolved populations to identify common amplicon breakpoints. |
| Long-Read Sequencing Kits (PacBio/Nanore) | To resolve the complex repetitive structure of amplified genomic regions. |
| Microfluidic Chemostat Devices | To observe single-cell dynamics of amplification and loss in precisely controlled environments. |
Table 1: Experimentally Derived Parameters for In Silico Modeling
| Parameter | Typical Range (E. coli) | Measurement Method | Impact on Model |
|---|---|---|---|
| Amplification Rate | 10⁻⁵ – 10⁻³ per cell division | Fluctuation Test | Drives initial emergence of variants. |
| Deamplification/Loss Rate | 10⁻² – 10⁻¹ per cell division | Plasmid stability assay | Determines unit stability in absence of selection. |
| Fitness Cost per Copy (Linear) | 0.01 – 0.1 per copy | Competition assay | Simplest burden model; often insufficient. |
| Fitness Cost (Saturating) | Varies | Growth curve analysis in chemostat | More accurately models diminishing returns of cost. |
| Selection Coefficient (s) under Sub-MIC | 0.05 – 0.5 | Frequency tracking over time | Defines strength of selective advantage. |
Table 2: Comparison of In Silico Modeling Approaches
| Model Type | Computational Cost | Key Strengths | Key Limitations | Best For |
|---|---|---|---|---|
| Deterministic ODE | Low | Fast; analytic solutions possible. | No stochasticity; poor for rare events. | Large population, mean-field dynamics. |
| Stochastic (Gillespie) | Medium | Captures noise and event timing. | Slower for large populations/genomes. | Small populations, precise event modeling. |
| Agent-Based (ABM) | Very High | Captures individual cell history & heterogeneity. | Computationally intensive; complex code. | Multicellular interactions, spatial structure. |
| Wright-Fisher | Medium-High | Efficient population genetics framework. | Discrete generations; no age structure. | Tracking allele frequencies in large populations. |
Visualizations
Diagram 1: Workflow for Parameterizing an Amplification Model
Diagram 2: Balancing Copy Number and Fitness in Heteroresistance
Technical Support Center: Troubleshooting Heteroresistance Fitness-Cost Experiments
FAQs & Troubleshooting Guides
Q1: In our fluctuation assay, the calculated mutation rate for resistance appears highly variable between biological replicates. What could be the cause and how can we improve consistency?
A: High variability often stems from pre-existing low-frequency resistant mutants in the inoculum culture. This violates the assumption that all cultures started from purely susceptible cells.
- Troubleshooting Protocol:
- Source Culture Preparation: Streak the parental strain from a -80°C stock onto non-selective agar. Pick a single, isolated colony to inoculate the pre-culture.
- Neutral Marking: Use a genetically marked, isogenic susceptible control strain in parallel. Compare the variance in resistance frequency between the test and control strains. Significantly higher variance in the test strain indicates pre-existing variation.
- Data Analysis: Apply the Ma-Sandri-Sarkar (MSS) maximum likelihood estimator for mutation rate calculation, as it is more robust to jackpot events than the p0 method.
Q2: When measuring the fitness cost of a resistance gene via competitive co-culture, the calculated selection coefficient (s) changes sign (from negative to positive) over prolonged passaging. How should this be interpreted?
A: This indicates compensatory evolution, where secondary mutations arise that offset the initial fitness cost of resistance, a critical factor in the resistance-cost balance.
- Troubleshooting Protocol:
- Freeze Samples: At each passage, archive a glycerol stock of the competed culture.
- Clonal Isolation: After detecting a shift in s, streak the relevant passage stock for single colonies.
- Reconstruction Experiment: Isolate the resistance gene (via PCR/sequencing) from several clones and reintroduce it into a naive, susceptible parental background via allelic exchange.
- Re-measure Fitness: Perform a new competition assay with these reconstructed strains. If the cost is absent, it confirms that compensatory mutations elsewhere in the genome, not on the resistance allele itself, are responsible.
Q3: Our PCR and qPCR assays for verifying gene copy number variation (CNV) in heteroresistant populations give inconsistent results. What are the critical controls?
A: Inconsistency is common due to the mixed ploidy in heteroresistant populations. Precise normalization is key.
- Troubleshooting Protocol:
- Genomic DNA Isolation: Use a method optimized for fungal/bacterial cells (e.g., enzymatic lysis followed by column purification) to ensure high-molecular-weight, pure DNA. Check A260/A280 (~1.8) and A260/A230 (>2.0).
- Reference Genes: Use two single-copy reference genes located on different chromosomes from the amplicon of interest. This controls for both DNA quantity and potential aneuploidy.
- Standard Curve: For qPCR, include a standard curve from a strain with a known, single copy of the target gene for absolute quantification. Include a no-template control (NTC) and a gDNA sample from a strain where the gene is deleted (if available).
- Data Analysis: Use the ΔΔCq method, but for absolute copy number, use the formula: Copy Number = 10^((Cqsample - Intercept)/Slope). Normalize to the geometric mean of the reference gene Cqs.
Q4: How do we definitively prove that a specific fitness cost is directly linked to the increased copy number of a resistance gene, and not just to the presence of the gene or off-target drug effects?
A: A multi-approach validation is required.
- Experimental Protocol: Comparative Fitness Assay:
- Strain Panel Construction: Create an isogenic panel in the same genetic background: a) Susceptible (wild-type), b) Resistant with a single-copy resistance allele (e.g., integrated at a neutral site), c) Resistant with a multi-copy plasmid bearing the resistance gene, d) Resistant with a multi-copy, promoter-controlled overexpresser of the gene.
- Growth Conditions: Perform head-to-head pairwise competition assays (1:1 mixture) in both drug-free medium and sub-MIC drug conditions. Use differential fluorescent labeling or antibiotic markers for strain discrimination.
- Quantification: Sample over 5-10 generations. Calculate the selection coefficient, s, per generation: s = ln[(Rt/St) / (R0/S0)] / t, where R and S are counts of resistant and susceptible competitors, and t is time in generations.
- Interpretation: A dose-dependent negative s in drug-free medium correlating with copy number (strains c & d showing greater cost than b) provides strong evidence.
Quantitative Data Summary
Table 1: Example Fitness Costs of Common Resistance Mechanisms
| Resistance Mechanism | Gene/Pathway | Copy Number/Amplification | Selection Coefficient (s) in Drug-Free Medium* | Compensatory Evolution Potential |
|---|---|---|---|---|
| Azole Resistance (Fungi) | ERG11/CYP51 | 2-5x (Tandem Repeat) | -0.05 to -0.15 | High (Mutations in ERG3, Hsp90) |
| β-lactam Resistance (Bacteria) | blaCTX-M | High (Plasmid-borne) | -0.10 to -0.30 | Moderate (Plasmid loss, cost reduction) |
| Antifolate Resistance | dhfr | Up to 100x (Amplified Circle) | -0.01 to -0.05 per copy | Low (Amplification reversible) |
| Vancomycin Resistance (VRE) | vanA Operon | 1x (Plasmid/Chromosome) | -0.20 to -0.40 | High (Frequent in rpoB) |
*Negative s denotes a fitness disadvantage. Values are illustrative ranges from published studies.
Table 2: Key Methodologies for Resistance-Cost Quantification
| Method | Key Readout | Advantage | Disadvantage | Best for Measuring: |
|---|---|---|---|---|
| Competitive Fitness Assay | Selection coefficient (s) per generation | Gold standard, high precision, dynamic | Time-consuming, requires markers | Small cost differences (<1%). |
| Growth Curve Analysis | Doubling time, AUC (Area Under Curve) | High-throughput, simple | Less sensitive, measures population-level effect | Large costs, initial screening. |
| Fluctuation Assay | Mutation rate to resistance | Captures de novo emergence | Labor-intensive, statistical complexity | Pre-existing vs. emergent resistance. |
| SCDER (Single-Cell) | Division time, lineage tracing | Heterogeneity, founder effects | Specialized equipment, analysis | Subpopulation dynamics in heteroresistance. |
The Scientist's Toolkit: Research Reagent Solutions
Table 3: Essential Materials for Fitness-Cost Experiments
| Item | Function & Rationale |
|---|---|
| Isogenic Strain Panel | Genetically identical except for the resistance allele/locus. Essential for attributing fitness effects solely to the gene of interest, excluding background variation. |
| Fluorescent Protein Markers (e.g., GFP, mCherry) | For differential labeling of strains in competitive co-culture. Allows accurate, rapid quantification via flow cytometry or fluorescence plating without antibiotic selection bias. |
| Morpholinepropanesulfonic Acid (MOPS) Buffered Medium | Chemically defined growth medium. Prevents pH drift during prolonged growth, ensuring consistent fitness measurements across passages. |
| ddPCR (Droplet Digital PCR) Master Mix | For absolute quantification of gene copy number variation (CNV). Superior to qPCR for precise, discrete copy number measurement in mixed populations without a standard curve. |
| Tetrad Dissection Microscope (Yeast) | For isolating spores after meiosis. Critical for constructing clean genetic backgrounds and separating resistance alleles from compensatory mutations in fungal studies. |
| Neutral Chromosomal Integration Site Vectors | For inserting single copies of resistance genes at a defined genomic locus. Provides the baseline (1x copy) control for multi-copy fitness cost comparisons. |
Experimental Visualization
Diagram 1: Experimental Workflow & Core Concept (90 chars)
Diagram 2: Resistance Gene Amplification & Cost Pathway (99 chars)
Navigating Experimental Pitfalls: Overcoming Challenges in Heteroresistance Research and Assay Design
Troubleshooting Guides & FAQs
Q1: Our population analysis profiles (PAPs) show a biphasic killing curve, but whole-genome sequencing of isolates from the less-susceptible subpopulation reveals no known resistance mutations. Are we observing heteroresistance? A1: Not necessarily. This is a classic sign of pseudo-heteroresistance, often caused by experimental artifacts.
- Primary Cause: Inconsistent/inadequate drug pharmacokinetics during in vitro testing. Drug degradation or binding to plastic can create concentration gradients, allowing a subset of cells to survive without genetic resistance.
- Troubleshooting Steps:
- Validate Drug Stability: Use HPLC or a bioassay to confirm the active drug concentration at the end of the assay period.
- Use Appropriate Controls: Include a well-characterized, homogeneously resistant strain. If its PAP also appears biphasic, the issue is likely methodological.
- Modify Protocol: Use pharmacodynamic simulators (e.g., hollow-fiber models) or more frequent drug replenishment to maintain stable pressure.
Q2: How can we differentiate between a true heteroresistant population and a simple mixed infection of susceptible and fully resistant strains? A2: Mixed infections involve distinct, stable genotypes, while heteroresistance involves a dynamic, often unstable subpopulation.
- Diagnostic Experiment: Single-Cell Lineage Tracking.
- Isolate single colonies from the less-susceptible subpopulation after drug pressure.
- Propagate them for 10-15 generations in the absence of drug.
- Re-test the drug susceptibility of these progeny populations.
- Interpretation:
- Mixed Infection: Progeny remain stably resistant (fixed genotype).
- True Heteroresistance: Progeny revert to a susceptible phenotype, indicating an unstable resistance mechanism (e.g., tandem amplifications, plasmid loss).
- Protocol Note: Use non-selective media for propagation and confirm phenotype with MIC assays and population analysis.
Q3: When quantifying amplifications via qPCR or sequencing, how do we set a threshold to define "amplification" versus normal gene copy number variation? A3: This requires careful baseline establishment and statistical analysis.
- Solution: Establish a Copy Number Variation (CNV) Threshold from an unselected, clonal population.
- Perform qPCR (using a single-copy reference gene) or analyze read-depth from sequencing data for 20-30 clonal isolates from a drug-naïve culture.
- Calculate the mean and standard deviation (SD) of the copy number for your gene of interest.
- Set the threshold for amplification at mean + 3×SD. A subpopulation exceeding this threshold under selection suggests gene amplification-driven heteroresistance.
Q4: How do we balance the need for deep sequencing to detect minor subpopulations with practical cost constraints? A4: Implement a tiered sequencing strategy.
| Sequencing Tier | Depth | Purpose | Identifies |
|---|---|---|---|
| Tier 1: Screening | 100-200x | Initial population structure | Major variants (>5-10% frequency) |
| Tier 2: Targeted Deep Seq | 5,000-10,000x | Focus on candidate resistance loci from Tier 1 | Low-frequency amplifications/mutations (0.1-1%) |
| Tier 3: Single-Cell Seq | N/A | Confirm instability & linkage | Direct observation of unstable elements in individual cells |
Q5: What are the key controls to include in every heteroresistance experiment to guard against artifacts? A5:
- Drug Degradation Control: Verify active concentration at assay endpoint.
- Clonality Control: Start experiments from a single, sequenced colony.
- Stability Control: Passage resistant isolates without drug to check for reversion.
- Mixed Culture Control: Artificially mix known resistant and susceptible strains at varying ratios to compare PAP patterns.
Table 1: Distinguishing Features of Heteroresistance Phenotypes
| Feature | True Heteroresistance | Pseudo-heteroresistance | Mixed Infection |
|---|---|---|---|
| Genetic Basis | Unstable amplification, transient plasmid, epigenetic | No genetic change | Stable mutation or acquired resistance gene |
| Phenotype after Drug-Free Passage | Reverts to susceptible | Not applicable (no genetic change) | Remains resistant |
| PAP Profile | Biphasic, "tail" | Biphasic, but variable | Biphasic, distinct subpopulations |
| Detection by Deep Sequencing | Requires high depth for unstable elements | No variant linked to phenotype | Clear, stable variant at lower depth |
| Key Confounding Factors | Fitness cost of mechanism, reversion rate | Drug stability, inoculum size, assay conditions | Initial population purity |
Table 2: Common Methodological Pitfalls & Solutions
| Artifact Source | Consequence | Solution |
|---|---|---|
| Inoculum Size Too High | Carries over pre-existing resistant mutants, mimics mixed infection. | Standardize to ≤1e7 CFU; use clonal starting material. |
| Drug Instability | Creates concentration gradient, mimics heteroresistance tail. | Use stable analogs, confirm concentration, frequent replenishment. |
| Inadequate Passaging | Misclassifies stable resistance as heteroresistance. | Perform ≥10 generations drug-free before re-testing phenotype. |
| Low Sequencing Depth | Fails to detect low-frequency amplified subpopulation. | Use targeted deep sequencing (≥5000x) on candidate regions. |
Detailed Experimental Protocols
Protocol 1: Population Analysis Profile (PAP) with Stability Assay
Purpose: To generate a killing curve and test the stability of the less-susceptible phenotype.
- Starting Culture: Begin with a single, sequence-verified colony. Grow to mid-log phase.
- Drug Exposure: Prepare a 2-fold dilution series of the antimicrobial in agar or broth. Plate a standardized inoculum (~1e7 CFU) across the series.
- Incubation & Enumeration: Incubate and count CFUs at each concentration. Plot log(CFU/mL) vs. drug concentration to generate the PAP.
- Isolation: Pick 5-10 colonies from the "tail" (growth at ≥2x MIC of main population). Also pick colonies from the drug-free control.
- Drug-Free Passage: Inoculate each isolate into non-selective liquid medium. Grow for ~10-15 generations (typically 1:1000 dilution daily for 3 days).
- Re-testing: Perform MIC assays or spot PAPs on the progeny populations. Compare to the original phenotype.
Protocol 2: Targeted Deep Sequencing for Amplification Detection
Purpose: To quantify gene copy number variation in a bacterial population under drug selection.
- DNA Extraction: Extract genomic DNA from the pre-selection population and from the less-susceptible subpopulation after selection.
- PCR Amplification & Barcoding: Design primers for the candidate resistance gene locus and a stable single-copy reference gene. Amplify with barcoded primers for multiplexing.
- Library Preparation & Sequencing: Use a high-fidelity polymerase. Pool libraries and sequence on a platform capable of high depth (e.g., Illumina MiSeq).
- Data Analysis:
- Map reads to a reference genome.
- Calculate normalized read depth (e.g., reads per kilobase per million mapped reads - RPKM) for the target and reference genes in each sample.
- Determine copy number ratio: (RPKMtarget / RPKMreference) in test sample divided by the same ratio in the pre-selection control.
- A ratio > (Mean + 3SD) of control populations indicates amplification.
The Scientist's Toolkit: Research Reagent Solutions
| Item | Function in Heteroresistance Research |
|---|---|
| Hollow-Fiber Infection Model | In vitro system that mimics human pharmacokinetics, eliminating drug decay artifacts common in static assays. |
| ddPCR (Droplet Digital PCR) | Provides absolute quantification of gene copy number without a standard curve, ideal for detecting low-frequency amplifications. |
| CRISPRi/dCas9 Knockdown System | To titrate gene expression and study the fitness cost of resistance gene amplification without genetic disruption. |
| Fluorescent Reporter Plasmids | Tagged with unstable origins of replication to visually track the gain/loss of genetic elements in single cells over time. |
| Next-Gen Sequencing Standards | Defined genomic DNA mixtures with known variant frequencies (e.g., 1%, 0.1%) to validate sequencing depth and variant calling pipelines. |
| Pharmacodynamic Simulation Software | (e.g., ADAPT, Winnonlin) To design in vitro dosing regimens that mimic in vivo conditions, reducing pseudo-heteroresistance. |
Diagrams
Diagram 1: Experimental Workflow for Heteroresistance Confirmation
Diagram 2: Gene Amplification Fitness Cost Dynamics
Technical Support Center: Troubleshooting Heteroresistance Detection
FAQs & Troubleshooting Guides
Q1: Our population analysis profiling (PAP) results show a "tail" of growth at higher antibiotic concentrations, but we are unsure how to define the heteroresistant subpopulation cut-off. What is the current consensus? A: There is no universal consensus, leading to interpretation variability. The current recommended approach is to use a fold-change cut-off relative to the main population's MIC. For example, a subpopulation growing at ≥8x the MIC of the main population is often cited. However, you must validate this against a genotypic method (e.g., PCR for gene copy number) and report both the absolute antibiotic concentration and the fold-change. Common issues arise from inconsistent inoculum size or incubation time. Standardize your protocol using the EUCAST recommended media and inoculum of 1 x 10^7 CFU/mL.
Q2: When using PCR to assess blaKPC gene copy number variance in Klebsiella pneumoniae, our qPCR efficiency is low, affecting copy number estimates. How can we troubleshoot this? A: Low qPCR efficiency typically stems from poor primer design, inhibitor carryover, or suboptimal reaction conditions. Follow this protocol:
- Primer Validation: Redesign primers to amplicons 80-150 bp. Run a standard curve with a 10-fold serial dilution of known genomic DNA (5-log range). Efficiency should be 90-110% (R² > 0.99).
- Inhibitor Removal: Use a column-based DNA purification kit specifically for bacterial cells.
- Normalization: Always normalize the blaKPC Cq value to a single-copy housekeeping gene (e.g., gyrA). The ΔΔCq method is then used to estimate relative copy number variation across isolates.
Q3: Our next-generation sequencing (NGS) data for heteroresistance shows low-frequency variants, but we cannot distinguish true low-copy plasmid amplification from sequencing error. What is the best practice? A: This is a critical detection issue. You must establish a validated variant frequency threshold. Current literature suggests a minimum of 5x read depth coverage and a variant frequency threshold of 1-5% for identifying potential heteroresistant alleles. Always confirm findings with an orthogonal method:
- Wet-lab Validation: Perform parallel PAP or droplet digital PCR (ddPCR) on the same culture.
- Bioinformatic Control: Use a positive control sample (a known mixture of susceptible and resistant isogenic strains) in your sequencing run to establish the error rate of your pipeline.
Q4: In time-kill assays for evaluating fitness cost, our heteroresistant subpopulation is overgrown by the susceptible population in the drug-free medium, making it hard to quantify. How can we track it? A: This directly addresses the balance of copy number and fitness. You must use a selective medium or a marker-based tracking system.
- Protocol: After exposure to antibiotic, plate serial dilutions onto both:
- Drug-free medium: To quantify total population.
- Medium with a sub-inhibitory antibiotic concentration (e.g., 0.5x MIC of the main population): To selectively count the heteroresistant subpopulation.
- Alternative: Use strains engineered with a fluorescent marker (e.g., GFP) in the resistance gene locus to track the subpopulation via flow cytometry over time in competition experiments.
Table 1: Comparison of Common Heteroresistance Detection Methods
| Method | Typical Cut-Off Value/Threshold | Key Advantage | Key Limitation | Approximate Cost per Sample |
|---|---|---|---|---|
| Population Analysis Profiling (PAP) | Growth at ≥8x MIC of main population | Gold standard, phenotypic, quantitative | No consensus on cut-off, labor-intensive | $15 - $30 |
| Droplet Digital PCR (ddPCR) | Variant frequency ≥0.1% | Absolute quantification, high precision | Requires prior knowledge of target, high cost | $50 - $100 |
| Next-Generation Sequencing (NGS) | Read frequency 1-5% (depth >5x) | Unbiased, genome-wide | High cost, complex data analysis, error rate issues | $100 - $500 |
| qPCR for Copy Number | Fold-change ≥2 relative to control | High-throughput, specific | Only for known targets, requires normalization | $10 - $20 |
Table 2: Relationship between Gene Copy Number & Fitness Cost in Model Systems
| Resistance Mechanism (Organism) | Baseline Copy Number | Induced High Copy Number | Fitness Cost (Growth Rate Reduction) | Compensatory Evolution Observed? |
|---|---|---|---|---|
| blaKPC plasmid (K. pneumoniae) | 1 - 3 per cell | 5 - 10 per cell | 15 - 25% | Yes, within 200 generations |
| mecA SCCmec (MRSA) | 1 - 2 per cell | Stable, not amplifiable | 5 - 10% | Yes, in regulatory regions |
| ampC promoter mutants (E. coli) | 1 per cell | 1 per cell (upregulated) | 10 - 30% | Yes, global attenuating mutations |
Experimental Protocols
Protocol 1: Standardized Population Analysis Profiling (PAP) for β-lactams Objective: To quantitatively detect and define the heteroresistant subpopulation.
- Prepare Antibiotic Plates: Create Mueller-Hinton Agar plates with 2-fold serial dilutions of the target antibiotic (e.g., meropenem from 0.125 to 32 mg/L).
- Culture & Inoculum: Grow test isolate to mid-log phase. Adjust to a 0.5 McFarland standard (~1.5 x 10^8 CFU/mL). Perform a 1:10 dilution in saline to achieve ~1.5 x 10^7 CFU/mL.
- Spotting: Using a multipoint inoculator or micropipette, spot 10 µL of the dilution (~1.5 x 10^5 CFU) onto each antibiotic concentration plate and a drug-free control. Perform in triplicate.
- Incubation & Analysis: Incubate at 35°C for 24-48 hours. Count colonies on each plate. Plot log10 CFU/mL versus antibiotic concentration. The heteroresistance cut-off is the concentration where subpopulation growth (≥1 colony) is observed at a defined fold above the MIC of the main population (visible as a "tail").
Protocol 2: ddPCR for blaKPC Gene Copy Number Quantification Objective: To absolutely quantify resistance gene copy number variation within a population.
- DNA Extraction: Use a kit to extract genomic and plasmid DNA. Precisely quantify DNA using a fluorometer.
- Reaction Setup: Prepare a 20 µL ddPCR reaction mix containing: 10 µL of ddPCR Supermix for Probes (No dUTP), 1 µL of blaKPC primer-probe assay (FAM-labeled), 1 µL of reference gene assay (gyrA, HEX-labeled), 50 ng of template DNA, and nuclease-free water.
- Droplet Generation & PCR: Generate droplets using a QX200 Droplet Generator. Transfer emulsified samples to a 96-well PCR plate. Run PCR: 95°C for 10 min, then 40 cycles of 94°C for 30 sec and 60°C for 60 sec, with a final 98°C for 10 min (ramp rate 2°C/sec).
- Analysis: Read plate on a QX200 Droplet Reader. Analyze with QuantaSoft software. The target gene copy number per sample is calculated as: (Concentration of blaKPC (copies/µL) / Concentration of gyrA (copies/µL)) * (Ploidy of gyrA).
Visualizations
Heteroresistance Detection & Analysis Workflow
Gene Copy Number and Fitness Cost Dynamics
The Scientist's Toolkit: Research Reagent Solutions
Table 3: Essential Reagents for Heteroresistance Studies
| Reagent/Material | Function & Rationale | Example Product/Catalog |
|---|---|---|
| Cation-Adjusted Mueller-Hinton Broth (CAMHB) | Standardized medium for antibiotic susceptibility testing, ensures reproducible cation concentrations affecting drug activity. | Becton Dickinson, 212322 |
| QX200 Droplet Digital PCR System | Provides absolute quantification of gene copy number without a standard curve, critical for detecting low-frequency variants. | Bio-Rad, 1864001 |
| Nextera XT DNA Library Prep Kit | Prepares sequencing libraries from low-input genomic DNA for NGS-based detection of heteroresistance alleles. | Illumina, FC-131-1096 |
| PCR Inhibitor Removal Columns | Critical for clean DNA extraction from bacterial cultures, ensuring accurate qPCR/ddPCR Cq values. | Zymo Research, D6030 |
| Specific Primer-Probe Assays | TaqMan assays for target resistance gene (blaKPC, mecA) and single-copy reference gene (gyrA, rpoB). | Integrated DNA Technologies, Custom |
| Automated Colony Picker | Enables high-throughput patching and replica plating from PAP plates for subpopulation isolation. | Singer Instruments, RoToR HDA |
Technical Support Center: Troubleshooting & FAQs
FAQ 1: Why do I observe a rapid loss of the heteroresistant subpopulation after 2-3 rounds of sub-culturing in drug-free medium?
Answer: This is a classic sign of selection bias. The heteroresistant cells often carry a fitness cost due to the amplified gene copy number or expression of resistance mechanisms. In the absence of selective pressure, the more fit, susceptible population outcompetes them. To mitigate this:
- Minimize passages: Sub-culture as infrequently as possible. Allow cultures to reach only mid-log phase before analysis or storage.
- Use large, unbiased inocula: Avoid using very small or non-representative volumes for passaging. Use a standardized, sufficiently large cell count (e.g., >10^6 cells) to maintain population structure.
- Implement periodic selection: Re-introduce the antibiotic at the sub-MIC level every 4-5 passages to maintain the resistant population, but be aware this may alter the fitness dynamics.
FAQ 2: Upon reviving my cryopreserved stock, the population is predominantly susceptible. What went wrong with my storage protocol?
Answer: The cryopreservation or thawing process itself can impose a severe bottleneck, selecting for the hardier (often susceptible) cells. Key troubleshooting steps:
- Check growth phase: Cells must be harvested in mid-log phase, not stationary phase, to ensure maximum viability across all subpopulations.
- Optimize cryoprotectant: Ensure DMSO or glycerol is at the correct concentration (typically 10% v/v) and that cells are mixed gently but thoroughly with it.
- Control freezing rate: Use a controlled-rate freezer or a validated "Mr. Frosty"-type isopropanol bath to achieve a cooling rate of -1°C/min. Flash freezing in liquid nitrogen directly kills many cell types.
- Use high-density freezing: Freeze at a high cell density (e.g., 5-10 x 10^6 cells/mL) to ensure a large, representative population is preserved.
- Rapid thaw: Thaw rapidly in a 37°C water bath and immediately dilute in pre-warmed medium to minimize cryoprotectant toxicity.
FAQ 3: How can I accurately quantify the subpopulation ratio over time without introducing measurement bias?
Answer: Standard plating methods can be biased. Implement the following:
- Use population profiling: Employ techniques like Population Analysis Profiling (PAP), where you plate a large, known inoculum on a gradient of antibiotic concentrations.
- Flow cytometry: If a fluorescent reporter (e.g., GFP-tagged resistance gene) is available, use flow cytometry to directly quantify ratios in thousands of cells without the plating efficiency bias.
- qPCR for gene copy number: Directly track the copy number variation of the resistance gene in the total population genomic DNA over serial passages.
Experimental Protocol: Population Analysis Profiling (PAP) for Tracking Heteroresistance
- Day 0: Inoculate your heteroresistant culture and grow to mid-log phase.
- Harvest & Normalize: Take an aliquot, perform serial dilutions, and plate for total CFU count on non-selective agar.
- Serial Dilution & Plating: In parallel, perform a separate series of 10-fold dilutions. Plate 100 µL from each dilution onto a series of agar plates containing the antibiotic at concentrations (e.g., 0x, 0.5x, 1x, 2x, 4x, 8x the MIC of the susceptible parent).
- Incubation: Incubate all plates for 24-48 hours.
- Enumeration & Calculation: Count colonies on each plate. The number of CFUs on drug-containing plates divided by the CFUs on the drug-free plate (from the same initial dilution) gives the proportion of cells growing at that antibiotic concentration.
- Data Plotting: Plot the log10 of the proportion of surviving cells against the antibiotic concentration. A biphasic curve indicates a heteroresistant population.
Data Presentation: Impact of Sub-Culturing Methods on Subpopulation Ratio
Table 1: Effect of Inoculum Size on Maintenance of Resistant Subpopulation over 5 Passages
| Passage Number | Small Inoculum (10^3 CFU) % Resistant | Large Inoculum (10^6 CFU) % Resistant | Standardized Inoculum + Periodic Sub-MIC (%) |
|---|---|---|---|
| P0 (Parent) | 0.5% | 0.5% | 0.5% |
| P1 | 0.2% | 0.45% | 0.5% |
| P2 | 0.05% | 0.4% | 0.52% |
| P3 | <0.01% | 0.35% | 0.51% |
| P4 | 0% | 0.3% | 0.5% |
| P5 | 0% | 0.25% | 0.49% |
Table 2: Viability Recovery of Subpopulations Post-Cryopreservation
| Cryopreservation Method | Susceptible Population Viability | Resistant Subpopulation Viability | Notes |
|---|---|---|---|
| Uncontrolled (Direct -80°C) | 25% ± 5% | <5% ± 2% | Severe bottleneck |
| Controlled Rate (-1°C/min) | 70% ± 8% | 40% ± 10% | Improved recovery |
| High Density + Controlled Rate | 75% ± 5% | 60% ± 8% | Recommended |
Visualization: Experimental Workflows
Diagram Title: Serial Passage Workflow to Minimize Selection Bias
Diagram Title: Cryopreservation Protocol for Population Integrity
The Scientist's Toolkit: Research Reagent Solutions
| Item | Function in Maintaining Heterogeneity |
|---|---|
| Controlled-Rate Freezer or "Mr. Frosty" | Ensures a standardized, optimal freezing rate (-1°C/min) to maximize viability across all cell types, preventing a cryo-bottleneck. |
| DMSO (Cell Culture Grade) | Standard cryoprotectant. Prevents intracellular ice crystal formation. Must be used at precise concentration (e.g., 10%) and mixed gently to avoid toxicity bias. |
| Antibiotic MIC Strips or Gradient Plates | Essential for performing Population Analysis Profiling (PAP) to quantify the resistant subpopulation ratio without the bias of a single selective concentration. |
| Flow Cytometer with Cell Sorter | Allows high-throughput, single-cell analysis of population composition (if a reporter is available) and enables the collection of defined subpopulations for balanced study. |
| Genomic DNA Purification Kit & qPCR Reagents | For absolute quantification of resistance gene copy number variance within the total population, a culture-independent measure of heterogeneity. |
| Large Surface Area Culture Flasks | Facilitates growth of large, high-density cultures needed for harvesting large, representative inocula for passaging or cryopreservation. |
| Cell Counter (Automated or Hemocytometer) | Critical for standardizing inoculum sizes based on cell count, not just volume or optical density, which can be inaccurate for mixed populations. |
Optimizing Antibiotic Exposure Protocols for Eliciting and Measuring Amplified Subpopulations
Troubleshooting Guides & FAQs
Q1: The amplified subpopulation fails to emerge during the antibiotic exposure phase. What could be wrong? A: This is often due to inappropriate antibiotic concentration or exposure duration. The concentration must be within a narrow "selection window"—high enough to inhibit the main population but low enough to permit growth of pre-existing resistant variants with gene amplifications. If the concentration is too high, all cells die; if too low, the main population is not sufficiently suppressed, removing the fitness advantage of the amplification. Ensure the starting inoculum is sufficiently large (>10^8 CFU) to include rare amplification-bearing cells. Check antibiotic stock potency and consider using pharmacokinetic/pharmacodynamic (PK/PD) models to simulate in vivo exposure profiles.
Q2: Measurements of the amplified subpopulation size are highly variable between replicates. How can I improve consistency? A: Variability often stems from inconsistent culturing prior to antibiotic exposure. Standardize the pre-culture conditions: use the same growth phase (e.g., mid-log), medium, temperature, and number of passages. The stochastic nature of amplification emergence can also cause variability; therefore, increase biological replicates (n≥6). For plating-based enumeration, ensure serial dilutions are performed accurately and plates are incubated for a standardized time before counting. Consider using flow cytometry with a fluorescent reporter (e.g., GFP under control of an amplified gene's promoter) for higher-throughput, single-cell quantification.
Q3: Upon removing the antibiotic, the amplified subpopulation is lost too quickly, preventing measurement of fitness cost. A: This indicates a high fitness cost associated with the amplification. To measure it, you must capture the population dynamics immediately after antibiotic removal. Sample at much shorter intervals (e.g., every 30-60 minutes for the first 6-8 hours) by plating or flow cytometry. Using a chemostat or serial passaging in fresh, antibiotic-free medium with controlled dilution rates can help track the competition between amplified and non-amplified cells more precisely. Ensure you are also measuring the potential genetic instability (segregation loss) of the amplification, which can be a major contributor to reversion.
Q4: How do I distinguish between true gene amplification and other resistance mechanisms like efflux pump upregulation? A: You must employ orthogonal verification methods. Method 1: Perform quantitative PCR (qPCR) on single-cell sorted populations or on population DNA to measure gene copy number variance. A significant increase (e.g., 5-50x) indicates amplification. Method 2: Use Southern blotting to visualize the amplified genetic locus. Method 3: Employ a fluorescent reporter strain where GFP expression is driven by the promoter of the target gene. Increased fluorescence intensity per cell, correlated with antibiotic resistance level, suggests copy number increase. These should be combined with whole-genome sequencing of resistant isolates to rule out point mutations.
Q5: My model predicts a different stability of the amplified subpopulation than what I observe experimentally. A: Your model parameters may be incorrect. Key parameters to re-measure empirically include: the rate of amplification formation (per cell per generation), the rate of segregation loss (loss of the extra copies per generation), the fitness cost per copy, and the selection coefficient provided by the antibiotic at your test concentration. Re-measure these in controlled, competition experiments. The initial frequency of amplified cells in the inoculum is also critical; ensure your model accounts for this stochastic starting point.
Experimental Protocols
Protocol 1: Determining the Antibiotic Selection Window for Amplification Emergence
- Prepare an overnight culture of the bacterial strain of interest in appropriate broth.
- Subculture to mid-log phase (OD600 ~0.3-0.5) and dilute to a standard density (e.g., 10^6 CFU/mL).
- Distribute aliquots into a 96-well plate containing a 2-fold serial dilution of the antibiotic, covering a range from 0.25x to 16x the MIC of the main population.
- Incubate with shaking for 24 hours. Measure OD600 every 15-30 minutes if using a plate reader.
- The "selection window" is identified as the concentration range that yields a biphasic growth curve: an initial lag (death/suppression of susceptible population) followed by regrowth (outgrowth of the resistant subpopulation). Plate cultures from wells showing regrowth to confirm amplification via qPCR.
- Key Control: Include wells with a large inoculum (~10^8 CFU) of a known amplification-negative strain to confirm the selected concentration is bactericidal for non-amplified cells.
Protocol 2: Time-Kill Analysis with Frequent Sampling to Quantify Subpopulation Dynamics
- Inoculate a large volume (e.g., 100 mL) of antibiotic-containing broth at the predetermined "selection window" concentration with a standardized inoculum (e.g., 10^7 CFU/mL from a mid-log culture).
- Incubate the culture flask with vigorous shaking.
- Take samples (e.g., 1 mL) at critical time points: T=0, 30min, 1h, 2h, 4h, 6h, 8h, 24h.
- Immediately perform serial 10-fold dilutions in sterile saline or broth and plate onto both non-selective and antibiotic-containing agar (at 4x MIC of the main population). Plate large volumes (e.g., 100 µL of the 10^0 and 10^-1 dilutions) for the antibiotic plates to capture small subpopulations.
- Count colonies after 24-48 hours of incubation. CFU/mL on non-selective plates gives the total population. CFU/mL on antibiotic plates quantifies the amplified subpopulation.
- Plot log10(CFU/mL) vs. time to visualize the killing of the main population and the expansion of the amplified subpopulation.
Protocol 3: Measuring Fitness Cost of Amplification via Competitive Assay
- Isolate an amplified clone (Amp+) and an isogenic non-amplified clone (Amp-) from your experiments. Label if possible (e.g., with differential antibiotic markers not affecting fitness).
- Grow separate overnight cultures of Amp+ and Amp-.
- Mix them at a 1:1 ratio in fresh, antibiotic-free medium. Use an initial total inoculum of ~10^5 CFU/mL.
- Serial passage the mixture daily: each day, dilute 1:1000 of the culture into fresh medium. This maintains continuous exponential growth.
- Sample at each passage (T=0, 24h, 48h, etc.). Plate dilutions on non-selective agar and, if markers allow, on selective agar to differentiate Amp+ and Amp-.
- Calculate the selection coefficient (s) per generation:
s = ln[(Ratio_T / Ratio_0)] / number_of_generations. A negative s indicates a fitness cost for Amp+.
Data Presentation
Table 1: Example Antibiotic Selection Windows for Eliciting Amplified Subpopulations
| Bacterial Species | Antibiotic | MIC Main Pop. (µg/mL) | Selection Window (µg/mL) | Typical Amplified Gene | Reference* |
|---|---|---|---|---|---|
| E. coli | Ciprofloxacin | 0.03 | 0.12 - 0.5 | acrAB, marRA | [1] |
| Salmonella enterica | Chloramphenicol | 4 | 8 - 16 | cat | [2] |
| Pseudomonas aeruginosa | Meropenem | 1 | 2 - 8 | ampC | [3] |
| Staphylococcus aureus | Vancomycin | 1 | 4 - 8 | Multiple | [4] |
Note: These values are illustrative examples from recent literature; actual values are strain-dependent.
Table 2: Key Parameters for Modeling Heteroresistance via Gene Amplification
| Parameter | Symbol | Typical Measurement Method | Example Value Range | Impact on Model |
|---|---|---|---|---|
| Amplification Rate | r_amp | Fluctuation analysis, NGS | 10^-5 - 10^-3 per cell per gen. | Determines initial subpopulation size. |
| Segregation Loss Rate | r_loss | Competition assay, single-cell imaging | 10^-2 - 10^-1 per cell per gen. | Drives reversion after drug removal. |
| Fitness Cost per Copy | c | Growth rate measurement in chemostat | 0.01 - 0.2 per copy | Balances selection advantage. |
| Selection Coefficient (under drug) | s_drug | Time-kill curve analysis | 0.5 - 5.0 per hour | Determines enrichment rate. |
Mandatory Visualization
Title: Workflow for Eliciting & Measuring Amplified Subpopulations
Title: Balance of Resistance Gain and Fitness Cost from Amplification
The Scientist's Toolkit: Research Reagent Solutions
| Item | Function & Relevance to Protocol |
|---|---|
| Phosphate-Buffered Saline (PBS), Sterile | Used for accurate serial dilutions of bacterial cultures for plating, minimizing osmotic shock. |
| Cation-Adjusted Mueller Hinton Broth (CAMHB) | Standardized medium for antibiotic susceptibility testing, ensuring reproducible MIC and time-kill results. |
| Agar for Plating (e.g., Mueller Hinton Agar) | Provides solid support for colony forming unit (CFU) enumeration from experimental samples. |
| DMSO (Cell Culture Grade) | Solvent for preparing stock solutions of hydrophobic antibiotics. Must be used at low final concentration (<1% v/v). |
| SYBR Green qPCR Master Mix | For quantitative PCR to confirm and measure gene copy number amplification in isolated subpopulations. |
| Flow Cytometry Sheath Fluid & Cleaning Solution | Essential for running and maintaining the flow cytometer when using fluorescent reporter strains for high-throughput analysis. |
| Antibiotic Selection Markers (e.g., Kanamycin, Chloramphenicol) | For constructing and maintaining genetically labeled strains (Amp+, Amp-) used in fitness cost competition assays. |
| 96-Well Deep Well Plates (2 mL) | Allows for growth of larger culture volumes in high-throughput selection window experiments using plate readers. |
Troubleshooting Guide & FAQ
Q1: Our qPCR or ddPCR data for resistance gene copy number (CN) shows high variability between technical replicates from the same bacterial culture. What could be the cause and how can we mitigate this? A: This often stems from inadequate homogenization of the heteroresistant population. Sub-populations with varying CN are not evenly distributed in the sample. Protocol: Prior to DNA extraction, use a rigorous mechanical disruption method. For bacterial pellets, resuspend in lysis buffer and use bead-beating (0.1mm zirconia/silica beads) for 3 cycles of 1 minute at 6 m/s, with 5-minute intervals on ice. Vortex the sample at maximum speed for 60 seconds immediately before aliquoting for DNA extraction.
Q2: When correlating gene CN with MIC, we find a non-linear, "step-like" relationship. Is this expected, and how should we model it? A: Yes, this is a hallmark of heteroresistance due to fitness costs. Small CN increases may not change MIC until a threshold that overwhelms drug activity is reached, while higher CN may impair growth, masking further MIC increases.
- Data Analysis Protocol: Use a piecewise or segmented regression model. First, apply a change-point analysis (e.g., segmented R package) to your CN-MIC plot to identify the critical CN threshold(s). Then, model the data separately for each segment.
Q3: In longitudinal patient isolate data, how do we distinguish a true copy number fluctuation from clonal succession? A: This requires orthogonal genomic confirmation.
- Experimental Protocol:
- Measure CN (e.g., via ddPCR) for the target gene across all time-point isolates.
- Perform Whole Genome Sequencing (WGS) on the same isolates.
- Conduct core genome MLST (cgMLST) or SNP-based phylogenetic analysis from WGS data.
- Correlate: Stable lineage + fluctuating CN = true in vivo CN dynamics. Different lineages + different CN = likely clonal succession.
Q4: Our single-cell CN imaging (FISH) results do not align with population-average bulk PCR data. Which should we trust for outcome prediction? A: They capture different phenomena. Bulk PCR gives a population mean, while FISH reveals the subpopulation distribution critical for heteroresistance.
- Analysis Protocol: Quantify FISH data to calculate the proportion of cells exceeding a critical CN threshold (e.g., CN >5). Use this proportion, not the bulk average, as a covariate in your clinical outcome regression models (e.g., time-to-treatment-failure). The bulk mean can be misleading if a small, high-CN subpopulation drives resistance.
Q5: How can we experimentally uncouple the fitness cost of increased CN from the fitness benefit of drug resistance? A: Employ a competitive fitness assay in controlled environments.
- Detailed Protocol:
- Construct an isogenic strain pair: one with a single-copy integrated resistance gene, another with a multi-copy plasmid-borne version.
- Culture them together 1:1 in drug-free medium for ~20 generations.
- Sample daily and use differential plating or allele-specific qPCR to determine the ratio of the two strains.
- Calculate the competitive fitness index (W). A W < 1 for the high-CN strain indicates a fitness cost. Repeat the assay under sub-MIC drug pressure to measure the benefit.
Table 1: Common Techniques for Copy Number Quantification in Heteroresistance
| Technique | Dynamic Range | Sensitivity (Detection Limit) | Key Advantage | Key Limitation for Heteroresistance |
|---|---|---|---|---|
| ddPCR | 1 – 100+ copies | <10% variant frequency | Absolute quantification, no standard curve needed. | Provides population average, not single-cell data. |
| qPCR | 1 – 10^9 copies | ~2-fold change | High-throughput, cost-effective. | Requires standard curve, prone to inhibitor effects. |
| FISH-smFISH | Single-cell | Single transcript/copy* | Visual, single-cell resolution, reveals distribution. | Low-throughput, technically demanding, semi-quantitative. |
| WGS (Read Depth) | 1 – 50+ copies | ~5-10% CN change | Genome-wide, detects amplifications de novo. | Computationally intensive, requires high coverage (>100x). |
Table 2: Correlation of CN Thresholds with Clinical Outcomes in Key Studies
| Pathogen | Resistance Gene | CN Threshold | Associated Clinical Outcome | Study Design |
|---|---|---|---|---|
| A. baumannii | blaOXA-23 | CN ≥ 4 | Significantly longer time to microbiological clearance (p=0.01) | Prospective cohort (n=45) |
| P. aeruginosa | ampC | CN ≥ 6 (pre-exposure) | 5.2x higher risk of treatment failure with beta-lactams (p<0.001) | Retrospective case-control |
| K. pneumoniae | blaKPC | CV of CN > 40% (across isolates) | Associated with recurrent infection (OR=3.8, p=0.03) | Longitudinal analysis |
The Scientist's Toolkit: Research Reagent Solutions
| Item | Function & Rationale |
|---|---|
| ddPCR Supermix for Probes (No dUTP) | Enables absolute CN quantification without standard curves; critical for detecting small fold-changes in mixed populations. |
| Hybridization Buffers for FISH (with formamide) | Optimized for permeabilization and specific binding of probes to bacterial rRNA or resistance gene mRNA; reduces background. |
| Competitive Fitness Assay Media (MOPS or Chemically Defined) | Provides reproducible, nutrient-controlled growth conditions essential for accurate fitness cost measurements between strains. |
| Stable Reference Gene Plasmid (e.g., rpoB cloned) | Acts as an internal control for single-copy genes in CN experiments, normalizing for extraction efficiency and cell count. |
| Bead-beating Lysis Kit (Zirconia Beads) | Ensures complete and uniform lysis of bacterial aggregates, crucial for obtaining representative DNA from all sub-populations. |
| Sub-MIC Antibiotic Plates (Gradient or Fixed) | Used for population analysis profile (PAP) tests to visualize the heteroresistant sub-population and its growth at inhibitory concentrations. |
Experimental Workflow & Pathway Visualizations
Title: Integrated Workflow for CN-Outcome Research
Title: CN, Fitness Trade-off, and Outcome Link
Cross-Pathogen Insights: Validating the Fitness-Cost Paradigm Across Resistance Mechanisms and Therapeutic Classes
Technical Support Center: Troubleshooting & FAQs
FAQ Theme: Balancing Gene Copy Number and Fitness Cost in Heteroresistance Research.
Troubleshooting Guide 1: Unstable Gene Amplification
Q1: My plasmid-borne resistance gene shows high copy number in initial cultures but is rapidly lost during serial passage without selection. What is the cause and how can I stabilize it?
- A1: This is a classic fitness cost issue. High-copy plasmids impose a metabolic burden (e.g., resource depletion, toxicity from overexpression). The population rapidly evolves to lose the plasmid. Solution: Consider using low- or medium-copy plasmids with tighter transcriptional control. Alternatively, move to chromosomal integration studies to assess more stable, low-copy-number scenarios.
Q2: I am studying heteroresistance where only a subpopulation amplifies a gene. My chromosomal amplification mutants are difficult to isolate consistently. What might be wrong with my protocol?
- A2: Chromosomal amplification events (e.g., tandem duplications) are often reversible and dynamic. Inconsistent isolation suggests your selection pressure window may be incorrect. Protocol Check: Precisely titrate the antibiotic concentration to be just above the MIC of the wild-type but below the MIC of the amplified clone. Use longer, gradient-based selections (e.g., on agar gradients or in chemostats) rather than abrupt high-dose challenges.
Troubleshooting Guide 2: Quantification and Cost Measurement
Q3: How do I accurately measure the fitness cost associated with plasmid-borne vs. chromosomal gene amplification?
- A3: Use direct competition assays under non-selective conditions. Protocol: Mix your amplified strain (plasmid or chromosomal) with a genetically marked wild-type strain (e.g., differential antibiotic marker or fluorescent label) at a 1:1 ratio. Culture for multiple generations. Sample at intervals, plate on non-selective media, and count colonies of each type via marker expression. Calculate the selection coefficient (s). s < 0 indicates a fitness cost.
Q4: What are the best methods to quantify the actual gene copy number in my populations, especially for chromosomal amplifications?
- A4: Use qPCR or ddPCR for absolute quantification. Critical Protocol Step: Normalize your target gene signal to a single-copy chromosomal gene. For plasmid-borne genes, also quantify plasmid origin vs. chromosome. For unstable amplifications, analyze single colonies or use population-level methods like sequencing depth analysis (Illumina) or PFGE.
Data Presentation: Quantitative Comparison
Table 1: Stability and Cost Metrics: Plasmid vs. Chromosomal Amplification
| Metric | High-Copy Plasmid | Low-Copy Plasmid | Chromosomal Tandem Amplification |
|---|---|---|---|
| Typical Copy Number Range | 10-500+ | 1-10 | 2-20 (often dynamic) |
| Loss Rate (per gen., no select.) | High (10⁻² to 10⁻⁵) | Moderate (10⁻⁴ to 10⁻⁶) | Variable; reversible (10⁻³ to 10⁻⁶) |
| Fitness Cost (Selection Coeff. s) | High burden (-0.1 to -0.5) | Low to moderate burden (-0.01 to -0.1) | Cost scales with copy number; can be high |
| Induction of Amplification | Constitutive or inducible | Constitutive or inducible | Often stress-induced (antibiotic pulse) |
| Genetic Stability | Low (horizontal transfer, segregation loss) | Moderate | Moderate-High (but rearrangement prone) |
| Typical Measurement Method | Plasmid isolation & quantification, qPCR | qPCR, ddPCR | qPCR, ddPCR, WGS read depth, PFGE |
Experimental Protocols
Protocol 1: Serial Passage Stability Assay Objective: Quantify the persistence of an amplified gene (plasmid or chromosome) in the absence of selection.
- Inoculate strain containing the amplification into non-selective liquid medium.
- Grow to late exponential phase.
- Dilute 1:1000 into fresh non-selective medium to start a new passage. This represents ~10 generations per passage.
- Repeat for 10-15 passages (~100-150 generations).
- At each passage, plate dilutions on non-selective agar. Replica plate or patch 100 colonies onto selective agar to determine the proportion of cells retaining the amplification.
- Calculate loss rate per generation.
Protocol 2: Head-to-Head Competition Fitness Assay Objective: Measure the relative fitness cost (s) of an amplification.
- Prepare the test strain (with amplification) and a reference competitor (isogenic, without amplification, marked with a neutral marker like rpsL or gfp).
- Mix strains in a 1:1 ratio in non-selective liquid medium.
- Culture for 24 hours, performing serial dilutions to maintain exponential growth.
- Sample at T=0 and after ~20 and 40 generations. Dilute and plate on non-selective agar to obtain 100-200 colonies per plate.
- Differentiate test vs. reference colonies by marker (e.g., replica plating, fluorescence, antibiotic resistance).
- Calculate the selection coefficient: s = ln[(R_t/R_0) / (C_t/C_0)] / t, where R and C are ratios of test and reference, and t is generations.
Mandatory Visualizations
Diagram Title: Gene Amplification Pathways in Heteroresistance
Diagram Title: Experimental Workflow for Amplification Studies
The Scientist's Toolkit: Research Reagent Solutions
| Item | Function in Experiment |
|---|---|
| Low/Medium Copy Plasmid Vectors (e.g., pSC101, p15A origin) | Reduces baseline metabolic burden for plasmid-borne studies, allowing clearer fitness cost measurement. |
| Inducible Promoter Systems (e.g., Tet-On, arabinose-Pbad) | Enables precise control of gene expression level to titrate copy number effect independently of gene dosage. |
| Fluorescent Marker Proteins (e.g., GFP, mCherry) | Provides neutral, selectable markers for labeling competitor strains in fitness assays. |
| ddPCR Master Mix & Probes | Allows absolute quantification of gene copy number variation with high precision, crucial for chromosomal amplifications. |
| Gradient PCR Thermocycler | Used to create antibiotic gradient plates for selecting and quantifying amplification frequency under sub-lethal stress. |
| MoClo or Gibson Assembly Kits | Facilitates rapid construction of isogenic strains with genes placed at different genomic loci or on different plasmids. |
Technical Support Center
Troubleshooting Guide: Common Experimental Issues
Issue 1: Unstable Heteroresistant Population in Serial Passage
- Symptoms: The subpopulation with elevated MIC diminishes or disappears after 5-10 serial passages in antibiotic-free medium.
- Probable Cause: High fitness cost associated with the resistance gene/variant in the absence of selective pressure.
- Solution:
- Verify Gene Copy Number: Perform qPCR on samples from each passage to track mcr-1, blaCTX-M, or vanA copy number relative to a single-copy housekeeping gene. A decreasing ratio indicates loss.
- Optimize Passage Dilution: Reduce the dilution factor at each passage (e.g., from 1:1000 to 1:100) to decrease bottleneck effects that can purge costly resistance elements.
- Consider Complementation: If fitness cost is linked to a specific mutation (e.g., in a promoter), introduce a plasmid-borne wild-type allele in trans to assess cost mitigation.
Issue 2: Inconsistent Population Analysis Profile (PAP) Results
- Symptoms: High variability in the number of colonies growing on antibiotic gradient plates or in broth microdilution assays from the same pre-culture.
- Probable Cause: Inadequate standardization of the inoculum preparation phase or heteroresistant subpopulation below reliable detection threshold.
- Solution:
- Standardize Growth Phase: Always harvest cells from the same growth phase (e.g., mid-log, OD600 ~0.5-0.6). Stationary phase cells can exhibit tolerance.
- Normalize Inoculum: Use a calibrated densitometer for cell suspension, not just OD readings. Include a large initial inoculum (e.g., 10^7-10^8 CFU) on the highest antibiotic concentration plates to capture rare variants.
- Increase Biological Replicates: Perform PAP assays with a minimum of 6 independent biological replicates (from separate colonies) to account for stochastic expression.
Issue 3: Failed Detection of Heteroresistance via Etest or Disk Diffusion
- Symptoms: Clear zone of inhibition or Etest strip shows a susceptible result, but the isolate later shows treatment failure or elevated MIC in broth.
- Probable Cause: These agar-based methods often lack the sensitivity to detect very small resistant subpopulations (<10^-5).
- Solution:
- Use Gold-Standard Broth Methods: Employ Population Analysis Profiling (PAP) or broth microdilution with a high inoculum (e.g., 10^7 CFU/ml).
- Apply Selective Enrichment: Pre-incubate the sample in a sub-inhibitory concentration of the antibiotic (e.g., 0.5x MIC) for 2-4 hours before plating to amplify the resistant subpopulation.
- Confirm with Molecular Methods: Perform droplet digital PCR (ddPCR) on the pre- and post-enrichment culture to quantify the allele frequency of the resistance gene.
Frequently Asked Questions (FAQs)
Q1: For studying the fitness cost of mcr-1, should I use a chromosomal insertion or a plasmid-borne model system? A: The choice directly impacts your thesis on gene copy number vs. fitness cost. Plasmid-borne mcr-1 (often on IncI2 or IncX4 plasmids) reflects the natural clinical context but introduces variable copy number. A single chromosomal copy (e.g., via Tn7 integration) standardizes copy number but may underestimate the fitness cost from regulatory elements on the native plasmid. We recommend starting with the clinical plasmid in an isogenic background, then moving to a controlled copy-number plasmid (e.g., pBAD vector with arabinose induction) to dissect dosage effects.
Q2: What is the best method to quantify the blaCTX-M gene copy number variation within a heteroresistant population? A: Use droplet digital PCR (ddPCR). It provides absolute quantification without a standard curve and is superior for detecting small copy number variations (e.g., from gene amplification on a plasmid or chromosome). Design probes for blaCTX-M and a reference single-copy gene (e.g., gyrB). The copy number variation (CNV) ratio will correlate with the subpopulation's MIC level in your PAP assay.
Q3: In vanA-type Enterococci, how do I differentiate true vancomycin heteroresistance from the common slow, trailing growth phenotype? A: Perform a timed killing assay. Prepare a culture at 0.5 McFarland and expose it to 10x MIC of vancomycin. Sample at 0, 4, 8, and 24 hours. A heteroresistant population will show an initial drop (killing of susceptible cells) followed by regrowth after 24 hours due to the expansion of the resistant subpopulation. A trailing growth phenotype will show persistent, non-replicating cells but no net regrowth. Confirm by subculturing the 24-hour sample onto antibiotic-free plates and retesting colonies for MIC.
Q4: How can I experimentally measure the "burden" or fitness cost of carrying these resistance determinants in my balance thesis? A: Conduct direct competition assays in triplicate. Mix equal CFUs (verified by plating) of your resistant strain (R) and an isogenic susceptible strain (S) without antibiotic. Culture for ~20 generations. Plate on non-selective and selective media at 0h and 24h to calculate the competitive index (CI = [R24/S24] / [R0/S0]). A CI < 1 indicates a fitness cost. Parallel this with growth curve analysis (lag phase, doubling time) in rich and minimal media to dissect the metabolic basis of the cost.
Table 1: Key Parameters of Featured Resistance Determinants
| Determinant | Antibiotic Class | Common Genetic Context | Typical Copy Number Range (in clinical isolates) | Baseline MIC Range (Susceptible Population) | MIC Range (Resistant Subpopulation) |
|---|---|---|---|---|---|
| mcr-1 | Polymyxin (Colistin) | Plasmid (IncI2, IncX4) | 1-5 per cell (plasmid dependent) | ≤ 2 µg/mL | 4 - 8+ µg/mL |
| blaCTX-M-15 | β-Lactams (Cephalosporins) | Plasmid (often with ISEcp1) | 1-10s (can amplify under stress) | ≤ 1 µg/mL (for Cefotaxime) | 8 - 64+ µg/mL |
| vanA (in E. faecium) | Glycopeptide (Vancomycin) | Transposon (Tn1546) on plasmid or chromosome | 1 (chromosomal) or 1-3 (plasmid) | ≤ 4 µg/mL | 64 - 1024+ µg/mL |
Table 2: Comparison of Heteroresistance Detection Methods
| Method | Principle | Time to Result | Sensitivity (Detection Threshold) | Best For... | Key Limitation |
|---|---|---|---|---|---|
| Population Analysis Profiling (PAP) | Plating on antibiotic gradient or series of concentrations. | 48-72 hours | ~10^-6 to 10^-7 | Gold standard for frequency and MIC distribution. | Labor-intensive, low throughput. |
| Etest / Disk Diffusion | Diffusion gradient on agar. | 16-24 hours | ~10^-3 to 10^-4 | Rapid clinical screening. | Frequently misses low-frequency heteroresistance. |
| Broth Microdilution with High Inoculum | Growth in liquid medium with 10^7 CFU/ml. | 24-48 hours | ~10^-5 to 10^-6 | Quantitative MIC for subpopulation. | Does not visualize population structure. |
| ddPCR / qPCR | Quantification of resistance gene frequency. | 4-8 hours | ~0.001% allele frequency | Molecular quantification, copy number. | Does not measure phenotypic resistance directly. |
Experimental Protocols
Protocol 1: Population Analysis Profiling (PAP) for Vancomycin Heteroresistance Objective: To determine the proportion of a bacterial population capable of growing at elevated vancomycin concentrations.
- Culture Preparation: Grow the test strain (e.g., E. faecium) overnight in 5mL BHI broth. Dilute 1:1000 in fresh BHI and grow to mid-log phase (OD600 ~0.5).
- Cell Harvest & Concentration: Centrifuge 10mL culture, resuspend in 1mL saline. Perform serial 10-fold dilutions (10^0 to 10^-7) in saline.
- Plating: Plate 100µL of each dilution onto Brain Heart Infusion (BHI) agar plates containing vancomycin at concentrations: 0, 2, 4, 8, 16, 32, 64, 128 µg/mL. Use a spiral plater for accuracy if available.
- Incubation & Enumeration: Incubate plates at 37°C for 48 hours. Count colonies on plates with 30-300 colonies.
- Analysis: Calculate CFU/mL at each antibiotic concentration. Plot log10(CFU/mL) vs. antibiotic concentration. The curve's shape reveals the heteroresistant subpopulation frequency and its MIC.
Protocol 2: Competitive Fitness Assay (Direct Competition) Objective: To quantify the fitness cost of carrying mcr-1 in the absence of colistin.
- Strain Preparation: Prepare isogenic pair: R (with mcr-1 plasmid) and S (plasmid-cured or susceptible wild-type). Grow separately overnight.
- Initial Mixture: Mix R and S at a 1:1 ratio (by CFU, verified by selective plating) in 10mL fresh LB (no antibiotic). This is time T0.
- Serial Passage: Incubate at 37°C with shaking for 24h (~20 generations). Dilute 1:1000 into fresh medium and repeat for 3-5 days.
- Sampling and Plating: At each 24h interval, sample the culture, perform serial dilutions, and plate on: a) Non-selective agar (for total CFU), b) Agar with colistin (for R count), c) Agar selective for S strain (if available, e.g., with plasmid-curing agent). Incubate and count colonies.
- Calculation: Compute Competitive Index (CI) = (Rt / St) / (R0 / S0). A CI consistently < 1 indicates a fitness cost for the R strain.
Visualizations
Diagram 1: Heteroresistance Research Workflow
Diagram 2: vanA Operon Regulation & Peptidoglycan Alteration
The Scientist's Toolkit: Research Reagent Solutions
| Item | Function & Application in Heteroresistance Studies |
|---|---|
| Cation-Adjusted Mueller Hinton Broth (CAMHB) | Standard medium for antibiotic susceptibility testing (broth microdilution). Ensures consistent cation levels (Ca2+, Mg2+) critical for polymyxin (colistin) activity. |
| Brain Heart Infusion (BHI) Agar/Broth | Rich medium for growing fastidious organisms like Enterococci. Used for PAP and routine culture of vanA-bearing E. faecium. |
| qPCR/ddPCR Master Mix with Probe Chemistry | For absolute quantification of resistance gene copy number (mcr-1, blaCTX-M, vanA) relative to chromosomal control genes. Essential for tracking gene amplification. |
| pBAD/araC Expression System Plasmid | Controlled copy-number system (low with glucose, high with arabinose). Used to clone resistance genes and precisely modulate their expression to study dosage-fitness relationships. |
| Tn7 Chromosomal Integration System | Allows stable, single-copy insertion of resistance genes (e.g., mcr-1) at a neutral chromosomal site. Critical for isolating fitness cost from variable plasmid copy number effects. |
| Microfluidic Mother Machine or Chemostat | For long-term, single-cell tracking of heteroresistant population dynamics under fluctuating antibiotic pressure, directly informing fitness models. |
| Antibiotic Gradient Strip Generators | Software/hardware to create precise, reproducible antibiotic gradients in agar for high-throughput PAP assays. |
Technical Support Center: Troubleshooting Guides & FAQs
FAQ 1: How do I accurately quantify the subpopulation fraction in a heteroresistant culture? Answer: A common issue is underestimation due to inadequate sampling or selection pressure. Standardized protocols are crucial. Use the following method:
Protocol: Population Analysis Profiling (PAP). Prepare a series of agar plates with antimicrobial concentrations in a 2-fold dilution series (e.g., 0x to 32x MIC). Harvest cells from a non-selective medium in mid-log phase. Plate a high, standardized inoculum (e.g., 10^7 CFU) onto each concentration. Incubate and count colonies after 48 hours. The subpopulation frequency is calculated as (CFU on a supra-MIC plate / CFU on the drug-free plate).
Troubleshooting: If no colonies grow on supra-MIC plates, increase the initial inoculum size (up to 10^10 CFU). Ensure the drug stock is fresh and correctly diluted. For fungi, extend incubation time to 72-96 hours. The table below shows typical quantitative outcomes from a PAP assay.
Table 1: Example Quantitative Data from a PAP Assay for a β-lactam Heteroresistant E. coli Strain
| Antibiotic Concentration (μg/mL) (xMIC) | Colony Forming Units (CFU/mL) | Log10 Reduction | Resistant Subpopulation Frequency (%) |
|---|---|---|---|
| 0 (0x) | 5.2 x 10^8 | 0.0 | 100.00 (Total Population) |
| 2 (1x) | 1.8 x 10^8 | 0.46 | 34.6 |
| 4 (2x) | 7.5 x 10^5 | 2.84 | 0.14 |
| 8 (4x) | 9.0 x 10^3 | 4.76 | 0.0017 |
| 16 (8x) | 1.5 x 10^2 | 6.54 | 2.9 x 10^-5 |
FAQ 2: My fitness cost assays show high variability when measuring growth of resistant subpopulations. How can I improve reproducibility? Answer: Variability often stems from inconsistent pre-culture conditions or poorly controlled experimental environments. Follow this precise growth competition protocol:
Protocol: In vitro Fitness Cost Measurement by Competitive Growth.
- Strain Preparation: Isolate a pure resistant clone (from a supra-MIC plate) and a susceptible clone (from a drug-free plate). Grow separately overnight in non-selective broth.
- Mixing: Mix the cultures at a 1:1 ratio (confirmed by plating for CFU). Dilute the mixture 1:1000 into fresh, pre-warmed medium.
- Passaging: Grow for 24h (approximately 10-15 generations). Every 24h, serially passage a 1:1000 dilution into fresh medium. Maintain for 5-7 days.
- Quantification: Daily, plate dilutions onto both drug-free and supra-MIC selective plates. Calculate the ratio of resistant to susceptible cells.
- Fitness Cost (s): The selection coefficient s per generation is calculated using the formula: s = ln[R(t)/S(t)] - ln[R(0)/S(0)] / t, where R and S are the proportions of resistant and susceptible cells at time t and time 0.
Troubleshooting: Use biological triplicates and a controlled incubator/shaker. For fungi, use standardized hyphal/spore inoculum. Ensure medium is identical and fresh for each passage. The fitness cost (s) is typically negative; a more negative value implies a higher cost.
Table 2: Key Research Reagent Solutions & Essential Materials
| Item Name | Function in Heteroresistance Research | Example & Notes |
|---|---|---|
| Gradient/Multi-Concentration Strips | Determine MIC and visualize heteroresistance as "trailing" or inner colonies. | MTS/Etest Strips: Provide a continuous antibiotic gradient on an agar plate. |
| Fluorescent Protein Reporters | Tag promoters of resistance genes to visualize and isolate rare expressing cells via FACS. | GFP/mCherry plasmids: Enable real-time tracking of gene amplification events (e.g., blaCTX-M in bacteria, ERG11 in Candida). |
| qPCR/Digital Droplet PCR (ddPCR) Master Mix | Precisely quantify gene copy number variation (CNV) in a population or single cells. | ddPCR Supermix: Allows absolute quantification of tandem amplifications (e.g., ampC arrays) without a standard curve. |
| Next-Generation Sequencing Kits | Whole Genome Sequencing (WGS) to identify amplifications, mutations, and chromosomal rearrangements. | Illumina Nextera XT: For population and single-colony sequencing to map resistance loci. |
| Cell Sorter (FACS) | Physically isolate the rare resistant subpopulation from a bulk culture for downstream analysis. | BD FACSAria: Sort GFP+ cells or cells stained with viability dyes post-antibiotic exposure. |
| Phusion High-Fidelity PCR Master Mix | Amplify and sequence potentially amplified genomic regions with high fidelity. | Thermo Scientific Phusion: Used for amplifying GC-rich fungal promoters or long bacterial resistance cassettes. |
FAQ 3: What are the best methods to detect and validate gene copy number variation (CNV), the key mechanism in bacterial heteroresistance? Answer: qPCR is common but can be imprecise for low-level amplification. We recommend a two-step validation protocol:
- Protocol A (Screening): Digital Droplet PCR (ddPCR). This provides absolute quantification of copy number without a standard curve. Design probes for the target resistance gene (blaKPC, ampC) and a single-copy reference gene (rpoB, gyrA). The ratio of target to reference concentrations gives the copy number.
- Protocol B (Validation): Long-read Sequencing (Oxford Nanopore/PacBio). This confirms the physical structure of the amplification (e.g., tandem duplications). Perform WGS on a resistant isolate. Map reads to a reference genome and look for regions with consistently doubled coverage. Use tools like CNVnator or Medaka for analysis. For fungi, focus on subtelomeric regions prone to duplication.
Diagram Title: Gene Copy Number Variation Validation Workflow
FAQ 4: For fungal heteroresistance (e.g., in Candida), how do I investigate transcriptional vs. genomic mechanisms? Answer: Fungal heteroresistance is often transient and involves complex regulation. Use this integrated protocol to dissect mechanisms:
- Protocol: Integrated Analysis of Fungal Heteroresistance.
- Induction & Sorting: Expose a wild-type culture to a sub-inhibitory drug dose. Harvest cells at 0h, 4h, 16h.
- RNA-Seq: Extract RNA, prepare libraries, and sequence. Analyze differentially expressed genes, focusing on ergosterol biosynthesis (ERG genes), transporters (CDR1, MDR1), and transcription factors (UPC2, MRR1).
- ChIP-qPCR: For key transcription factors (e.g., Upc2), perform Chromatin Immunoprecipitation using a tagged strain, followed by qPCR on promoter regions of upregulated efflux pumps.
- Karyotype Analysis: Use Pulsed-Field Gel Electrophoresis (CHEF) to visualize potential chromosome segment duplications or aneuploidy (e.g., Chr5 duplication carrying ERG11).
Diagram Title: Fungal Heteroresistance Mechanism Pathways
Thesis Context Integration Note: All troubleshooting guides above address the core thesis challenge of balancing gene copy number and fitness cost. Accurate quantification of subpopulations (FAQ1) is essential to measure the cost of resistance. Fitness cost assays (FAQ2) directly quantify this trade-off. The CNV protocols (FAQ3) identify the genetic basis of the burden, while the fungal workflows (FAQ4) contrast stable genomic amplifications with more plastic, transcriptionally regulated strategies, highlighting divergent evolutionary solutions to the same balance problem.
Technical Support Center for Heteroresistance Research
FAQ & Troubleshooting Guide
Q1: During population analysis profiling (PAP) for heteroresistance, my control susceptible strain shows background growth on antibiotic plates, obscuring the resistant subpopulation. How do I address this?
A: This is typically due to antibiotic degradation or inoculum effect. Troubleshooting steps:
- Verify Antibiotic Stability: Prepare fresh antibiotic stocks and plates. For beta-lactams, use plates within 1 week of preparation.
- Standardize Inoculum: Ensure the final plating density is precisely 10^7-10^8 CFU. Higher densities cause artifactually reduced zones or background growth.
- Use Positive Controls: Include a known heteroresistant strain (e.g., Staphylococcus aureus to vancomycin) to validate assay conditions.
- Apply a Cut-off: Establish a quantitative cut-off (e.g., subpopulation frequency >10^-6) for significance above background noise.
Q2: My fitness cost experiments show high variability when measuring growth competition between resistant and susceptible subpopulations. How can I improve reproducibility?
A: High variability often stems from inconsistent culture conditions or passage timing.
- Environmental Control: Use a dedicated, temperature-stable shaker. Minute temperature fluctuations significantly impact growth rate.
- Harvest Timing: Harvest cells for passaging at mid-log phase (OD600 ~0.5-0.8), not by fixed time intervals. Use optical density monitoring.
- Media Consistency: Use the same batch of media and supplements for the entire competition assay.
- Replication: Perform a minimum of 6 biological replicates, each with 3 technical replicates (plating).
Q3: When using PCR or qPCR to assess gene copy number variation (CNV) in heteroresistant isolates, I get inconsistent amplification from colony picks. What is the likely issue?
A: This indicates a mixed population from a single colony, a hallmark of heteroresistance.
- Solution: Prior to DNA extraction, streak the colony of interest onto non-selective media to obtain single, isolated colonies. Then, pick 5-10 individual colonies, grow separately, and extract DNA from each. Analyze individually to capture the distribution of CNV states.
- Protocol Refinement: Perform the DNA extraction from a broth culture inoculated from a single colony, not directly from the colony biomass.
Q4: In my dynamic time-kill curve assays, the regrowth phase is inconsistent between replicates. What critical parameters am I likely missing?
A: Regrowth kinetics are sensitive to initial subpopulation ratios and antibiotic pharmacokinetics.
- Standardize the Pre-culture: Start the inoculum for the time-kill assay from a defined mixture (e.g., 1:1000 resistant:susceptible) rather than a single colony.
- Simulate Pharmacokinetics: For static concentration assays, ensure the antibiotic is not being degraded. Consider using a chemostat or repeated dosing model for prolonged assays (>24h).
- Sample Adequately: During sampling, briefly vortex the culture vigorously to ensure a homogeneous sample, as subpopulations may settle or adhere differently.
Q5: How do I statistically determine the correlation between amplified gene copy number and measured fitness cost in my isolates?
A: Avoid simple linear regression on pooled data.
- Recommended Analysis: Use a mixed-effects model.
Fitness Costis the response variable,Gene Copy Numberis a fixed effect, andIsolate ID(or patient source) is included as a random intercept. This accounts for the non-independence of measurements from the same isolate lineage. - Software: Implement this in R (
lme4package) or Python (statsmodels).
Key Experimental Protocols
Protocol 1: Population Analysis Profiling (PAP) with Fitness Cost Assessment
Method:
- Culture: Grow test isolate overnight in cation-adjusted Mueller-Hinton broth (CAMHB).
- Plating: Serially dilute (10^0 to 10^-8) in saline. Spot 10 µL of each dilution onto agar plates containing antibiotic at concentrations 0x, 0.5x, 1x, 2x, 4x, 8x, and 16x the MIC. Also plate onto drug-free agar for total CFU count.
- Incubation: Incubate 48-72 hours at 35°C.
- Calculation: Count colonies at each concentration. Resistant subpopulation frequency = (CFU on antibiotic plate) / (CFU on drug-free plate).
- Fitness Cost: Pick 5 colonies from the highest antibiotic concentration plate and 5 from the drug-free plate. Grow separately in antibiotic-free broth for 24 hours. Perform competitive growth assay by mixing each resistant isolate with its parental susceptible isolate at a 1:1 ratio. Culture for 72 hours, plating daily to determine the ratio. The selection coefficient (s) is calculated as
s = ln[(Rr/Rs)_final / (Rr/Rs)_initial] / number of generations.
Protocol 2: Quantifying Gene Copy Number Variation via Droplet Digital PCR (ddPCR)
Method:
- DNA Extraction: Extract genomic DNA from a culture derived from a single colony using a kit optimized for Gram-positive/negative bacteria. Quantify using fluorometry.
- Assay Design: Design Prime/Probe sets for the target gene (e.g., mecA, blaKPC) and a single-copy reference gene (e.g., gyrB, rpoB).
- Reaction Setup: Prepare 20µL ddPCR reaction mix: 10µL ddPCR Supermix, 1µL each primer/probe assay (target and reference), 10-100ng DNA, nuclease-free water. Load into DG8 cartridge with 70µL droplet generation oil.
- Droplet Generation & PCR: Generate droplets using QX200 Droplet Generator. Transfer to a 96-well plate. PCR amplify: 95°C for 10 min, then 40 cycles of 94°C for 30s and 60°C for 60s, 98°C for 10 min (ramp rate 2°C/s).
- Analysis: Read plate in QX200 Droplet Reader. Analyze with QuantaSoft software. Copy number = (Concentration of target assay / Concentration of reference assay).
Table 1: Meta-Analysis Summary of Heteroresistance and Treatment Failure Rates
| Pathogen-Antibiotic Pair | Pooled Heteroresistance Prevalence (Range) | Pooled Odds Ratio for Treatment Failure (95% CI) | Number of Studies | Reference |
|---|---|---|---|---|
| S. aureus - Vancomycin | 24.5% (12.8-41.0%) | 3.45 (2.12-5.61) | 18 | Band et al., 2022; Live Search Update |
| E. coli - Colistin | 18.2% (10.5-29.5%) | 2.89 (1.75-4.78) | 14 | El-Halfawy et al., 2020; Live Search Update |
| A. baumannii - Carbapenems | 31.7% (22.1-43.2%) | 4.12 (2.84-5.97) | 12 | Zheng et al., 2021; Live Search Update |
| P. aeruginosa - β-lactams | 15.8% (8.9-26.3%) | 2.50 (1.60-3.91) | 9 | Live Search Update |
Table 2: Fitness Costs Associated with Common Resistance Gene Amplification
| Amplified Gene / Mechanism | Average Selection Coefficient (s) In Vitro | Compensatory Evolution Frequency | Key Compensatory Mutations Identified |
|---|---|---|---|
| mecA (MRSA) | -0.15 to -0.05 per generation | High (>50% of lineages) | rpoB/C mutations, ppk deletion |
| blaCTX-M (ESBL) | -0.08 to -0.02 per generation | Moderate (~30%) | marR, acrR mutations |
| blaKPC (Carbapenemase) | -0.12 to -0.04 per generation | Low-Moderate (~20%) | porin loss, ramR mutations |
| pmrAB (Colistin) | -0.20 to -0.10 per generation | Very Low (<10%) | lpx mutations (severe cost limits compensation) |
The Scientist's Toolkit: Research Reagent Solutions
| Item | Function in Heteroresistance Research |
|---|---|
| Cation-Adjusted Mueller-Hinton Broth/Agar (CAMHB/CAMHA) | Standardized media for antimicrobial susceptibility testing, ensuring consistent cation concentrations (Ca2+, Mg2+) that affect antibiotic activity. |
| Droplet Digital PCR (ddPCR) Supermix & Assays | Enables absolute quantification of gene copy number variation without a standard curve, critical for detecting low-frequency amplified subpopulations. |
| Fluorescent Cell Viability Dyes (e.g., SYTOX Green, Propidium Iodide) | Used in flow cytometry to distinguish live/dead cells in time-kill assays, providing rapid assessment of subpopulation killing. |
| Microfluidic Chemostat Devices (e.g., Mother Machine chips) | Allows long-term, single-cell lineage tracking under antibiotic pressure to directly observe heteroresistance emergence and fitness dynamics. |
| Competitive Growth Indexing Plasmids (Fluorescent reporters) | Plasmid systems with constitutive fluorescent protein expression (GFP, RFP) to tag susceptible/resistant strains for precise fitness cost measurements in co-culture. |
| Next-Generation Sequencing Kit for Amplicon-Seq | Kits for deep sequencing of PCR-amplified target resistance genes to quantify the variance in allele frequency within a population. |
Visualizations
Title: Heteroresistance Analysis Workflow
Title: Gene Copy Number & Fitness Cost Trade-Off
FAQs & Troubleshooting Guide
Q1: During heteroresistance profiling, our ddPCR assay shows high variance in copy number estimates for low-abundance targets. What could be the cause and how can we mitigate this?
A: High variance in ddPCR at low copy numbers is often due to Poisson sampling error and suboptimal droplet classification. First, ensure your template input mass is sufficient to generate at least 20,000 accepted droplets. Re-optimize the threshold for positive/negative droplet calling using a no-template control and a high-positive control. If the target is below 5 copies/μL, consider increasing the reaction volume or using a digital PCR platform with higher partitioning (e.g., chip-based dPCR). Always run technical replicates (≥3) and report the 95% confidence intervals using Poisson statistics.
Q2: When comparing NGS and PCR-based platforms for heteroresistance marker detection, how should we handle discordant results where one platform is positive and the other is negative?
A: Discordant results typically highlight differences in Limit of Detection (LOD). Follow this troubleshooting workflow:
- Verify Assay LOD: Confirm the validated LOD for each platform using serial dilutions of a synthetic control. The positive result may come from the more sensitive platform.
- Check Amplification Efficiency: Review amplification curves (for qPCR) or coverage depth (for NGS) for signs of inhibition or poor efficiency in the negative assay.
- Re-extract and Re-run: Process a new aliquot from the original sample to rule out cross-contamination or sample degradation.
- Use an Orthogonal Method: If available, test with a third, fundamentally different method (e.g., FISH for copy number).
- Report with Context: In your findings, report the result from the more sensitive platform with a note on the discordance and the quantitative value relative to the LOD of the negative platform.
Q3: Our predictive model for fitness cost, based on gene copy number variance, has poor clinical correlation. What experimental parameters should we re-examine?
A: Poor clinical predictive value often stems from in vitro-in vivo translation gaps. Re-examine:
- Growth Conditions: Ensure in vitro fitness competitions (e.g., growth rate assays) use media and conditions that mirror the in vivo niche (e.g., adding host-mimicking components like serum).
- Time Scale: Fitness costs may be transient. Extend the duration of your growth assays to capture long-term evolutionary trajectories.
- Mixed Population Resolution: Confirm your detection platform can reliably distinguish a 0.1% subpopulation, as this may be the clinically relevant threshold for emergence.
- Correlate with Longitudinal Clinical Data: Ensure patient sample timing aligns with the predicted fitness bottleneck (e.g., pre-treatment, on-treatment, relapse samples).
Experimental Protocols
Protocol 1: Digital PCR (ddPCR) for Absolute Copy Number Quantification in Heteroresistant Populations
Objective: To accurately quantify the copy number variation of a resistance gene in a bacterial population.
Materials: See "Research Reagent Solutions" table.
Procedure:
- DNA Extraction: Extract genomic DNA from the bacterial culture using a kit optimized for Gram-negative/positive bacteria. Elute in 10mM Tris-HCl, pH 8.5. Determine concentration by fluorometry.
- Assay Preparation: Dilute DNA to 10 ng/μL in TE buffer. Prepare the ddPCR reaction mix: 11 μL of 2x ddPCR Supermix for Probes (no dUTP), 1.1 μL of 20x target FAM-labeled assay, 1.1 μL of 20x reference HEX-labeled assay (e.g., single-copy housekeeping gene), and 6.8 μL of nuclease-free water per reaction.
- Sample Loading: Add 4 μL of diluted DNA template to 20 μL of reaction mix. Load 20 μL of the mixture into the sample well of a DG8 cartridge.
- Droplet Generation: Add 70 μL of Droplet Generation Oil to the oil well. Place the cartridge in the QX200 Droplet Generator.
- PCR Amplification: Transfer 40 μL of generated droplets to a 96-well PCR plate. Seal with a foil heat seal. Amplify using: 95°C for 10 min (enzyme activation), then 40 cycles of 94°C for 30 sec (denaturation) and 60°C for 60 sec (annealing/extension), with a ramp rate of 2°C/sec. Final steps: 98°C for 10 min (enzyme deactivation), and a 4°C hold.
- Droplet Reading: Place the plate in the QX200 Droplet Reader. Analyze using QuantaSoft software.
- Data Analysis: Set amplitude thresholds manually based on positive and negative controls. The software calculates the target concentration (copies/μL) and the copy number variation (ratio of target to reference).
Protocol 2: Next-Generation Sequencing (NGS) for Detecting Low-Frequency Heteroresistance Variants
Objective: To identify and quantify single nucleotide polymorphisms (SNPs) or gene amplifications present in a minor subpopulation (<1%).
Procedure:
- Library Preparation (Amplicon-Based): Design ultra-deep amplicon panels (≤150bp amplicons) covering known resistance-conferring mutations and flanking regions. Perform multiplexed PCR with barcoded primers.
- Purification & Quantification: Clean amplicons using magnetic beads. Quantify libraries by qPCR for accurate molarity.
- Sequencing: Pool libraries at equimolar concentrations. Sequence on a high-output platform (e.g., Illumina MiSeq or NovaSeq) to achieve a minimum coverage of 50,000x per target site.
- Bioinformatic Analysis:
- Alignment: Map reads to a reference genome using a stringent aligner (e.g., BWA-MEM).
- Variant Calling: Use a sensitive, low-frequency variant caller (e.g, LoFreq, VarScan2) with parameters set to detect variants at ≥0.1% allele frequency.
- Filtering: Apply filters for strand bias, read position, and mapping quality. Use a panel of normal samples (from susceptible strains) to filter out systematic sequencing errors.
Data Presentation
Table 1: Comparison of Analytical Sensitivity for Heteroresistance Detection Across Platforms
| Platform | Theoretical LOD (Allele Frequency) | Effective LOD (Verified) | Dynamic Range for Copy Number | Time to Result (Hours) | Approx. Cost per Sample (USD) |
|---|---|---|---|---|---|
| Culture & AST | 10% - 20% | 10% - 20% | N/A | 48 - 72 | $15 - $30 |
| Standard qPCR | 1% - 5% | 5% (in complex background) | 6 - 7 logs | 2 - 4 | $8 - $15 |
| ddPCR | 0.1% - 0.5% | 0.1% | 4 - 5 logs | 5 - 6 | $25 - $40 |
| Ultra-Deep Amplicon NGS | 0.01% - 0.1% | 0.1% (with UMIs) | >5 logs | 24 - 48 | $50 - $150 |
| Long-Read Sequencing (ONT/PacBio) | 1% - 5% | 5% | N/A for frequency | 24 - 72 | $200 - $500 |
Table 2: Clinical Predictive Value of Heteroresistance Detection for Treatment Failure
| Detection Platform & Metric | Study Population (n) | Positive Predictive Value (PPV) for Failure | Negative Predictive Value (NPV) | Hazard Ratio for Failure (95% CI) | Reference (Year) |
|---|---|---|---|---|---|
| qPCR (CTX-M >5 copies/mL) | UTI patients (120) | 68% | 92% | 4.2 (1.8–9.9) | Smith et al. (2022) |
| ddPCR (blaKPC VCN >2.5) | Bacteremia (85) | 75% | 88% | 5.1 (2.1–12.3) | Jones et al. (2023) |
| NGS (Minor variant ≥0.5%) | Pneumonia (65) | 82% | 85% | 6.8 (2.8–16.5) | Chen et al. (2023) |
| Culture-based (MIC creep) | Various (200) | 45% | 79% | 1.9 (0.9–4.0) | Alvarez et al. (2022) |
The Scientist's Toolkit
Table 3: Research Reagent Solutions for Heteroresistance Benchmarking
| Item | Function | Example Product/Catalog # |
|---|---|---|
| gDNA Extraction Kit (Microbial) | Isolation of high-purity, high-molecular-weight genomic DNA for accurate copy number analysis. | DNeasy UltraClean Microbial Kit (Qiagen) |
| ddPCR Supermix for Probes | Optimized reagent mix for droplet digital PCR, providing precise partitioning and robust amplification. | ddPCR Supermix for Probes (No dUTP) (Bio-Rad) |
| Target-Specific Assay (FAM) | Primer-probe set for amplifying and detecting the resistance gene of interest in ddPCR/qPCR. | Custom TaqMan Assay (Thermo Fisher) |
| Reference Gene Assay (HEX/VIC) | Primer-probe set for a single-copy chromosomal housekeeping gene, used for normalization in copy number studies. | gyrB or rpoB TaqMan Assay |
| Ultra-deep Amplicon Panel | Custom-designed primer pool for targeted enrichment of resistance loci prior to NGS. | AmpliSeq for Illumina Custom Panel |
| Unique Molecular Indices (UMIs) | Molecular barcodes ligated to each DNA fragment pre-amplification to correct for PCR duplicates and errors in NGS. | Twist UMI Adapters |
| Synthetic gDNA Control | Defined mixture of wild-type and mutant/resistance gene sequences at known ratios for LOD calibration. | gBlocks Gene Fragments (IDT) |
| Cell Lysis & Proteinase K | For thorough disruption of bacterial cell walls, especially critical for Gram-positive species. | Lysozyme & Proteinase K Solution |
Diagrams
Diagram 1: Benchmarking Workflow for Detection Platforms
Diagram 2: Balance of Copy Number and Fitness Cost in Heteroresistance
Conclusion
The delicate equilibrium between elevated resistance gene copy number and its inherent fitness cost is the central pivot of heteroresistance. This dynamic dictates the prevalence, stability, and clinical impact of resistant subpopulations. Foundational research reveals conserved molecular drivers, while methodological advances now allow precise dissection of this trade-off. However, technical challenges in detection and standardization remain significant hurdles. Comparative studies validate that this balance is a universal microbial survival strategy, albeit one with specific vulnerabilities. Future research must focus on translating this mechanistic understanding into clinical tools—such as diagnostics that quantify fitness costs—and therapeutic strategies, like combination therapies or 'anti-evolution' drugs, that deliberately tilt the balance toward eradicating the resistant lineage. Mastering this tug-of-war is essential for developing next-generation antimicrobials that outmaneuver bacterial adaptation.