Unlocking Marinisomatota: Metabolic Strategies, Functional Diversity, and Biotechnological Potential in Ocean Ecosystems
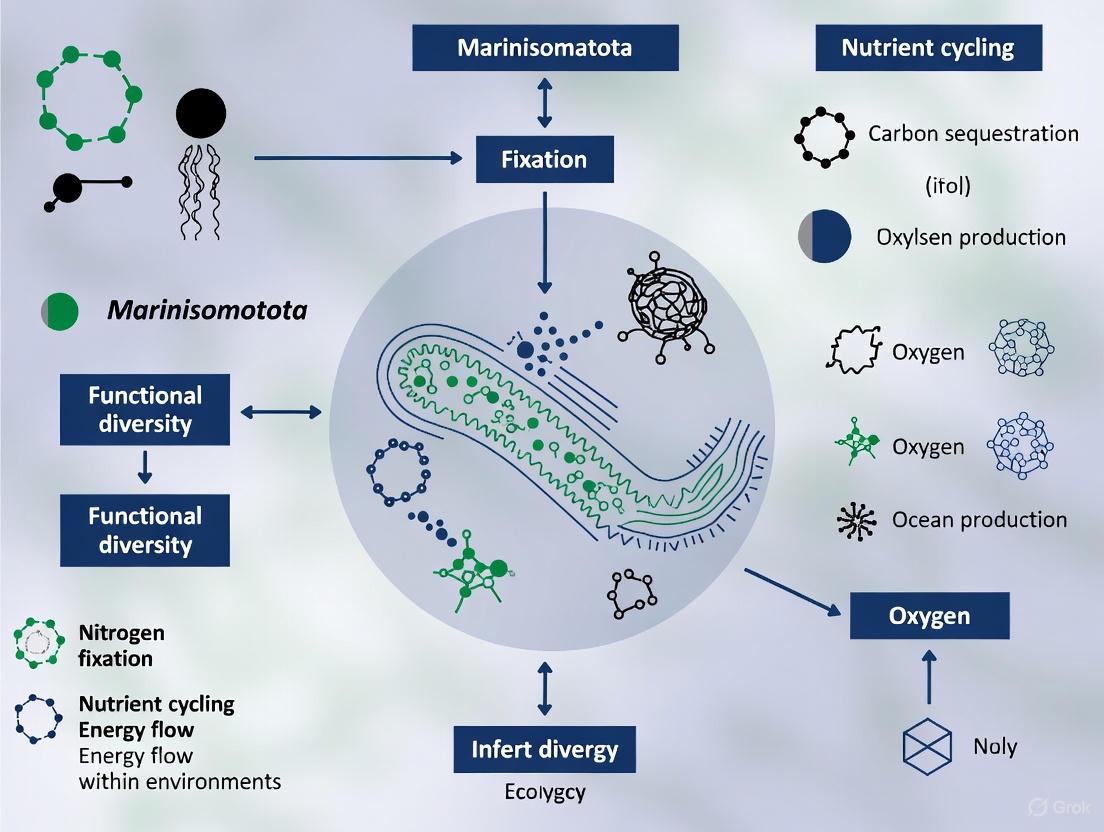
Marinisomatota (formerly Marinimicrobia or SAR406) are ubiquitous and abundant marine bacteria whose ecological roles and metabolic versatility are only beginning to be understood.
Unlocking Marinisomatota: Metabolic Strategies, Functional Diversity, and Biotechnological Potential in Ocean Ecosystems
Abstract
Marinisomatota (formerly Marinimicrobia or SAR406) are ubiquitous and abundant marine bacteria whose ecological roles and metabolic versatility are only beginning to be understood. This article synthesizes recent groundbreaking research on Marinisomatota, exploring their widespread distribution across global oceans and the discovery of three distinct metabolic strategies—photoautotrophic potential (MS0), heterotrophic with glycolysis (MS1), and heterotrophic without glycolysis (MS2)—that reveal a capacity for mixotrophy. We delve into the methodologies enabling the cultivation and genomic analysis of these previously uncultured microbes, address challenges in functional characterization, and compare their ecological niches with other marine phyla. For researchers and drug development professionals, this review highlights how the unique functional diversity of Marinisomatota, including their adaptations to nutrient limitation and potential for novel compound production, positions them as a promising resource for future biotechnological and biomedical applications.
Who Are the Marinisomatota? Unveiling the Ecology and Evolutionary History of a Widespread Marine Phylum
The reclassification of the widespread marine bacterial group previously known as Marinimicrobia, Marine Group A, and SAR406 to Marinisomatota represents a significant advancement in microbial taxonomy and ecology. This phylum-level rename reflects a substantial refinement in our understanding of its phylogenetic positioning and functional diversity within global ocean ecosystems. Marinisomatota are ubiquitous and abundant in marine environments, traditionally characterized as heterotrophic microorganisms [1] [2]. However, recent genomic investigations have revealed unexpected metabolic versatility, including light-dependent metabolic capabilities, that challenges previous ecological assumptions about this group [2].
This taxonomic clarification emerged from large-scale genomic analyses and the application of standardized classification systems such as the Genome Taxonomy Database (GTDB), which have revolutionized our ability to categorize previously unclassified marine microbial diversity [3] [4]. The reclassification to Marinisomatota provides a unified framework for studying this phylum's ecological role, particularly its contribution to carbon cycling across diverse oceanic provinces from surface waters to deep-sea sediments [1] [5]. Within the context of marine microbial ecosystem functioning, understanding the true taxonomic boundaries and metabolic capabilities of Marinisomatota is crucial for accurately modeling their contributions to global biogeochemical cycles.
Taxonomic History and Genomic Resolution
The Path to Reclassification
The journey to reclassification began with the initial discovery of these organisms through 16S rRNA gene sequencing from marine environments, where they were designated under multiple names including Marinimicrobia, Marine Group A, and SAR406 [1] [2]. These provisional labels persisted for decades despite growing evidence of their phylogenetic coherence, primarily due to the challenges of cultivating these organisms in laboratory settings [3]. The turning point came with advances in metagenome-assembled genome (MAG) technologies that enabled researchers to reconstruct genomes directly from environmental samples without cultivation [6] [4].
The application of the candidate taxonomic unit (CTU) circumscription system along with standardized nomenclature finally provided the objective framework needed to properly delineate this phylum [3]. This approach, coupled with phylogenomic analyses using concatenated marker proteins, revealed that the previously used names referred to the same monophyletic lineage, necessitating the unified taxonomic designation Marinisomatota [1] [2]. This reclassification exemplifies how genomic approaches are resolving long-standing ambiguities in microbial taxonomy, particularly for environmentally abundant but uncultivated lineages [3] [4].
Current Taxonomic Structure
Comprehensive genomic surveys have elucidated the detailed taxonomic architecture within the Marinisomatota phylum. Through analysis of 1,588 Marinisomatota genomes retrieved from global ocean datasets, researchers have defined a structured hierarchy within this group [1] [2]:
Table: Taxonomic Classification of Marinisomatota Based on Genomic Analysis
| Taxonomic Rank | Diversity | Notable Groups |
|---|---|---|
| Phylum | Marinisomatota | Formerly Marinimicrobia, Marine Group A, SAR406 |
| Class | 1 | Not specified |
| Orders | 2 | Not specified |
| Families | 14 | S15-B10, TCS55, UBA1611, UBA2128, UBA8226 |
| Genera | 31 | Diverse lineages |
| Species | 67 | Multiple uncultivated species |
This taxonomic framework reveals substantial diversity within Marinisomatota, with members predominantly found in low-latitude marine regions where their relative abundances range from 0.18% to as high as 36.21% of the microbial community [1] [2]. The identification of 14 families provides a structured system for investigating the functional specialization and niche partitioning within this phylum.
Ecological Distribution and Biogeography
Marinisomatota demonstrate a remarkably broad distribution across marine ecosystems, from surface waters to deep-sea sediments [1] [5]. Their prevalence in the translucent zone and their presence across the transition to aphotic layers suggests adaptive strategies for coping with varying light regimes and nutrient availability [2]. Global mapping efforts using 16S rRNA gene surveys and metagenomic profiling have confirmed their cosmopolitan distribution across oceanic provinces, with distinct biogeographic patterns emerging relative to environmental parameters [3].
Notably, Marinisomatota are particularly abundant in low-latitude marine regions, though they maintain presence across diverse oceanic zones including polar environments [1] [4]. In hadal sediment ecosystems, such as the Mariana Trench, related groups show extraordinary novelty, with homogeneous selection and dispersal limitation emerging as dominant ecological drivers [7]. This pattern suggests that environmental filtering plays a crucial role in structuring Marinisomatota communities, with distinct evolutionary paths developing in isolated deep-sea environments compared to more connected surface waters.
The abundance and distribution of Marinisomatota position them as significant contributors to marine biogeochemical cycles. Their genomic capacity for diverse metabolic functions enables them to occupy multiple trophic levels, from primary production to organic matter degradation [2] [5]. This functional flexibility likely underpins their ecological success across the varied physicochemical gradients of the global ocean.
Metabolic Strategies and Functional Diversity
Marinisomatota exhibit remarkable metabolic plasticity, with genomic evidence supporting three distinct trophic strategies [2]:
Table: Metabolic Strategies Identified in Marinisomatota
| Metabolic Strategy | Functional Characteristics | Ecological Niche |
|---|---|---|
| MS0 | Photoautotrophic potential with Crassulacean acid metabolism (M00169) | Translucent zone, transitioning to aphotic layers |
| MS1 | Heterotrophic with pronounced glycolytic pathway | Organic-rich regions, participating in carbon cycling |
| MS2 | Heterotrophic without glycolysis | Nutrient-limited regions, alternative energy acquisition |
This metabolic diversity challenges the traditional characterization of Marinisomatota as strictly heterotrophic and reveals a continuum of trophic strategies that likely represents adaptive responses to nutrient limitations and light availability in different oceanic provinces [2]. Among the 14 identified families, five (S15-B10, TCS55, UBA1611, UBA2128, and UBA8226) exhibit genetic potential for light-dependent processes associated with Crassulacean acid metabolism, suggesting previously unrecognized phototrophic capabilities [1] [2].
Macromolecule Degradation Capabilities
Beyond their metabolic versatility in energy acquisition, Marinisomatota play significant roles in the marine carbon cycle through their capacity to degrade complex organic matter. Genomic analyses reveal extensive repertoires of carbohydrate-active enzymes (CAZymes), with some MAGs containing up to 35 different glycoside hydrolases often in multiple copies, along with seven extracellular CAZymes, six polysaccharide lyases, and multiple sugar transporters [5].
This enzymatic machinery enables certain Marinisomatota lineages to degrade a broad spectrum of polysaccharides including chitin, cellulose, pectin, alginate, chondroitin, and carrageenan [5]. This metabolic capacity positions them as key participants in the breakdown of abundant necromass macromolecules in marine sediments, coupling organic matter remineralization with nutrient cycling [5]. The variation in genomic capacity for macromolecule degradation among different Marinisomatota lineages suggests niche specialization, with some populations specializing in particular substrate classes while others maintain broader metabolic capabilities.
Research Methodologies and Experimental Approaches
Genomic Reconstruction and Analysis
The investigation of Marinisomatota has relied heavily on culture-independent approaches due to the historical challenges in cultivating these organisms. Standard methodologies for genomic reconstruction and analysis include:
- Metagenomic Assembly: Recovery of genomes directly from environmental sequences using tools such as MEGAHIT, MetaSPAdes, or IDBA-UD, followed by binning approaches including MaxBin, MetaBAT, and CONCOCT [6] [4].
- Genome Quality Assessment: Evaluation of MAG completeness and contamination using CheckM or similar tools, with medium-quality thresholds typically set at >50% completeness and <10% contamination [6].
- Phylogenomic Analysis: Construction of phylogenetic trees using concatenated marker gene sets (37-56 proteins) with maximum likelihood methods implemented in RAxML or IQ-TREE [6].
- Taxonomic Classification: Assignment using GTDB-Tk against the Genome Taxonomy Database, which has been instrumental in standardizing taxonomic placement across studies [1] [4].
- Metabolic Reconstruction: Prediction of metabolic pathways and functional capabilities through tools such as METABOLIC, KEGG, and EggNOG, complemented by manual curation of key pathways [2] [5].
These approaches have enabled the reconstruction of 1,588 Marinisomatota genomes from global ocean datasets, providing the comprehensive genomic foundation upon which current understanding of this phylum is built [1] [2].
Experimental Validation of Metabolic Capabilities
While cultivation remains challenging, innovative enrichment approaches have enabled experimental validation of Marinisomatota metabolic functions:
- Macromolecule Amendment Studies: Sediment samples are amended with specific macromolecules (proteins, polysaccharides, nucleic acids, or lipids) under different redox conditions to stimulate growth of specialized degraders [5].
- Metatranscriptomic Profiling: RNA sequencing from environmental samples or enrichments to identify actively expressed genes and pathways under in situ conditions [2].
- Geochemical Monitoring: Coupling genomic approaches with measurements of process rates, such as hydrogen production from fermentation or sulfate reduction, to link genetic potential with biogeochemical function [5].
These experimental approaches have been crucial for moving beyond genomic predictions to demonstrate the actual ecological roles of Marinisomatota in marine ecosystems.
Table: Key Research Reagents and Resources for Marinisomatota Studies
| Resource Category | Specific Tools/Reagents | Function/Application |
|---|---|---|
| Reference Databases | SILVA SSU Ref, GTDB, KEGG, METABOLIC | Taxonomic classification, functional annotation, and metabolic pathway prediction |
| Bioinformatic Tools | GTDB-Tk, CheckM, METABOLIC, anvi'o | Genome quality assessment, phylogenetic placement, metabolic profiling |
| Enrichment Substrates | Polysaccharides (chitin, cellulose, carrageenan), proteins, lipids | Selective cultivation and metabolic capability testing |
| Sequence Analysis | Fastp, CD-HIT, DIAMOND, RAxML | Data preprocessing, clustering, homology search, phylogenetic reconstruction |
| Visualization Platforms | anvi'o, iTOL, Graphviz | Data integration, tree visualization, workflow illustration |
These resources have been instrumental in advancing our understanding of Marinisomatota biology, enabling researchers to overcome the challenges posed by their uncultivability and revealing their unexpected metabolic complexity and ecological significance.
The reclassification from Marinimicrobia/SAR406 to Marinisomatota represents more than just a taxonomic revision—it signifies a fundamental shift in our understanding of this phylum's ecological and functional significance in ocean ecosystems. The recognition of their metabolic versatility, including both heterotrophic and phototrophic capabilities, positions Marinisomatota as key players in marine carbon cycling with adaptations that enable them to thrive across diverse oceanic niches.
Future research directions should focus on overcoming the cultivation barriers that have limited physiological studies of Marinisomatota. Innovative cultivation approaches, such as diffusion-based chambers and targeted enrichment strategies, may finally enable laboratory-based investigation of their metabolic capabilities and regulatory mechanisms [8]. Additionally, single-cell genomic approaches coupled with metatranscriptomic and metaproteomic analyses under in situ conditions will provide deeper insights into their active metabolic roles in different ocean provinces.
As genomic databases continue to expand and analytical methods improve, further refinement of the Marinisomatota taxonomy is expected, potentially revealing additional diversity and functional specialization within this phylum. Understanding the evolutionary drivers behind their metabolic plasticity and the ecological implications of their mixotrophic strategies will be crucial for accurately modeling their contributions to ocean biogeochemistry and ecosystem functioning in a changing global climate.
The phylum Marinisomatota represents a group of uncultured bacteria whose ecological role in marine systems remains largely enigmatic. Framed within a broader thesis on functional diversity, this technical guide synthesizes current knowledge on Marinisomatota's biogeography and postulated functions. Genomic evidence suggests that a core set of microbial taxa, potentially including lineages like Marinisomatota, is crucial for ocean ecosystem functioning [9]. Their distribution and abundance patterns are tied to global biogeochemical cycles, and understanding their functional diversity is key to predicting ocean responses to environmental change.
Functional Diversity and Genomic Traits of Marine Microbiota
The functional capacity of a microbial community can be effectively proxied by analyzing its genomic content. One established method uses Clusters of Orthologous Groups functional categories (COG-FCs) to describe genomic contents, allowing for quantitative comparisons across diverse microbial lineages [10].
Quantitative Partitioning of Functional Traits
Research quantifying the variance in metabolic potential explained by taxonomy reveals that, on average, 41.4% of the variation in COG-FC relative abundance is accounted for by taxonomic rank [10]. The variance contributed by each rank is summarized in Table 1.
Table 1: Variance in Metabolic Potential Explained by Taxonomic Rank [10]
| Taxonomic Rank | Percentage of Variance Explained |
|---|---|
| Domain | 3.2% |
| Phylum | 14.6% |
| Class | 4.1% |
| Order | 9.2% |
| Family | 4.8% |
| Genus | 5.5% |
Relevance for Marinisomatota
Although specific COG-FC data for Marinisomatota is not yet available in the searched literature, this phylum is identified as one of 26 phyla represented in a broad genomic analysis, comprised entirely of uncultured lineages [10]. The aforementioned quantitative framework provides a methodology for future research to place Marinisomatota within a functional context across the bacterial tree of life. The strong phylogenetic signal in functional traits suggests that the metabolic capabilities of Marinisomatota can be inferred through its taxonomic placement.
Biogeographic Patterns of Core Marine Microbiota
Long-term time-series studies are critical for identifying core marine microbiota and understanding their dynamics.
Defining the Core Microbiota
In a decade-long study of a Mediterranean coastal site, the core microbiota was stringently defined based on both persistence and strong species associations. Core members were present in >30% of monthly samples over 10 years and possessed the strongest associations within the community network [9]. This interconnected core was relatively small, comprising 259 Operational Taxonomic Units (OTUs) with 1,411 strong associations, most of which (~95%) were positive [9].
Seasonal Dynamics and Community Interaction
The core microbiota exhibits predictable seasonal succession. In the Mediterranean observatory, the richness and abundance of core OTUs increased in colder, mixed waters and decreased in stratified, warmer waters [9]. Winter communities featured subnetworks with the highest connectivity, with groups of highly associated taxa showing a preference for the same season [9]. This suggests that potential microbial interactions are more deterministic in winter than in other seasons. Furthermore, hub species with high connectivity were identified, indicating their potential keystone ecological roles [9].
Table 2: Characteristics of a Core Marine Microbiota from a 10-Year Study [9]
| Characteristic | Description |
|---|---|
| Definition | Present in >30% of monthly samples over 10 years & having the strongest associations |
| Total Core OTUs | 259 (182 Bacteria, 77 Protists) |
| Total Strong Associations | 1,411 |
| Nature of Associations | ~95% Positive |
| Seasonal Preference of Most Core OTUs | Mostly Winter |
| Season with Highest Network Connectivity | Winter |
Methodologies for Biogeographic and Functional Analysis
Experimental Protocol: Long-Term Time-Series Analysis
This protocol outlines the steps for identifying and characterizing an interconnected core microbiota, as applied in a 10-year marine coastal study [9].
- Sample Collection: Seawater samples are collected regularly (e.g., monthly) from a fixed observatory site over an extended period.
- Size Fractionation and DNA Extraction: Water is sequentially filtered through membranes to capture different organismal size fractions (e.g., 0.2-3 μm for pico-plankton, 3-20 μm for nano-plankton). DNA is extracted from the filters.
- Amplicon Sequencing: For community composition, the 16S rRNA gene (for bacteria and archaea) and the 18S rRNA gene (for protists) are amplified and sequenced using high-throughput sequencing platforms.
- Bioinformatic Processing:
- Sequence Denoising: Raw sequences are processed into Amplicon Sequence Variants (ASVs) to achieve high resolution.
- Taxonomic Classification: ASVs are assigned taxonomy against reference databases (e.g., SILVA, PR2).
- Defining Resident and Core Microbiota:
- Resident OTUs: Filter OTUs present in more than a defined threshold (e.g., 30%) of all temporal samples.
- Core Microbiota: Subject resident OTUs to network analysis and define the core as those with the strongest associations.
- Network Analysis:
- Association Inference: Calculate robust correlations (e.g., using SparCC) between the relative abundances of all resident OTUs to infer potential interactions.
- Network Construction and Analysis: Build an association network where nodes are OTUs and edges represent significant correlations. Analyze network topology to identify hub taxa and modules (highly interconnected groups).
- Statistical Integration: Relate community turnover and core network dynamics to measured environmental parameters (e.g., temperature, nutrients, chlorophyll-a).
The following workflow diagram illustrates the key steps in this protocol:
Protocol: Quantifying Function-Taxonomy Relationships
This methodology details the approach for quantifying how microbial functional traits are partitioned across taxonomic ranks [10].
- Genome Database Curation: Compile a large set of high-quality microbial genomes from diverse public databases (e.g., RefSeq, IMG/M, GenBank).
- Taxonomic Assignment: Assign a consistent taxonomy to all genomes using a standardized system like the Genome Taxonomy Database (GTDB).
- Functional Annotation:
- Predict open reading frames (ORFs) from all genomes.
- Annotate ORFs by assigning them to Clusters of Orthologous Groups (COGs).
- Categorize COGs into functional categories (COG-FCs).
- Data Matrix Construction: Create a matrix where rows are genomes, columns are COG-FCs, and values are the relative abundances of each COG-FC within a genome.
- Variance Partitioning Analysis: Perform statistical analysis (e.g., hierarchical PERMANOVA) to quantify the proportion of variance in the COG-FC matrix explained by each taxonomic rank (domain to genus).
The workflow for this analysis is structured as follows:
The Scientist's Toolkit: Research Reagent Solutions
Table 3: Essential Materials for Marine Microbiome Biogeography Studies
| Research Reagent / Material | Function |
|---|---|
| Polycarbonate Membrane Filters (e.g., 0.2µm, 3µm, 20µm pore sizes) | Sequential size-fractionation of microbial plankton communities from seawater samples prior to DNA extraction [9]. |
| DNA Extraction Kits (e.g., DNeasy PowerWater Kit) | Isolation of high-quality, inhibitor-free genomic DNA from environmental water filters for downstream molecular applications [9]. |
| PCR Reagents (e.g., high-fidelity DNA polymerase, dNTPs) | Amplification of phylogenetic marker genes (16S and 18S rRNA) with minimal error for preparation of amplicon sequencing libraries [9]. |
| Clusters of Orthologous Groups (COGs) Database | A comprehensive database of orthologous protein groups used for functional annotation of predicted genes from genomic or metagenomic data [10]. |
| SparCC (Sparse Correlations for Compositional data) Algorithm | A statistical tool designed to infer robust correlation networks from compositional data (like 16S/18S amplicon or metagenomic data), mitigating spurious correlations [9]. |
The global biogeography of marine microbes is characterized by structured patterns of abundance and function. The phylum Marinisomatota, while currently underexplored, exists within this structured ecological context. Evidence from other microbial groups shows that functional traits are strongly linked to phylogeny and that a core, interconnected microbiota persists over time, driving essential ecosystem functions. The experimental and analytical frameworks outlined here provide a pathway for future research to decrypt the specific functional role of Marinisomatota and its contribution to the vast functional diversity of the global ocean.
Marinisomatota (formerly recognized as Marinimicrobia, Marine Group A, and SAR406) represent a ubiquitous and abundant microbial lineage in global oceans, playing critical yet poorly understood roles in marine biogeochemical cycles. Recent genomic investigations have revealed that this phylum exhibits remarkable metabolic plasticity, allowing it to colonize diverse marine habitats from surface waters to the deep sea. This whitepaper delineates three distinct metabolic strategies—MS0 (photoautotrophic potential), MS1 (heterotrophic with pronounced glycolytic pathway), and MS2 (heterotrophic without glycolysis)—identified through comprehensive analysis of metagenomic and metatranscriptomic data. Within the context of marine ecosystem functioning, understanding these strategies provides crucial insights into how microbial communities adapt to nutrient limitations and contribute to carbon processing in the world's oceans, with potential applications in biotechnology and drug discovery.
Marinisomatota represents one of the most abundant and widespread bacterial phyla in global marine environments, found from surface waters to hadal sediments with relative abundances ranging from 0.18% to 36.21% across different oceanic provinces [2]. Traditionally characterized as heterotrophic microorganisms, recent discoveries have revealed unexpected metabolic capabilities that challenge this simplistic classification. The phylum encompasses tremendous diversity, with recent studies identifying 1,588 Marinisomatota genomes representing one class, two orders, 14 families, 31 genera, and 67 species [2].
These microorganisms are predominantly distributed in low-latitude marine regions and exhibit distinct depth stratification patterns, with certain families showing preferences for specific oceanic layers including the oxygen minimum zones (OMZs) and bathypelagic waters [2] [11]. Genomic analyses of Marinisomatota populations in the northeastern Indian Ocean revealed their significant presence in OMZ and bathypelagic layers, where they potentially contribute to carbon cycling under hypoxic conditions [11]. Their distribution patterns and metabolic capabilities position Marinisomatota as key players in marine ecosystem functioning, particularly in the context of nutrient scavenging and energy transduction across redox gradients.
The identification of three core metabolic strategies (MS0, MS1, MS2) within this phylum represents a significant advancement in understanding how microbial communities maintain functional diversity in response to environmental constraints. These strategies emerge as evolutionary adaptations to nutrient limitations prevalent in vast oceanic regions, enabling Marinisomatota to exploit various ecological niches through specialized metabolic configurations [2].
The Three Core Metabolic Strategies
Genomic analyses of globally distributed Marinisomatota populations have revealed three distinct metabolic strategies characterized by specific genetic compositions and functional capabilities. These strategies represent adaptations to different ecological niches and nutrient availability conditions in the marine environment.
Table 1: Core Characteristics of Marinisomatota Metabolic Strategies
| Metabolic Strategy | Trophic Mode | Key Genetic Features | Environmental Preference | Ecological Role |
|---|---|---|---|---|
| MS0 | Photoautotrophic potential | Genes for Crassulacean acid metabolism (M00169) | Translucent zone, transitioning between translucent and aphotic layers | Light-dependent carbon fixation, organic compound synthesis |
| MS1 | Heterotrophic with pronounced glycolytic pathway | Complete or enhanced glycolytic pathway | Regions with available organic matter | Efficient processing of organic carbon through glycolysis |
| MS2 | Heterotrophic without glycolysis | Lacks glycolytic pathway | Nutrient-limited environments | Alternative carbon processing pathways |
MS0: Photoautotrophic Potential
The MS0 strategy represents a remarkable departure from the traditionally heterotrophic lifestyle attributed to Marinisomatota. This strategy is characterized by the genetic potential for light-dependent processes associated with Crassulacean acid metabolism (CAM) [2]. Specifically, five Marinisomatota families (S15-B10, TCS55, UBA1611, UBA2128, and UBA8226) possess the genetic machinery necessary for this metabolic strategy, enabling them to potentially harness light energy for carbon dioxide fixation and synthesis of organic compounds [2].
This photoautotrophic capability allows MS0 strategists to thrive in the translucent zone and transition areas between light-rich and aphotic layers, where they can leverage both light energy and organic carbon sources. The presence of this metabolic strategy in a bacterial phylum previously considered exclusively heterotrophic underscores the metabolic versatility of Marinisomatota and challenges traditional classification schemes in marine microbiology. The CAM-like pathways suggest potential adaptations to diurnal cycling or fluctuating energy availability in the water column.
MS1: Heterotrophic with Pronounced Glycolytic Pathway
The MS1 strategy represents a specialized heterotrophic lifestyle characterized by a pronounced and efficient glycolytic pathway for carbon processing [2]. Organisms employing this strategy possess complete or enhanced glycolytic capabilities, allowing them to efficiently catabolize organic carbon sources through Embden-Meyerhof-Parnas or related glycolytic pathways.
This metabolic configuration is particularly advantageous in marine environments with moderate to high availability of organic substrates, where efficient glycolytic processing can provide competitive advantages. The MS1 strategists likely play significant roles in the processing of dissolved organic matter in the water column, contributing to carbon cycling in mesopelagic and bathypelagic zones where Marinisomatota are frequently abundant [11].
MS2: Heterotrophic without Glycolysis
The MS2 strategy represents an alternative heterotrophic approach that operates without conventional glycolytic pathways [2]. This strategy suggests the presence of alternative carbon processing mechanisms that bypass classical glycolysis, potentially including Entner-Doudoroff pathways, pentose phosphate pathways, or other novel carbohydrate degradation routes.
This metabolic configuration may provide advantages in nutrient-limited environments where conventional glycolytic substrates are scarce or where alternative pathways offer thermodynamic or kinetic benefits under specific environmental conditions. The presence of this strategy highlights the metabolic innovation within the Marinisomatota phylum and underscores the potential for novel biochemical pathways in marine microbial communities.
Research Methodologies and Experimental Protocols
Genomic and Metatranscriptomic Analysis
The identification and characterization of Marinisomatota metabolic strategies rely heavily on integrated omics approaches. The experimental workflow typically involves sample collection across environmental gradients, nucleic acid extraction, sequencing, and computational analysis.
Table 2: Key Methodological Approaches for Studying Marinisomatota Metabolic Strategies
| Method Category | Specific Techniques | Application in Marinisomatota Research |
|---|---|---|
| Sample Collection | CTD rosette sampling, filtration | Depth-resolved sampling from surface to bathypelagic zones |
| DNA/RNA Extraction | Phenol-chloroform-isoamyl alcohol method | Recovery of high-quality nucleic acids from filters |
| Sequencing | Illumina HiSeq platforms, 16S rDNA amplicon sequencing, metagenomic sequencing | Assessment of community structure and functional potential |
| Genome Reconstruction | Metagenome-assembled genomes (MAGs) binning and refinement | Recovery of population genomes from complex communities |
| Functional Annotation | KEGG Orthology (KO) groups, pathway analysis (e.g., M00169 for CAM) | Determination of metabolic capabilities and strategy classification |
The specific protocol for investigating Marinisomatota diversity and metabolic potential involves several critical steps [11]:
Sample Collection and Processing: Seawater samples are collected from various depths (surface, Deep Chlorophyll Maximum (DCM), Oxygen Minimum Zone (OMZ), and bathypelagic layers) using CTD rosette systems. Samples are typically pre-filtered through 20 μm nylon mesh to exclude larger organisms, followed by concentration onto 0.22 μm pore size polycarbonate filters.
DNA Extraction and Sequencing: Microbial DNA is extracted using the phenol-chloroform-isoamyl alcohol method. For community structure analysis, the V4-V5 hypervariable regions of the 16S rRNA gene are amplified using universal primer pairs (515Y/926R) and sequenced on Illumina platforms. For metagenomic analysis, qualified DNA samples are fragmented and subjected to shotgun sequencing.
Metagenome-Assembled Genome (MAG) Construction: Sequencing reads are assembled into contigs, followed by binning to reconstruct individual genomes. MAGs are refined using criteria including completeness ≥50% and contamination ≤10%, with high-quality MAGs defined as those with completeness >90% and contamination <5%.
Metabolic Pathway Analysis: Recovered MAGs are functionally annotated using databases such as KEGG and MetaCyc. Specific metabolic capabilities are assessed through identification of key marker genes and pathways, such as those involved Crassulacean acid metabolism (M00169) for MS0 strategists or glycolytic pathways for MS1 strategists.
Stable Isotope Resolved Metabolomics for Functional Validation
While genomic approaches predict metabolic potential, stable isotope resolved metabolomics (SIRM) can experimentally validate metabolic activities [12]. The Ion Chromatography-Ultrahigh Resolution-MS1/Data Independent-MS2 (IC-UHR-MS1/DI-MS2) method provides powerful capabilities for tracking the transformations of individual tracer atoms from precursors to products [12]. This approach enables determination of tracer atom position(s) in metabolite moieties with higher resolution and sensitivity than NMR methods.
The experimental protocol for SIRM analysis involves [12]:
Tracer Incubation: incubation of environmental samples or enrichment cultures with stable isotope-labeled substrates (e.g., [13C6]-glucose, [13C5,15N2]-glutamine).
Metabolite Extraction: Rapid quenching of metabolism followed by organic solvent-based extraction using methods such as methanol/chloroform/water extraction for comprehensive coverage of polar and non-polar metabolites.
IC-UHR-MS1/DI-MS2 Analysis: Separation using ion chromatography coupled to ultrahigh resolution mass spectrometry, enabling resolution of minute mass differences (e.g., Δmass = 0.006995 amu between 13C and 15N).
Data Interpretation: Isotopologue distributions are calculated from peak area ratios after natural abundance correction, providing insights into metabolic pathway activities.
Figure 1: Experimental Workflow for Marinisomatota Metabolic Strategy Classification
Ecological Drivers and Functional Significance
The emergence of three distinct metabolic strategies within Marinisomatota populations represents adaptive responses to environmental heterogeneity and nutrient limitations in marine ecosystems [2]. The distribution of these strategies follows clear biogeographic patterns influenced by factors such as light availability, dissolved oxygen concentrations, and organic matter quality.
In the global ocean, microbial communities are shaped by complex ecological processes including homogeneous selection (HoS) and dispersal limitation (DL) [7]. Analysis of hadal zone sediments revealed that homogeneous selection (accounting for 50.5% of community assembly) favors streamlined genomes with key functions for environmental adaptation, while dispersal limitation (43.8%) promotes versatile metabolism with larger genomes [7]. These evolutionary pressures likely contribute to the diversification of metabolic strategies observed in Marinisomatota.
The functional significance of this metabolic diversification extends to broader ecosystem processes. Marine zooplankton, particularly copepods, exhibit functional diversity patterns that influence carbon export efficiency [13]. Similarly, the metabolic strategies of microorganisms like Marinisomatota likely contribute to carbon processing and export in the oceans. Climate change is projected to promote trait homogenization in marine communities, which may reduce biomass and carbon export efficiency globally [13]. Understanding the metabolic versatility of key bacterial groups like Marinisomatota therefore becomes crucial for predicting ecosystem responses to environmental change.
Figure 2: Ecological Drivers and Functional Significance of Metabolic Diversification
The Scientist's Toolkit: Essential Research Reagents and Materials
Successful investigation of Marinisomatota metabolic strategies requires specific reagents, instruments, and computational tools. The following table summarizes essential components of the methodological toolkit.
Table 3: Research Reagent Solutions for Marinisomatota Metabolic Studies
| Category | Specific Item | Function/Application | Example from Literature |
|---|---|---|---|
| Sampling Equipment | CTD rosette systems with Niskin bottles | Depth-resolved seawater collection | SBE-911 Plus CTD profiler [11] |
| Filtration Materials | 20 μm nylon mesh, 0.22 μm polycarbonate filters | Microbial biomass concentration | Sefar Nitex mesh, Millipore filters [11] |
| Nucleic Acid Extraction | Phenol-chloroform-isoamyl alcohol | DNA/RNA extraction from environmental samples | Standard molecular biology reagents [11] |
| Sequencing Reagents | Illumina sequencing kits, 16S rRNA primers (515Y/926R) | Library preparation and amplification | Illumina HiSeq 2500 chemistry [11] |
| Stable Isotope Tracers | [13C6]-glucose, [13C5,15N2]-glutamine | Metabolic pathway tracing in SIRM | 13C-labeled substrates [12] |
| Metabolite Extraction Solvents | Methanol, chloroform, water | Biphasic extraction of polar and non-polar metabolites | MeOH/CHCl3/H2O extraction [14] |
| Computational Tools | Metagenomic assembly software (e.g., Met4DX) | 4D peak detection in metabolomics | Met4DX for LC-IM-MS data [15] |
| Bioinformatics Databases | KEGG, MetaCyc, HMDB, GTDB | Functional annotation and taxonomic classification | Genome Taxonomy Database (GTDB) [11] |
Advanced computational tools have become increasingly important for analyzing complex metabolomics data. For example, Met4DX provides an end-to-end computational framework for peak detection, quantification and identification of metabolites in ion mobility-resolved untargeted metabolomics [15]. This tool employs a mass spectrum-oriented bottom-up assembly algorithm that significantly improves peak detection coverage and sensitivity, enabling researchers to detect and differentiate co-eluted metabolite isomers with small differences in chromatographic and ion mobility dimensions [15].
For metabolite annotation, two-layer interactive networking approaches such as MetDNA3 integrate data-driven and knowledge-driven networks to enhance annotation coverage and accuracy [16]. This strategy uses a comprehensive metabolic reaction network curated using graph neural network-based prediction of reaction relationships, enabling annotation of over 1,600 seed metabolites with chemical standards and more than 12,000 putatively annotated metabolites through network-based propagation [16].
The identification of three core metabolic strategies (MS0, MS1, MS2) within the Marinisomatota phylum represents a significant advancement in understanding functional diversity in marine microbial ecosystems. These strategies reflect adaptive responses to environmental heterogeneity and nutrient limitations prevalent in global oceans. The photoautotrophic potential of MS0 strategists, the efficient heterotrophy of MS1, and the alternative carbon processing of MS2 collectively contribute to the ecological success of Marinisomatota across diverse marine habitats.
Future research should focus on several critical directions. First, experimental validation of predicted metabolic capabilities through cultivation-based studies and stable isotope probing approaches will be essential to confirm the functional significance of these genetic potentials. Second, investigation of how these metabolic strategies respond to environmental changes, including ocean warming, deoxygenation, and acidification, will improve predictive models of ecosystem functioning. Third, exploration of the biotechnological potential of novel enzymes and pathways identified in Marinisomatota genomes may yield valuable tools for industrial applications and drug discovery.
The integration of advanced analytical techniques, including ion mobility-mass spectrometry and network-based metabolite annotation, with traditional microbial ecology approaches will continue to reveal novel aspects of microbial metabolic versatility. As these methodologies advance, our understanding of the complex relationships between microbial functional diversity and ecosystem processes in the oceans will continue to deepen, potentially revealing new fundamental principles governing life in marine environments.
Mixotrophy as a Survival Strategy in Nutrient-Limited Oceans
Mixotrophy, the combination of autotrophic and heterotrophic modes of nutrition in a single organism, represents a fundamental survival strategy that challenges the traditional dichotomy between producers and consumers in marine ecosystems. In the nutrient-impoverished waters of the oligotrophic ocean, which constitute the majority of the marine environment, mixotrophy provides a critical adaptive advantage that enables microbial communities to overcome limitations of both inorganic nutrients and organic carbon [17]. This metabolic flexibility is particularly relevant in the context of global ocean warming and increased stratification, which are expected to further expand nutrient-limited regions. The ecological significance of mixotrophy extends from cellular physiology to global biogeochemical cycles, influencing carbon export, trophic transfer efficiency, and nutrient regeneration [18] [19].
Within this framework, the phylum Marinisomatota (formerly known as Marinimicrobia, Marine Group A, and SAR406) exemplifies how metabolic versatility enables colonization of diverse marine habitats. Traditionally characterized as heterotrophic microorganisms, recent evidence reveals that certain Marinisomatota lineages possess genetic capabilities for light-dependent metabolic processes, blurring the boundaries between nutritional modes [2] [20]. This physiological plasticity allows them to thrive in the transitional zones between sunlit and dark ocean layers, where resources are often patchy and unpredictable. The study of Marinisomatota thus provides a model system for understanding the evolutionary drivers and ecological consequences of mixotrophy in the world's oceans.
Theoretical Foundations: Why Mixotrophy Succeeds in Nutrient-Limited Systems
Resource Colimitation and Metabolic Synergy
The ecological success of mixotrophic organisms in nutrient-limited systems can be attributed to their ability to simultaneously address multiple resource constraints that would limit specialists. In the classic paradigm of marine ecology, autotrophic phytoplankton are limited by inorganic nutrients (e.g., nitrogen, phosphorus, iron), while heterotrophic zooplankton are constrained by carbon-based energy derived from prey [17]. Mixotrophs overcome these parallel limitations through synergistic integration of both nutritional pathways.
Table 1: Comparative Limitations of Different Trophic Strategies in Oligotrophic Oceans
| Trophic Strategy | Primary Limitation | Metabolic Constraint | Competitive Environment |
|---|---|---|---|
| Strict Autotrophy | Inorganic nutrients | Inability to access nutrient reserves in prey | Outcompeted for nutrients by smaller, more efficient cells |
| Strict Heterotrophy | Organic carbon/energy | Respiratory carbon losses | Prey quantity and quality limitations |
| Mixotrophy | Balanced supply of multiple resources | Metabolic maintenance costs | Advantageous under dual nutrient and carbon limitation |
Theoretical models demonstrate that mixotrophy is particularly favored when the entire microbial community is colimited by both nutrients and carbon, rather than by nutrients alone [17]. In such scenarios, the benefits of combining trophic strategies become greater than the sum of their parts. Phototrophy helps mixotrophs compensate for respiratory carbon losses experienced by strict heterotrophs, while phagotrophy or osmotrophy provides access to nutrient pools that are unavailable to strict phototrophs. This synergistic advantage allows mixotrophs to thrive in the stratified oligotrophic gyres, where an extremely limited supply of nutrients to the euphotic zone is rapidly sequestered by highly competitive bacterioplankton [17] [21].
Ecological Advantages Across Environmental Gradients
Empirical data reveal that mixotrophic nanoflagellates achieve their highest relative abundances in two contrasting marine environments: the brightly lit but nutrient-impoverished subtropical oceans and the more productive waters of coastal regions [17]. This bimodal distribution reflects the flexible ecological advantages of mixotrophy across different resource regimes. In oligotrophic waters, mixotrophs dominate because they can access nutrient reserves contained in bacterial prey while maintaining photosynthetic capability. In more productive coastal systems, where dissolved nutrients are more abundant relative to prey, mixotrophs gain an advantage over specialist heterotrophs through their ability to supplement their nutrition with photosynthesis [21].
Global ecosystem models that incorporate mixotrophy predict significant impacts on marine food webs and biogeochemical cycles. Compared to models with strict trophic separation, mixotrophic simulations show an approximately threefold increase in global mean organism size and a ∼35% increase in sinking carbon flux [18]. This occurs because mixotrophy enhances trophic transfer efficiency, allowing more energy and biomass to reach larger size classes further up the food chain. The resulting shift toward larger plankton communities increases the production of larger, faster-sinking, and carbon-enriched organic detritus, thereby enhancing the efficiency of the biological carbon pump [18] [19].
Marinisomatota: A Model for Understanding Mixotrophic Adaptations
Genomic and Metabolic Diversity
Recent comprehensive analysis of Marinisomatota has revealed extraordinary diversity within this phylum, with 1,588 metagenome-assembled genomes representing 1 class, 2 orders, 14 families, 31 genera, and 67 species [2] [20]. These organisms are predominantly found in low-latitude marine regions, with relative abundances ranging from 0.18% to 36.21% of microbial communities, highlighting their ecological significance in tropical and subtropical oceans where nutrient limitation is most severe [2].
Detailed genomic analysis has identified three distinct metabolic strategies within the Marinisomatota phylum:
MS0 (Photoautotrophic Potential): These lineages possess genetic capabilities for light-dependent processes associated with Crassulacean acid metabolism (M00169), potentially enabling them to fix carbon dioxide and synthesize organic compounds using light energy [2] [20]. This strategy was particularly identified in the families S15-B10, TCS55, UBA1611, UBA2128, and UBA8226.
MS1 (Heterotrophic with Pronounced Glycolytic Pathway): These heterotrophic Marinisomatota maintain an active glycolytic pathway for carbon processing, suggesting adaptation to environments with higher availability of dissolved organic matter.
MS2 (Heterotrophic without Glycolysis): These strictly heterotrophic lineages lack significant glycolytic capability, potentially relying on alternative carbon processing pathways or specialized substrate utilization.
Table 2: Metabolic Strategies Identified in Marinisomatota and Their Environmental Distribution
| Metabolic Strategy | Trophic Mode | Key Genetic Features | Environmental Preference |
|---|---|---|---|
| MS0 | Mixotrophic (Photoautotrophic potential) | Genes for Crassulacean acid metabolism (M00169) | Transition zones between translucent and aphotic layers |
| MS1 | Heterotrophic | Pronounced glycolytic pathway | Environments with higher dissolved organic carbon |
| MS2 | Heterotrophic | Limited glycolytic capability | Specialized niches with specific organic substrates |
The emergence of these distinct metabolic strategies likely represents evolutionary adaptations to the patchy and unpredictable distribution of nutrients in the oceanic water column. The presence of phototrophic capabilities in multiple families suggests that light harnessing provides a significant selective advantage in the deep chlorophyll maximum and other dimly lit but nutrient-rich microenvironments [2].
Ecological Distribution and Niche Partitioning
Marinisomatota exhibit a distinctive vertical distribution pattern that reflects their metabolic diversity. They are particularly abundant in the translucent zone or in transition areas between the translucent and aphotic layers, where light is sufficient to drive phototrophic processes but where nutrient concentrations often exceed those in surface waters [2]. This distribution enables them to exploit gradients of both light and nutrient availability, potentially using phototrophic metabolism to supplement heterotrophic nutrition when prey are scarce or of poor quality.
The coexistence of multiple Marinisomatota lineages with different metabolic strategies suggests extensive niche partitioning within this phylum. The mosaic distribution of resources in the water column, including spatial and temporal variation in light intensity, dissolved organic matter quality and quantity, and prey availability, likely supports this metabolic diversity by creating multiple distinct niches [2]. This ecological specialization may enhance the overall resilience of Marinisomatota communities to environmental variability and change, as different lineages are optimized for different conditions.
Methodologies for Studying Mixotrophy in Marine Microbes
Genomic and Transcriptomic Approaches
Cutting-edge research on mixotrophic microorganisms relies on integrated multi-omics approaches that combine metagenomic, metatranscriptomic, and sometimes metaproteomic methodologies. The recent study of Marinisomatota involved analysis of metagenomic and metatranscriptomic data sourced from global open oceans [2] [20], following a comprehensive workflow:
Figure 1: Integrated multi-omics workflow for studying mixotrophic microbes. Gold nodes highlight sequencing steps critical for genomic and transcriptomic analysis.
This methodology enables researchers to not only identify the metabolic potential encoded in microbial genomes but also to understand which metabolic pathways are actively expressed under different environmental conditions. For Marinisomatota, this approach revealed that the genetic capacity for light-dependent metabolism was actually transcribed in specific lineages, providing stronger evidence for mixotrophic capabilities [2].
Stable Isotope and Physiological Methods
Complementary to omics approaches, stable isotope techniques provide critical insights into the relative contributions of autotrophic and heterotrophic nutrition to mixotroph growth and metabolism. A study on coral symbionts (which function as mixotrophic associations) employed carbon and nitrogen stable isotope analysis to quantify nutritional sources [22]. The experimental protocol typically involves:
- Sample Collection: Field collection of target organisms and potential nutritional sources (e.g., plankton, particulate organic matter).
- Isotopic Enrichment: In some cases, incubation with
^13C-bicarbonate (to track carbon fixation) or^15N-labeled compounds (to track nitrogen uptake). - Isotope Ratio Mass Spectrometry: Precise measurement of isotopic composition in sample tissues.
- Bayesian Mixing Models: Statistical analysis to determine the proportional contributions of different nutritional sources.
This methodology revealed that corals with different symbiotic algae (Cladocopium vs. Durusdinium) exhibited distinct trophic strategies and nutritional plasticity, with seasonal shifts in the relative dependence on autotrophy versus heterotrophy [22]. Similar approaches could be applied to free-living mixotrophic microbes like Marinisomatota to quantify their actual reliance on phototrophic versus heterotrophic nutrition across environmental gradients.
Research Reagent Solutions for Mixotrophy Studies
Table 3: Essential Research Reagents and Methodologies for Investigating Microbial Mixotrophy
| Reagent/Methodology | Application | Specific Function | Example Use Case |
|---|---|---|---|
| Metagenomic Sequencing Kits | Genome-resolved metagenomics | Recovering metagenome-assembled genomes (MAGs) | Reconstruction of 1,588 Marinisomatota genomes from global ocean samples [2] |
| Metatranscriptomic Library Prep | Gene expression analysis | Profiling actively transcribed metabolic genes | Identifying expressed Crassulacean acid metabolism pathways in Marinisomatota [2] [20] |
| Stable Isotope Tracers (^13C, ^15N) | Trophic pathway tracing | Quantifying elemental fluxes from specific sources | Tracking nutrient transfer in Synechococcus-heterotroph co-cultures [23] |
| qPCR Reagents | Absolute quantification | Measuring abundance of specific taxonomic groups | Quantifying PdC vs. PdD coral symbiont abundances [22] |
| CHEMSTAT Continuous Cultivation | Nutrient limitation studies | Maintaining steady-state nutrient conditions | Investigating phosphorus limitation effects on Crocosphaera [24] |
Ecological Implications and Global Significance
Impacts on Carbon Export and Nutrient Cycling
The widespread distribution of mixotrophic organisms like Marinisomatota has profound implications for global biogeochemical cycles. Model simulations indicate that mixotrophy enhances the transfer of biomass to larger size classes further up the food chain, leading to significant increases in mean organism size and sinking carbon flux [18]. This occurs because mixotrophs can maintain higher growth efficiencies than strict heterotrophs by using photosynthesis to supplement their energy needs, reducing respiratory carbon losses. The resulting shift toward larger plankton communities enhances carbon export efficiency, as larger particles sink more rapidly and are less susceptible to remineralization in surface waters [18] [19].
In addition to impacts on the biological carbon pump, mixotrophy influences the cycling of limiting nutrients such as nitrogen, phosphorus, and iron. By accessing nutrient pools contained in bacterial prey, mixotrophs can short-circuit the conventional nutrient regeneration pathways that involve multiple trophic transfers. This more direct nutrient recycling pathway potentially enhances nutrient use efficiency in oligotrophic ecosystems, allowing primary production to be maintained despite severely limited external nutrient inputs [17] [19]. The presence of nitrogen fixation capabilities in some heterotrophic bacteria associated with photosynthetic microbes [23] further illustrates how mixotrophic associations can influence nutrient cycling in the ocean.
Responses to Environmental Change
Mixotrophic organisms may be particularly well-positioned to respond to ongoing environmental changes such as ocean warming, acidification, and deoxygenation. Their trophic flexibility provides a buffer against environmental variability that specialists lack, potentially enhancing ecosystem resilience to disturbance. However, the responses are likely to be complex and taxon-specific. Research on single-celled nitrogen-fixing cyanobacteria (Crocosphaera) has demonstrated that the effects of ocean acidification are modulated by iron and phosphorus limitation [24], with negative impacts exacerbated under iron-limited conditions but attenuated under phosphorus limitation.
Figure 2: Conceptual framework of mixotrophic responses to environmental change. Gold nodes highlight key adaptive strategies, while red indicates potential physiological impacts.
The diverse metabolic strategies observed in Marinisomatota [2] suggest that different lineages will show varying responses to environmental change. Those with more flexible metabolic capabilities (e.g., MS0-type strategies) may be better able to acclimate to changing conditions than those with more specialized metabolisms (e.g., MS2-type strategies). This intraphylum diversity could enhance the resilience of Marinisomatota as a group to environmental changes, as different lineages are likely to respond differently, ensuring that some representatives persist under virtually all future scenarios.
The study of mixotrophy in nutrient-limited oceans has evolved from documenting curiosities that defy simple classification to recognizing a fundamental ecological strategy that shapes marine ecosystem structure and function. Marinisomatota, with their diverse metabolic strategies and widespread distribution, exemplify how trophic flexibility enables colonization of the vast oligotrophic regions of the ocean. Their genomic capacity for both phototrophic and heterotrophic metabolism represents an adaptive solution to the dual challenges of carbon and nutrient limitation that characterize these environments.
Future research on mixotrophy should focus on quantifying the in situ metabolic activity of different mixotrophic strategies across environmental gradients, understanding the evolutionary drivers of mixotrophy in diverse lineages, and incorporating realistic representations of mixotrophy into global biogeochemical models. As ocean habitats continue to change under human pressure, understanding the ecological role of mixotrophic organisms will be essential for predicting the future of marine ecosystems and their capacity to sustain critical ecosystem services including carbon sequestration and fisheries production.
Marinisomatota (formerly known as Marinimicrobia, Marine Group A, and SAR406) represents a phylogenetically diverse and metabolically versatile phylum that is ubiquitous and abundant in global ocean ecosystems. This in-depth technical guide synthesizes recent metagenomic and metatranscriptomic findings which have identified a comprehensive taxonomic framework for this phylum, encompassing 1,588 genomes representing 14 families and 67 species [2]. We detail the experimental protocols enabling these discoveries and present quantitative analyses of their ecological distribution, with relative abundances ranging from 0.18% to 36.21% across low-latitude marine regions [2]. The functional diversity of Marinisomatota is exemplified by three distinct metabolic strategies—photoautotrophic potential (MS0), heterotrophic with enhanced glycolytic capacity (MS1), and heterotrophic without glycolysis (MS2)—which represent adaptations to nutrient limitations in oceanic ecosystems [8] [2]. This systematic classification and functional characterization provides researchers with a foundational framework for exploring the biotechnological potential of this ecologically significant bacterial phylum.
Marinisomatota represents one of the most widespread yet enigmatic bacterial phyla in marine environments, traditionally characterized as heterotrophic microorganisms with limited cultivability. Recent advances in genome-resolved metagenomics have dramatically expanded our understanding of their phylogenetic diversity and ecological significance. The current taxonomic framework, derived from analysis of global ocean metagenomic datasets, positions Marinisomatota within a structured hierarchy comprising one class, two orders, 14 families, 31 genera, and 67 species [2]. This classification system provides researchers with a standardized nomenclature for comparing functional traits across phylogenetic boundaries and investigating evolutionary relationships within this metabolically versatile phylum.
The ecological distribution of Marinisomatota exhibits distinct biogeographic patterns, with predominance in low-latitude marine regions where they can achieve remarkable relative abundances ranging from 0.18% to 36.21% of microbial communities [2]. Among the 14 identified families, five—S15-B10, TCS55, UBA1611, UBA2128, and UBA8226—demonstrate particular ecological success and possess genetic potential for light-dependent processes associated with Crassulacean acid metabolism (M00169) [2]. This strategic distribution across oceanic provinces suggests specialized niche adaptation driven by both phylogenetic history and environmental parameters, positioning Marinisomatota as significant contributors to marine biogeochemical cycling.
Methodological Approaches for Marinisomatota Research
Genome-Resolved Metagenomics Workflow
The reconstruction of Marinisomatota genomes from complex environmental samples requires sophisticated metagenomic approaches that overcome the limitations of traditional cultivation techniques. The following workflow outlines the primary methodology used to establish the current phylogenetic framework encompassing 14 families and 67 species:
Table 1: Metagenomic Assembly and Binning Parameters for Marinisomatota Genome Reconstruction
| Processing Step | Tools/Platforms | Key Parameters | Quality Metrics |
|---|---|---|---|
| Sequence Assembly | MEGAHIT, metaSPAdes | k-mer sizes: 21-121; min contig length: 1000 bp | N50 > 10 kbp; complete single-copy genes |
| Genome Binning | MetaBAT2, MaxBin2, CONCOCT | minimum bin completeness: >50%; maximum contamination: <10% | CheckM completeness >70%; contamination <5% |
| Taxonomic Classification | GTDB-Tk, CheckM | reference database: GTDB r89; phylogenetic markers: 120+ bacterial proteins | ANI <95% for species distinction; AAI for genus assignment |
| Functional Annotation | PROKKA, EggNOG | COG categories; KEGG pathways; Pfam domains | >70% coding density; tRNA genes for all amino acids |
The integrated workflow begins with quality filtering of raw metagenomic reads followed by co-assembly of multiple samples to enhance recovery of low-abundance populations. Subsequent binning strategies employ complementary algorithms to maximize genome completeness while minimizing contamination, with particular attention to distinguishing Marinisomatota from phylogenetically similar groups. The taxonomic classification leverages the Genome Taxonomy Database (GTDB) framework, which provides standardized taxonomic ranks based on relative evolutionary divergence rather than phenotypic traits, ensuring consistent phylogenetic placement across studies [10]. This approach has enabled the reconstruction of 1,588 Marinisomatota genomes from global ocean datasets, forming the foundation for the current phylogenetic framework of 14 families and 67 species [2].
Metabolic Reconstruction and Functional Prediction
Functional characterization of Marinisomatota employs complementary omics approaches to elucidate the metabolic potential encoded within their genomes. Metabolic pathways are reconstructed through integrated annotation pipelines that identify key enzymes and transport systems within each genome:
Pathway Identification: The presence of complete metabolic pathways is determined through hidden Markov model searches against curated profile databases (KEGG, MetaCyc) with manual validation of key catalytic steps.
Gene Cluster Analysis: Biosynthetic gene clusters are identified using antiSMASH with strict cutoff thresholds (E-value <1e-10, coverage >60%) to minimize false positives in secondary metabolite prediction.
Transport Capability Assessment: Transporter profiling employs the Transporter Classification Database (TCDB) with additional validation through identification of adjacent substrate-binding proteins and energy-coupling mechanisms.
Metatranscriptomic analysis complements these genomic predictions by quantifying expression levels of key metabolic genes across environmental gradients. RNA extraction from environmental samples requires specialized stabilization protocols (RNAlater or immediate flash-freezing at -80°C) to preserve labile transcripts from low-biomass environments. Library preparation typically employs ribosomal RNA depletion followed by strand-specific sequencing to enable differentiation of sense and antisense transcription. The integration of genomic potential with transcriptional activity provides a comprehensive framework for elucidating the functional diversity of Marinisomatota across its phylogenetic spectrum.
Quantitative Analysis of Marinisomatota Diversity
Comprehensive analysis of global metagenomic datasets has enabled systematic quantification of Marinisomatota phylogenetic diversity and distribution patterns. The taxonomic richness across different hierarchical levels reveals a phylum with substantial diversification, particularly at the family and species levels:
Table 2: Taxonomic Diversity of Marinisomatota Across Phylogenetic Ranks
| Taxonomic Rank | Number of Taxa | Genomic Representatives | Notable Features |
|---|---|---|---|
| Phylum | 1 | 1,588 genomes | Formerly Marinimicrobia, Marine Group A, SAR406 |
| Class | 1 | 1,588 genomes | Unified classification based on GTDB |
| Order | 2 | Distribution varies by order | Distinct ecological preferences observed |
| Family | 14 | 5 families with photoautotrophic potential | S15-B10, TCS55, UBA1611, UBA2128, UBA8226 |
| Genus | 31 | Varying from 1 to >100 genomes per genus | Different metabolic strategies by genus |
| Species | 67 | Defined by <95% ANI | Specialization to specific oceanic provinces |
The ecological distribution of Marinisomatota reveals distinct biogeographic patterns influenced by both environmental factors and phylogenetic history. Abundance profiles across global sampling sites demonstrate:
Latitudinal Gradient: Highest relative abundances occur in low-latitude regions (0.18-36.21%), with pronounced dominance in oligotrophic gyres where they can constitute over one-third of microbial communities [2].
Depth Stratification: Distinct phylogenetic lineages partition between epipelagic, mesopelagic, and bathypelagic zones, with specific families exhibiting adaptations to light regimes (e.g., epipelagic families with phototrophic potential) [2] [25].
Provincial Endemism: Despite their global distribution, certain species show restricted distributions aligned with specific water masses, suggesting limited dispersal or specialized adaptation to particular physicochemical conditions [4].
The functional profiling of Marinisomatota genomes reveals substantial conservation of metabolic traits within phylogenetic groups, with an average of 41.4% of variation in Clusters of Orthologous Groups functional categories (COG-FCs) explained by taxonomic rank [10]. This phylogenetic signal in functional capacity demonstrates the interplay between evolutionary history and metabolic specialization in shaping the ecological roles of distinct Marinisomatota lineages.
Metabolic Strategies and Functional Diversity
Marinisomatota exhibits remarkable metabolic versatility, employing distinct strategies to overcome nutrient limitations in oceanic ecosystems. Genomic analysis has identified three primary metabolic modes within the phylum:
MS0 (Photoautotrophic Potential): These lineages possess proteorhodopsin-based light-harvesting systems and potential for Crassulacean acid metabolism, enabling them to harness light energy for carbon fixation in the photic zone [2].
MS1 (Heterotrophic with Enhanced Glycolytic Capacity): Characterized by complete glycolytic pathways and specialized substrate acquisition systems, these organisms excel at processing complex organic matter in mesopelagic regions [2].
MS2 (Heterotrophic without Glycolysis): Lacking complete glycolytic pathways, these lineages rely on alternative carbon processing mechanisms and are often dominant in deep ocean habitats where labile organic matter is scarce [2].
The distribution of these metabolic strategies across the Marinisomatota phylogeny demonstrates a clear evolutionary adaptation to oceanic nutrient gradients. The emergence of mixotrophic capabilities in specific lineages represents a strategic response to the fluctuating resource availability characteristic of marine environments, particularly in oligotrophic regions where light and organic carbon sources may be seasonally variable.
Figure 1: Evolutionary adaptation of Marinisomatota metabolic strategies in response to environmental factors, leading to three distinct metabolic modes (MS0, MS1, MS2) as specialized adaptations to nutrient limitations in oceanic ecosystems [2].
The functional coupling between metabolic potential and environmental distribution is mediated by specialized genetic adaptations. Genomic analyses have identified key enzyme systems that differentiate the metabolic strategies:
MS0 Lineages: Encode proteorhodopsin complexes, carbon concentration mechanisms, and Crassulacean acid metabolism enzymes that facilitate light-driven energy generation and carbon fixation [2].
MS1 Lineages: Possess complete glycolytic pathways (pfk, pyk genes), diverse TonB-dependent transporters for substrate acquisition, and extracellular enzymes for complex organic matter degradation [8] [2].
MS2 Lineages: Feature alternative energy conservation systems including partial glycolysis, specialized fermentative capabilities, and expanded repertoires of oxidoreductases for utilizing recalcitrant organic compounds [2].
This metabolic diversification enables Marinisomatota to occupy distinct ecological niches across the water column, with different phylogenetic lineages dominating specific depth zones and oceanic provinces according to their specialized capabilities.
Research Reagent Solutions for Marinisomatota Studies
Investigating the phylogenetic and functional diversity of Marinisomatota requires specialized research reagents and methodologies optimized for studying uncultivated microbial lineages. The following table details essential solutions for experimental work in this field:
Table 3: Essential Research Reagents and Methodologies for Marinisomatota Studies
| Reagent/Methodology | Specific Application | Function in Research | Example Implementation |
|---|---|---|---|
| Low-Nutrient Media | Cultivation attempts | Mimics oligotrophic marine conditions | Modified SWM, AMC media with 1-10 mg/L organic carbon [8] |
| Diffusion Chambers | In situ cultivation | Allows nutrient exchange with natural environment | Ahmad et al. method for uncultured bacteria [8] |
| Metagenomic Kits | DNA extraction from filters | High-yield, high-molecular-weight DNA | PowerWater DNA Isolation Kit; 0.1-0.2 µm filters |
| Single-Cell Genomics | Genome amplification | Bypasses cultivation requirements | Multiple Displacement Amplification (MDA) with phi29 polymerase |
| GTDB Database | Taxonomic classification | Standardized phylogenetic framework | GTDB-Tk with r214 reference data [10] [4] |
| antiSMASH | BGC prediction | Identifies secondary metabolite potential | antiSMASH 7.0 with strict cutoff settings [26] |
| COG Databases | Functional annotation | Metabolic pathway reconstruction | eggNOG-mapper with COG categories [10] |
The application of these specialized reagents and methodologies has been instrumental in overcoming the historical challenges associated with studying Marinisomatota. Particularly critical are the low-nutrient cultivation approaches that simulate the oligotrophic conditions of their native habitats, enabling limited success in laboratory isolation of previously uncultured representatives [8]. For the majority of lineages that remain recalcitrant to cultivation, single-cell genomics and metagenome-assembled genomes provide alternative paths to genomic characterization without the need for laboratory growth.
Bioinformatic resources form another essential component of the Marinisomatota research toolkit, with standardized databases and analysis pipelines enabling consistent phylogenetic placement and functional prediction across studies. The Genome Taxonomy Database (GTDB) provides a phylogenetically consistent framework for taxonomic classification, while functional databases like COG and KEGG enable comparative analysis of metabolic potential across the phylogenetic diversity of the phylum [10] [4]. The integration of these wet-lab and computational approaches has been essential for reconstructing the comprehensive phylogenetic framework of 14 families and 67 species that defines our current understanding of Marinisomatota diversity.
Implications for Ocean Ecosystem Research
The phylogenetic and functional characterization of Marinisomatota has profound implications for understanding marine microbial ecology and biogeochemical cycling. As abundant members of ocean microbial communities, reaching up to 36.21% relative abundance in specific provinces, these organisms significantly influence carbon and energy fluxes through marine ecosystems [2]. Their metabolic versatility enables them to participate in multiple trophic levels, serving as both primary producers through light-driven metabolism and as consumers of organic matter across diverse oceanic provinces.
The distinct biogeographic distribution of Marinisomatota lineages aligns with specific oceanographic features, suggesting their potential as biological indicators of water mass history and ecosystem status. The prevalence of specific families in low-latitude regions and their stratification across depth gradients reflects adaptive responses to physical and chemical parameters that structure microbial communities globally [4] [2]. This phylogenetic patterning provides a framework for predicting microbial community responses to environmental change, particularly in the context of expanding oligotrophic regions due to global warming.
Furthermore, the recently revealed metabolic capabilities of Marinisomatota reshape our understanding of carbon cycling in the deep ocean. The discovery of mixotrophic strategies challenges traditional dichotomies between autotrophic and heterotrophic metabolism in marine systems, revealing a more complex continuum of metabolic functions [2] [25]. This functional diversity enables Marinisomatota to occupy transitional zones between well-lit surface waters and dark ocean depths, potentially facilitating energy transfer across traditional biome boundaries and influencing the efficiency of the biological carbon pump.
The comprehensive phylogenetic framework presented herein—spanning 14 families and 67 species—establishes Marinisomatota as a phylogenetically diverse and metabolically versatile phylum with significant roles in marine ecosystems. The integration of genomic, metatranscriptomic, and ecological data reveals a phylum characterized by specialized adaptations to oceanic nutrient gradients, with distinct metabolic strategies emerging as evolutionary innovations to overcome resource limitation. This systematic classification provides an essential foundation for future investigations aiming to elucidate the precise biogeochemical contributions of specific Marinisomatota lineages and their responses to environmental change. The methodological advances detailed in this guide will enable researchers to further explore the functional significance of this diverse phylum, potentially unlocking novel biotechnological applications and enhancing predictive models of ocean ecosystem functioning in a changing global climate.
From Uncultured to Understood: Advanced Genomic and Cultivation Techniques for Marinisomatota Research
Leveraging Metagenomics and Metatranscriptomics from Global Ocean Datasets
The exploration of ocean microbial life has been revolutionized by the advent of genomic technologies. Metagenomics (the study of genetic material recovered directly from environmental samples) and metatranscriptomics (which analyzes the expressed RNA within those samples) have transformed our understanding of marine ecosystems by bypassing the limitations of traditional culturing methods [27] [28]. These approaches provide an unprecedented window into the taxonomic composition and functional capabilities of marine microbial communities, enabling researchers to decipher their roles in global biogeochemical cycles, adaptive strategies, and biotechnological potential.
The global ocean represents the planet's largest ecosystem, hosting an estimated 10²⁹ bacterial and archaeal cells that underpin essential ecological processes and biogeochemical fluxes [4]. Landmark projects such as the Global Ocean Sampling expedition and the Tara Oceans Expedition have dramatically expanded our inventory of oceanic microbial diversity, leading to massive genomic datasets that capture variations across latitude, depth, and environmental gradients [4]. These initiatives have illuminated the stunning diversity of marine microbes while simultaneously creating new opportunities for discovering novel enzymes, antimicrobial compounds, and metabolic pathways with biomedical and industrial relevance.
This technical guide examines current methodologies, analytical frameworks, and applications of metagenomics and metatranscriptomics in marine microbial research, with particular emphasis on the functional diversity of understudied phyla such as Marinisomatota. We provide a comprehensive resource for researchers seeking to leverage global ocean datasets to advance understanding of microbial ecology, evolution, and bioprospecting.
Methodological Framework: From Sampling to Functional Analysis
Sample Collection and Experimental Design
Robust marine microbiome studies require careful consideration of sampling strategies across spatial and environmental gradients. Sample collection should capture the physicochemical heterogeneity of marine environments, including variations in depth, temperature, oxygen concentration, salinity, and nutrient availability [29].
- Sample Types: Seawater samples are typically collected using Niskin bottles mounted on CTD rosettes, while sediment samples require coring devices. Particulate organic matter and host-associated communities require specialized filtering or swabbing techniques [30] [29].
- Preservation Methods: Immediate preservation is critical for RNA integrity in metatranscriptomic studies. Samples should be flash-frozen in liquid nitrogen or preserved in specialized reagents such as DNA/RNA Shield to maintain nucleic acid stability [30].
- Experimental Design: Studies should incorporate sufficient replication across environmental gradients and include control samples (field blanks, extraction negatives) to account for contaminants and technical artifacts [30].
Laboratory Processing and Sequencing
Table 1: Comparison of Metagenomic and Metatranscriptomic Approaches
| Aspect | Metagenomics | Metatranscriptomics |
|---|---|---|
| Target molecule | DNA (including extracellular) | RNA (primarily mRNA) |
| Extraction challenges | Host/environmental DNA contamination | Low microbial biomass, high rRNA proportion |
| Library preparation | Fragmentation, adapter ligation | rRNA depletion, cDNA synthesis |
| Sequencing depth | ~5-20 Gb/sample (varies by diversity) | ~1-5 Gb/sample (after rRNA removal) |
| Information gained | Functional potential, taxonomic composition | Active functions, gene expression levels |
| Limitations | Does not distinguish active/inactive cells | mRNA instability, technical variability |
Laboratory workflows must be optimized for the unique challenges of marine samples, which often feature low microbial biomass and potential contamination from host or environmental DNA [30].
- Nucleic Acid Extraction: Protocols should include mechanical lysis (bead beating) to ensure disruption of diverse microbial cell walls. For metatranscriptomics, DNAse treatment is essential to remove genomic DNA contamination [30].
- RNA Enrichment: Microbial mRNA enrichment typically involves ribosomal RNA depletion using custom oligonucleotides designed against conserved bacterial and archaeal rRNA sequences. This approach can achieve 2.5-40× enrichment of non-ribosomal RNA compared to undepleted controls [30].
- Sequencing Platforms: Illumina short-read sequencing provides high accuracy for quantitative analyses, while Pacific Biosciences and Oxford Nanopore technologies offer long reads that improve genome assembly and metabolite prediction [27].
Computational Analysis and Bioinformatics
The analysis of marine omics data requires sophisticated computational pipelines to transform raw sequencing data into biological insights.
- Read Processing and Quality Control: Tools such as FastQC and MultiQC assess sequence quality, while Trimmomatic or Cutadapt remove adapter sequences and low-quality bases.
- Assembly and Binning: Metagenomic assembly using tools like metaSPAdes or MEGAHIT reconstructs genomic fragments from complex communities. Metagenome-assembled genomes (MAGs) are then binned using composition and coverage information with tools such as MetaBAT2 or MaxBin2 [4] [29].
- Taxonomic and Functional Annotation: Classification against reference databases (GTDB, SILVA) identifies taxonomic origins, while functional annotation using Pfam, KEGG, and COG databases reveals metabolic potential [4] [2].
- Metatranscriptomic Analysis: After rRNA removal and quality filtering, transcript quantification reveals differentially expressed genes and pathways under specific environmental conditions [30] [31].
Table 2: Key Research Reagent Solutions for Marine Omics Studies
| Category | Specific Products/Functions | Applications in Marine Omics |
|---|---|---|
| Sample Preservation | DNA/RNA Shield, RNAlater, Liquid Nitrogen | Maintains nucleic acid integrity during transport and storage |
| Nucleic Acid Extraction | PowerWater DNA Kit, AllPrep PowerViral Kit | Simultaneous DNA/RNA extraction from diverse sample types |
| RNA Enrichment | Illumina Ribo-Zero Plus, custom oligonucleotides | Depletion of host and bacterial ribosomal RNA |
| Library Preparation | Illumina Nextera XT, SMARTer Stranded RNA-Seq | Preparation of sequencing libraries with unique dual indexes |
| Sequencing Platforms | Illumina NovaSeq, PacBio Sequel, Oxford Nanopore | Generate short-read, long-read, or real-time sequencing data |
| Reference Databases | GTDB, SILVA, Pfam, KEGG, MEROPS | Taxonomic classification and functional annotation |
| Bioinformatic Tools | metaSPAdes, MetaBAT2, VirSorter2, HUMAnN3 | Genome assembly, binning, viral identification, pathway analysis |
Successful marine omics studies depend on specialized reagents and computational resources. For sample preservation, commercial solutions like DNA/RNA Shield effectively stabilize nucleic acids at ambient temperatures, which is particularly valuable for remote fieldwork [30]. For nucleic acid extraction, kits optimized for low-biomass environmental samples improve yield and reduce contamination. For metatranscriptomics, targeted rRNA depletion methods using custom oligonucleotides significantly enhance microbial mRNA recovery, with one study achieving 79.5% non-rRNA reads compared to undepleted controls [30].
Critical bioinformatic resources include the Genome Taxonomy Database (GTDB) for standardized taxonomic classification and specialized databases such as the integrated Human Skin Microbial Gene Catalog (iHSMGC) for host-associated studies, though marine-specific catalogs are increasingly available [4] [30]. Computational tools like VirSorter2 and DeepVirFinder employ machine learning to identify viral sequences in complex metagenomes, helping researchers explore the vast "viral dark matter" in marine ecosystems [27].
Case Study: Functional Diversity of Marinisomatota in Ocean Ecosystems
Ecological Distribution and Genomic Features
The phylum Marinisomatota (formerly known as Marinimicrobia, Marine Group A, or SAR406) represents a widespread yet poorly understood lineage of marine bacteria. Recent studies have substantially expanded our knowledge of their diversity and ecological significance through large-scale genomic analyses.
Table 3: Genomic Diversity and Metabolic Features of Marinisomatota
| Feature | Description | Ecological Significance |
|---|---|---|
| Phylogenetic diversity | 1,588 MAGs representing 1 class, 2 orders, 14 families, 31 genera, 67 species | Extensive diversification across low-latitude marine regions |
| Habitat distribution | Relative abundance 0.18-36.21%, predominantly in low-latitude regions | Key players in oceanic microbial communities, especially in stratified water columns |
| Metabolic strategies | Three distinct strategies: MS0 (photoautotrophic potential), MS1 (heterotrophic with glycolysis), MS2 (heterotrophic without glycolysis) | Adaptations to nutrient limitation through metabolic flexibility |
| Light utilization | Five families (S15-B10, TCS55, UBA1611, UBA2128, UBA8226) contain Crassulacean acid metabolism (M00169) genes | Potential for light-dependent processes in the aphotic zone |
| Carbon metabolism | Capable of degrading refractory organic matter and utilizing bicarbonate | Survival in oligotrophic conditions through diverse carbon sources |
Marinisomatota are particularly abundant in the deep chlorophyll maximum and mesopelagic zones, where they appear to play important roles in carbon cycling. Their distribution patterns reflect adaptation to specific oceanographic conditions, with different clades occupying distinct depth strata and nutrient regimes [2]. Genomic analyses reveal that Marinisomatota populations in the North Pacific Subtropical Gyre and other oligotrophic regions have evolved specialized metabolic capabilities to thrive under nutrient limitation.
Metabolic Versatility and Adaptations
Marinisomatota exhibit remarkable metabolic flexibility that enables them to occupy diverse ecological niches:
- Mixotrophic Capabilities: Certain Marinisomatota lineages possess genes for both heterotrophic metabolism and light-driven energy generation through Crassulacean acid metabolism, suggesting a mixotrophic lifestyle that combines organic carbon uptake with light-assisted energy conservation [2].
- Carbon Substrate Utilization: Genomic analyses reveal capabilities for degrading refractory organic matter, including complex polymers that resist degradation by other microbial taxa. This makes them important contributors to carbon cycling in the deep ocean [2].
- Nitrogen and Phosphorus Acquisition: Marinisomatota genomes encode diverse nutrient acquisition systems, including alkaline phosphatases for organic phosphorus utilization and transporters for various nitrogen sources, allowing them to compete effectively in nutrient-depleted waters [2].
The metabolic versatility of Marinisomatota represents an evolutionary response to the heterogeneous and often nutrient-poor conditions of the open ocean. Their genomic features illustrate how microbial taxa can optimize their metabolic networks to exploit transient nutrient pulses and maintain metabolic activity under energy limitation.
Biotechnological and Biomedical Applications
Enzyme Discovery for Environmental Biotechnology
Marine metagenomics has emerged as a powerful tool for discovering novel enzymes with industrial and environmental applications:
- Plastic-Degrading Enzymes: The Global Ocean Microbiome Catalog (GOMC) has enabled the discovery of highly active halophilic PETases capable of degrading polyethylene terephthalate (PET) plastics. These enzymes function effectively under high salinity conditions, making them suitable for bioremediation in marine environments [4].
- Xenobiotic-Degrading Enzymes: Metagenomic studies of polluted marine sediments have revealed diverse microbial communities capable of degrading pesticides, hydrocarbons, and industrial compounds through enzymes such as laccase and alkane monooxygenase [28].
- Antimicrobial Peptides: In silico bioprospecting of marine MAGs has identified ten novel antimicrobial peptides with potential therapeutic applications, demonstrating the value of marine genomic resources for drug discovery [4].
Monitoring Antibiotic Resistance in Marine Ecosystems
Marine environments represent significant reservoirs of antibiotic resistance genes (ARGs), with concerning implications for global health:
- Open Ocean as ARG Reservoir: Metagenomic analyses of the Northwest Pacific Ocean have revealed this region as both a reservoir and evolutionary hub for ARGs, including multidrug resistance determinants and clinically relevant resistance elements [32].
- Regional Variation: The Kuroshio Extension region demonstrates striking heterogeneity in ARG distribution, with frontal zones exhibiting particularly high concentrations of resistance genes, highlighting the influence of oceanographic features on ARG dissemination [32].
- Horizontal Gene Transfer Risk: Marine environments facilitate the horizontal transfer of ARGs between terrestrial and marine bacteria, with studies documenting shared resistance genes between clinical Escherichia coli isolates and marine bacteria [32].
Future Directions and Concluding Remarks
The integration of metagenomics and metatranscriptomics provides unprecedented insights into the functional diversity of marine microorganisms like Marinisomatota. However, several challenges and opportunities warrant attention in future research:
- Technical Advancements: Improvements in long-read sequencing, single-cell genomics, and metaproteomics will enhance our ability to reconstruct complete microbial genomes and link genetic potential to functional activity [27].
- Ecological Understanding: Future studies should focus on integrating multi-omics data with environmental parameters to predict microbial responses to climate change and anthropogenic impacts [2] [28].
- Biotechnological Exploration: The vast untapped diversity of marine microbes represents a rich resource for discovering novel enzymes, bioactive compounds, and metabolic pathways with industrial and biomedical applications [4] [28].
In conclusion, leveraging global ocean datasets through metagenomics and metatranscriptomics has transformed our understanding of marine microbial ecosystems. The functional diversity of groups like Marinisomatota illustrates the sophisticated metabolic strategies that enable microbial survival and success in the world's oceans. As sequencing technologies advance and analytical methods improve, these approaches will continue to reveal new insights into ocean ecology, evolution, and biotechnological potential.
Marinisomatota represents a bacterial phylum within the FCB superphylum, frequently identified in marine sediment microbiomes through culture-independent genomic techniques [33]. The ecological role of this phylum is linked to global carbon and nutrient cycling, yet its functional diversity and genomic potential remain underexplored. The reconstruction of 1,588 Metagenome-Assembled Genomes (MAGs) from this group provides an unprecedented opportunity to investigate the genomic underpinnings of its adaptive radiation and functional niche partitioning across diverse ocean ecosystems. This large-scale genome-resolved analysis is pivotal for testing the broader thesis that functional diversity within specific bacterial phyla is a key driver of ecosystem resilience and biogeochemical throughput in the oceans. By moving beyond taxonomic profiling to examine the genetic repertoire of these organisms, we can elucidate the core metabolic pathways and accessory functions that enable Marinisomatota to thrive across environmental gradients, thereby defining their contribution to oceanic functional diversity.
Methodologies for Genome-Resolved Metagenomics
The following section details the standardized, high-throughput pipeline used for reconstructing and analyzing Marinisomatota genomes from complex environmental samples.
Sample Collection and Processing
- Sample Types: Marine sediment and water column samples are primary sources. Sediment samples (0–5 cm depth) should be collected using a corer, with superficial debris gently removed to minimize contamination [34]. Water samples (typically 2–50 L, depending on biomass) require sequential filtration through 10-μm, 3-μm, and 0.22-μm polycarbonate membranes to capture particle-associated and free-living cells [34] [35].
- In-situ Physicochemical Profiling: At each sampling site, record parameters including temperature, pH, salinity, and depth using a multiparameter water quality sonde (e.g., YSI ProDSS) [34] [35]. Collect sub-samples for nutrient analysis (e.g., ammonium, nitrate, phosphate, silicate) [35].
- Preservation: Immediately freeze biomass or filters on dry ice or liquid nitrogen and store at -80°C until DNA extraction to preserve genomic integrity [34].
Metagenomic DNA Extraction, Sequencing, and Assembly
- DNA Extraction: For sediment samples, use commercial kits optimized for soil (e.g., ALFA-Soil DNA Extraction Kit). For water column biomass on filters, use kits designed for water (e.g., ALFA-SEQ Advanced Water DNA Kit) [34]. Assess DNA concentration and purity via spectrophotometry (NanoDrop) and fluorometry (Qubit).
- Library Preparation and Sequencing: Prepare Illumina short-read libraries (e.g., 150 bp paired-end) and/or PacBio HiFi long-read libraries to enhance assembly continuity. Sequence to a minimum depth of 20-50 Gbp per sample to ensure adequate coverage for rare community members [34] [33].
- Metagenome Assembly: Perform quality control and adapter trimming on raw reads (using tools like FastP or Trimmomatic). De novo assembly should be conducted using hybrid assemblers (e.g., metaSPAdes, OPERA-MS) to generate contigs [34] [33].
Binning, Refinement, and Taxonomic Classification
- Bin Reconstruction: Reconstruct MAGs from assembled contigs using composition-based (e.g., CONCOCT) and abundance-based (e.g., MaxBin2) binning algorithms. Utilize metaWRAP or DAS_Tool for bin refinement [34] [33].
- Quality Control: Assess MAG quality using CheckM2 or similar tools. Retain only medium- to high-quality MAGs based on the MIMAG standards (≥50% completeness, ≤10% contamination) [33].
- Phylogenomic Classification: Perform phylogenomic analysis to identify Marinisomatota MAGs. This involves identifying a set of 37-56 conserved, single-copy marker genes within the MAGs, aligning them, and constructing a phylogenetic tree with reference genomes from the GTDB (Genome Taxonomy Database) using tools like GTDB-Tk or custom pipelines [33]. The monophyletic clustering of target MAGs with known Marinisomatota reference genomes confirms their phylogenetic placement.
Table 1: Key Wet-Lab Reagents and Kits for Metagenomic Workflow
| Research Reagent / Kit | Primary Function |
|---|---|
| ALFA-Soil DNA Extraction Kit [34] | High-yield microbial DNA extraction from complex sediment matrices. |
| ALFA-SEQ Advanced Water DNA Kit [34] | Efficient DNA extraction from low-biomass water column filters. |
| Illumina DNA Prep Kit | Preparation of sequencing libraries for Illumina short-read platforms. |
| PacBio SMRTbell Prep Kit | Preparation of libraries for long-read, high-fidelity (HiFi) sequencing. |
| Polycarbonate Membrane Filters (0.22-3μm) [34] | Size-fractionated collection of microbial cells from water samples. |
Genomic and Functional Annotation
- Metabolic Pathway Reconstruction: Annotate MAGs using automated pipelines (e.g., PROKKA, DRAM) followed by manual curation. Identify key metabolic pathways (e.g., carbon fixation, sulfur respiration, nitrogen cycling) using KEGG and MetaCyc databases [34] [33].
- Identification of Novelty: To detect novel protein families (NPFs), compare all predicted protein sequences from MAGs against public databases (eggNOG, Pfam, RefSeq) using tools like HMMER and Diamond. Proteins with no significant homology constitute NPFs [33].
- Calculation of Functional Diversity Metrics: Map functional traits (e.g., KEGG orthologs, CAZymes) to calculate metrics such as functional richness (number of unique functions) and functional divergence (variance in abundance of traits) within the Marinisomatota population [36].
The following workflow diagram summarizes the core computational and laboratory processes for reconstructing and analyzing Marinisomatota MAGs.
Diagram 1: Workflow for Marinisomatota MAG Reconstruction and Analysis
Key Genomic Findings and Functional Diversity
The analysis of 1,588 Marinisomatota MAGs reveals extensive taxonomic novelty and functional versatility, positioning this phylum as a significant player in marine biogeochemistry.
Phylogenetic Diversity and Global Distribution
Phylogenomic analyses confirm that Marinisomatota forms a monophyletic lineage within the FCB superphylum [33]. The 1,588 MAGs likely encompass multiple novel classes, orders, and families, as a significant proportion of genomes from similar studies are phylogenetically distinct from previously described bacterial phyla [33]. Comparison of 16S rRNA genes from these MAGs with public databases demonstrates that Marinisomatota has a global distribution, with high sequence homology (>95%) to sequences retrieved from diverse habitats including coastal waters, deep-sea sediments, and hypersaline ponds [33]. This wide distribution suggests a high degree of physiological plasticity and niche adaptation.
Metabolic Versatility and Ecosystem Functioning
Metabolic reconstruction of the MAGs reveals a remarkable capacity for diverse energy generation and nutrient cycling processes, as summarized in Table 2.
Table 2: Key Metabolic Functions in Marinisomatota MAGs
| Metabolic Process | Key Genes/Pathways Identified | Inferred Ecological Role |
|---|---|---|
| Carbon Cycling | Wood-Ljungdahl pathway; diverse Glycoside Hydrolases (GHs) for polysaccharide degradation [33] | Anaerobic degradation of complex organic matter; potential for mixotrophy and carbon fixation. |
| Sulfur Respiration | Dissimilatory sulfite reductase (dsrABC) [33] | Reduction of sulfur compounds for energy generation, coupling organic matter remineralization to the sulfur cycle. |
| Nitrogen Metabolism | Genes for nitrate reduction (narGHI) and putative ammonification [33] | Involvement in the later stages of denitrification, contributing to nitrogen turnover in sediments. |
| Novel Genetic Repertoire | High proportion (~9% on average) of Novel Protein Families (NPFs) [33] | Potential for uncharacterized biochemical pathways, possibly linked to adaptation and specialized metabolisms. |
The functional diversity of a community, including the range of traits expressed by groups like Marinisomatota, is a critical component of ecosystem functioning. Studies on marine copepods have established that functional diversity metrics (e.g., functional richness, divergence) have emergent covariance with key ecosystem processes like primary production, zooplankton biomass, and carbon export efficiency [36]. This suggests that the specific traits carried by Marinisomatota, even if they are not the most abundant taxa, could disproportionately influence these broader ecosystem functions, aligning with the mass ratio hypothesis [36].
The following diagram illustrates the integrated role of Marinisomatota in marine biogeochemical cycles, based on genomic evidence.
Diagram 2: Marinisomatota's Role in Biogeochemical Cycling
The Scientist's Toolkit: Key Reagents and Computational Tools
Table 3: Essential Resources for Genome-Resolved Metagenomic Analysis
| Tool / Resource Name | Category | Primary Function in Analysis |
|---|---|---|
| metaSPAdes [33] | Computational Tool | De novo metagenomic assembly from sequencing reads into contigs. |
| CheckM2 | Computational Tool | Assesses quality (completeness/contamination) of reconstructed MAGs. |
| GTDB-Tk [33] | Computational Tool | Provides standardized taxonomic classification of MAGs against the Genome Taxonomy Database. |
| PROKKA / DRAM [33] | Computational Tool | Rapid annotation of MAGs and metabolism-centric annotation, respectively. |
| HMMER | Computational Tool | Profile hidden Markov model searches for identifying novel protein families (NPFs). |
| Polycarbonate Filter Membranes (0.22μm) [34] | Laboratory Consumable | Collection of microbial biomass from water samples for DNA extraction. |
| ALFA-Soil DNA Kit [34] | Laboratory Consumable | Extraction of high-quality metagenomic DNA from complex sediment samples. |
| Illumina & PacBio Sequencers | Instrumentation | Generation of short-read and long-read sequence data, respectively. |
The large-scale reconstruction of 1,588 Marinisomatota MAGs establishes this phylum as a widespread, metabolically versatile, and functionally diverse component of marine ecosystems. Its genomic toolkit for anaerobic carbon degradation, sulfur respiration, and nitrogen cycling, combined with a significant reservoir of novel protein families, underscores a profound capacity to influence oceanic biogeochemical fluxes. This study validates the thesis that functional diversity within specific bacterial lineages is a critical determinant of ecosystem functioning. The presented genomic resource and methodological framework pave the way for future research to culture these organisms, experimentally validate predicted metabolic pathways, and quantitatively model their contribution to carbon and nutrient cycling in a changing global ocean.
The vast majority of marine microorganisms, essential players in global biogeochemical cycles, have historically resisted cultivation in laboratory settings, earning them the designation "Microbial Dark Matter" (MDM) [37]. Current estimates suggest that >99% of marine microorganisms remain uncultured and uncharacterized, creating a significant gap in our understanding of oceanic ecosystems and their functional diversity [8]. This challenge is particularly acute for the phylum Marinisomatota (formerly Marinimicrobia, Marine Group A, and SAR406), which are ubiquitous and abundant in marine environments yet poorly characterized due to their resistance to traditional cultivation techniques [8] [38].
The inability to cultivate these microorganisms in pure culture has profound implications for understanding the functional diversity of Marinisomatota in ocean ecosystems. Without pure cultures, detailed microbiological studies—including precise metabolic characterization, validation of genomic predictions, and exploration of biotechnological potential—remain challenging [8]. This gap underscores the critical need for innovative cultivation strategies that can bridge the divide between culture-independent genomic surveys and traditional microbiological experimentation.
The Hurdle: Why Most Marine Microbes Resist Laboratory Cultivation
The pervasive uncultivability of marine microorganisms stems from multiple factors that traditional cultivation methods fail to address. The nutrient-rich media typically used in laboratories create artificially high substrate concentrations that inhibit oligotrophic specialists adapted to nutrient-scarce marine environments [37]. Furthermore, laboratory conditions cannot replicate the complex ecological interactions and syntrophic relationships that microbial communities depend on in their natural habitats, particularly for members of the Candidate Phyla Radiation (CPR) and DPANN archaea that may have symbiotic lifestyles [37].
For Marinisomatota specifically, their metabolic versatility presents unique cultivation challenges. Recent genomic analyses have revealed that Marinisomatota members exhibit three distinct metabolic modes: MS0 (photoautotrophic potential), MS1 (heterotrophic with enhanced glycolytic capacity), and MS2 (heterotrophic without glycolysis) [38]. This metabolic plasticity suggests they may transition between trophic strategies in response to fluctuating environmental conditions, a behavior difficult to replicate under static laboratory conditions [8] [38]. Additionally, their adaptation to specific oceanic niches—with distinct subpopulations dominating in different depth zones and water masses—indicates specialized environmental requirements that must be understood and replicated for successful cultivation [38].
Innovative Cultivation Methodologies
Diffusion-Based Cultivation Systems
Diffusion-based cultivation methods represent a paradigm shift from traditional axenic culture techniques by maintaining microorganisms in a more natural chemical environment while allowing controlled nutrient exchange. Ahmad et al. (2025) developed an innovative diffusion-based integrative cultivation method using modified low-nutrient media to efficiently isolate previously uncultured bacteria from marine sediments [8].
Table 1: Key Components of Diffusion-Based Cultivation Chambers
| Component | Function | Specification/Composition |
|---|---|---|
| Semi-permeable Membrane | Allows diffusion of nutrients and signaling molecules while protecting cells from direct exposure to high nutrient concentrations | Typically 0.03-0.2 µm pore size |
| Low-Nutrient Media | Recreates oligotrophic conditions similar to natural marine environments | Modified with various carbon sources, mimicking natural concentrations |
| Inoculum Source | Provides diverse microbial community from environmental samples | Marine sediments, water samples, or microbial mats |
| Diffusion Chamber Design | Creates interface between natural environment and laboratory conditions | Can be deployed in situ or in laboratory simulators |
This approach enabled the successful cultivation of species from rarely cultured phyla, including Verrucomicrobiota and Balneolota, significantly outperforming traditional cultivation methods [8]. Remarkably, the application of this novel technique yielded 196 isolates, of which 115 represented previously uncultured taxa, achieving an exceptional novelty ratio of 58% [8].
Advanced Cultivation Workflows
The successful cultivation of fastidious marine microorganisms requires integrated workflows that combine genomic insights with tailored cultivation conditions. The following diagram illustrates a comprehensive experimental workflow for cultivating previously uncultured marine microorganisms, incorporating both in situ and laboratory-based approaches:
This workflow begins with comprehensive metagenomic analysis of the source environment to identify taxonomic composition and predict metabolic capabilities of target organisms [4] [37]. For Marinisomatota, this might reveal their potential for mixotrophic adaptations, informing media design [38]. The cultivation phase then employs either diffusion chamber systems or in situ incubation devices that maintain environmental conditions while allowing microbial growth monitoring [8] [39]. Successful cultures are subsequently transferred to laboratory conditions for isolation and purification, followed by functional validation of metabolic capabilities.
Niche-Mimicking Cultivation Strategies
Cultivation success rates have improved significantly through approaches that specifically replicate the chemical and physical conditions of target microorganisms' native habitats. For example, studies of nitrite-oxidizing bacteria (NOB) in the Mariana Trench revealed clear niche partitioning between slope (6000-10,000 m) and bottom (>10,000 m) sediments, with distinct adaptations to pressure, nutrient availability, and oxidative stress [40]. Slope-dominant NOB possessed expanded genetic arsenals for antioxidation and osmoprotection, suggesting these functions should be supported in cultivation attempts [40].
For Marinisomatota, their distribution patterns across global oceans provide crucial insights for cultivation strategies. These organisms are predominantly found in low-latitude marine regions, with relative abundances ranging from 0.18% to 36.21% across different oceanic provinces [38]. Their prevalence in specific depth zones and water masses indicates specialized environmental requirements that must be replicated for successful cultivation.
The Scientist's Toolkit: Essential Reagents and Materials
Table 2: Research Reagent Solutions for Cultivating Marine Microorganisms
| Reagent/Material | Function | Application Example |
|---|---|---|
| Modified Low-Nutrient Media | Recreates oligotrophic conditions of marine environments | Isolation of Verrucomicrobiota and Balneolota from marine sediments [8] |
| Semi-permeable Membranes | Enables chemical exchange while protecting cells | Diffusion chambers for in situ cultivation [8] |
| Multiple In Situ Nucleic Acid Collections (MISNAC) | Preserves in situ gene expression profiles during sampling | Seasonal studies of deep-sea microbial communities [39] |
| GuHCl-based Lysis Buffer | Efficient nucleic acid extraction from recalcitrant cells | Metagenomic analysis of hypersaline microbial mats [37] |
| RNAlater Stabilization Solution | Preserves RNA integrity during sample transport | Metatranscriptomic studies of Mariana Trench sediments [40] |
| Casein Starch Agar (SCA) | Selective isolation of marine Actinomycetota | Drug discovery from marine sediments [41] |
Marinisomatota: A Case Study in Connecting Cultivation with Functional Diversity
The relationship between cultivation success and understanding functional diversity is exemplified by recent advances in Marinisomatota research. Prior to innovative cultivation approaches, this phylum was known primarily from metagenomic studies indicating its ubiquity in marine environments [38]. The reconstruction of 1,588 Marinisomatota genomes from global ocean datasets revealed astonishing metabolic diversity, leading to the identification of three distinct metabolic groups: MS0 (photoautotrophic potential), MS1 (heterotrophic with enhanced glycolytic capacity), and MS2 (heterotrophic without glycolysis) [38].
This genomic insight fundamentally changed cultivation strategies for these organisms. Instead of applying uniform culture conditions, researchers could now design targeted approaches based on predicted metabolic capabilities. For putative MS0 members, cultivation attempts could incorporate light exposure and limited organic carbon sources to select for photoautotrophic populations. For MS1 and MS2 types, varying the availability of organic carbon substrates and monitoring glycolytic activity would help distinguish these functional groups [38].
The functional diversity of Marinisomatota has significant implications for ocean ecosystem research. Their metabolic flexibility suggests they play important roles in carbon cycling across different oceanic provinces, potentially transitioning between autotrophic and heterotrophic strategies in response to nutrient availability and light conditions [38]. This adaptability may explain their widespread distribution and persistence in various marine environments, from surface waters to the deep sea [38].
Innovative cultivation methods are progressively overcoming the challenge of the "uncultured majority" in marine microbiology. Approaches such as diffusion-based cultivation, niche-mimicking conditions, and genomics-guided media design have demonstrated remarkable success in isolating previously uncultured taxa, achieving novelty rates as high as 58% [8]. These advances are particularly crucial for understanding the functional diversity of ecologically significant groups like Marinisomatota, whose metabolic versatility appears fundamental to their success in global oceans [38].
Future cultivation efforts will likely incorporate increasingly sophisticated multi-omics data to design targeted isolation strategies. As metagenomic and metatranscriptomic datasets continue to expand, particularly for understudied extreme environments like hadal zones and hypersaline systems, they will provide unprecedented insights into the metabolic requirements and interactions of uncultured microorganisms [37] [40] [39]. This knowledge, combined with advanced cultivation devices that better simulate natural environmental conditions, promises to further narrow the gap between molecular surveys and cultured representatives, ultimately transforming our understanding of microbial life in ocean ecosystems.
The global ocean represents a vast and relatively untapped reservoir of biological and biochemical diversity, serving as a critical source for discovering novel bioactive compounds with significant potential in biotechnological and biomedical applications [42] [43]. Marine microorganisms survive in diverse and often extreme environments, leading to the evolution of specialized metabolic pathways that produce unique secondary metabolites and enzymes not found in terrestrial organisms [43]. The past two decades have witnessed remarkable advances in sequencing technologies, enabling researchers to access the genetic potential of marine microorganisms without the limitations of traditional cultivation methods [4]. Among the myriad of marine microbes, the phylum Marinisomatota has emerged as a particularly promising target for bioprospecting efforts due to its extensive functional diversity in ocean ecosystems and its genetic potential for producing novel bioactive compounds [37].
In silico bioprospecting represents a paradigm shift in the discovery of bioactive compounds, leveraging computational approaches to mine genomic and metagenomic datasets for genes encoding potentially valuable enzymes, antimicrobial peptides, and other therapeutic molecules [4] [44]. This approach allows researchers to efficiently screen thousands of genomes or metagenome-assembled genomes (MAGs) for target sequences before engaging in costly laboratory experiments and synthesis [45]. The integration of high-throughput sequencing with advanced bioinformatics tools has dramatically accelerated the discovery pipeline, enabling the identification of novel CRISPR-Cas systems, antimicrobial peptides, and plastic-degrading enzymes from marine microbial genomes [4].
Computational Framework for Marine Bioprospecting
In silico bioprospecting relies on the availability of comprehensive genomic resources and specialized computational tools. The establishment of global genome catalogues has been instrumental in providing the raw data necessary for large-scale mining efforts. The Global Ocean Microbiome Catalogue (GOMC), for instance, integrates 43,191 bacterial and archaeal genomes from publicly available marine metagenomes, encompassing 138 distinct phyla and significantly expanding the known diversity of marine microbiomes [4]. Similarly, databases such as MAGdb provide curated collections of high-quality metagenome-assembled genomes (HMAGs), with 99,672 genomes meeting strict quality standards (>90% completeness and <5% contamination) [46].
Table 1: Key Genomic Resources for Marine In Silico Bioprospecting
| Resource Name | Genome Count | Key Features | Relevance to Marine Bioprospecting |
|---|---|---|---|
| Global Ocean Microbiome Catalogue (GOMC) | 43,191 MAGs | 138 phyla; 3,470 genera; 20,295 potentially novel species | Unified catalogue from diverse marine ecosystems; Enables discovery of novel CRISPR systems, antimicrobial peptides, and enzymes |
| MAGdb | 99,672 HMAGs | >90% completeness, <5% contamination; Covers clinical, environmental, animal categories | High-quality reference genomes; Standardized quality metrics facilitate reliable comparative genomics |
| Marine Microbial Dark Matter Databases | 364 MAGs (Solar Lake study) | ~30% classified as microbial dark matter; Includes uncultured lineages | Access to previously unexplored genetic diversity from extreme environments |
The functional annotation of genomes typically employs classification systems such as Clusters of Orthologous Groups (COGs), which categorize proteins into functional groups based on sequence homology [10]. Quantitative analyses have demonstrated that taxonomic rank explains approximately 41.4% of the variation in COG functional category relative abundance, with phylum-level classification accounting for 14.6% of this variance [10]. This taxonomic coherence in functional potential provides a valuable framework for guiding bioprospecting efforts toward specific microbial lineages with heightened probabilities of harboring desired metabolic capabilities.
Core Methodological Workflow
The in silico bioprospecting pipeline involves multiple interconnected steps, from data acquisition to functional validation. The following diagram illustrates a generalized workflow for genome mining and target identification:
Diagram 1: In Silico Bioprospecting Workflow. The process begins with sample collection and progresses through sequencing, assembly, and computational analysis before experimental validation.
Genome Recovery and Quality Assessment
The initial phase involves processing raw sequencing data to reconstruct microbial genomes. From 237.02 Tb of sequence data from 24,395 publicly available marine metagenomes, researchers have successfully reconstructed 43,191 medium- to high-quality MAGs with average completeness of 82.33% and minimal contamination (1.79%) [4]. Quality assessment is critical at this stage, with tools like CheckM commonly used to evaluate completeness and contamination based on the presence of single-copy marker genes [46]. High-quality MAGs should meet the MIMAG standards (Minimum Information about a Metagenome-Assembled Genome) with >90% completeness and <5% contamination to ensure reliable downstream analyses [46].
Functional Annotation and Target Identification
Following genome recovery, functional annotation identifies genes encoding potentially valuable bioactive compounds. This process typically involves:
- Gene calling using tools like Prodigal or MetaGeneMark
- Homology searches against curated databases (e.g., COG, Pfam, TIGRFAM)
- Domain identification to detect specific protein families of interest
- Pathway reconstruction to identify complete biosynthetic gene clusters
Advanced approaches incorporate machine learning algorithms to predict novel antimicrobial peptides or enzyme families based on conserved sequence features and structural motifs [4]. For instance, deep learning-based bioinformatics applied to marine genomes has led to the discovery of ten novel antimicrobial peptides and three enzymes capable of degrading polyethylene terephthalate (PET) [4].
Structural Prediction and Molecular Docking
For candidate bioactive compounds, structural prediction provides insights into function and potential applications. Tools like I-TASSER predict three-dimensional protein structures from amino acid sequences, while PharmMapper facilitates reverse docking to identify potential molecular targets [44] [45]. Molecular docking simulations using platforms like PatchDock evaluate the binding compatibility between predicted structures and target receptors, generating scores based on three-dimensional conformational compatibility and intermolecular forces [44]. These computational assessments help prioritize candidates for subsequent experimental validation.
Marinisomatota: A Case Study in Functional Diversity
Ecological Significance and Genomic Features
The phylum Marinisomatota represents a fascinating group of marine bacteria with considerable biotechnological potential. Recent studies of hypersaline microbial mats in Solar Lake, Egypt, recovered multiple Marinisomatota MAGs, revealing their genetic capacity for polysaccharide degradation [37]. This functional capability positions Marinisomatota as key players in carbon cycling within marine ecosystems and suggests potential applications in biofuel production and bioremediation.
Marinisomatota genomes demonstrate adaptations to extreme environments, including mechanisms for coping with high salinity, UV radiation, and fluctuating nutrient conditions [37]. These adaptations often involve the production of specialized enzymes (extremozymes) and secondary metabolites that stabilize cellular structures and protect against environmental stressors. The genetic machinery underlying these adaptations represents a valuable resource for bioprospecting efforts aimed at discovering novel bioactives with industrial applications.
Table 2: Functional Capabilities of Marinisomatota and Related Marine Microbes
| Microbial Group | Habitat | Key Functional Capabilities | Bioprospecting Relevance |
|---|---|---|---|
| Marinisomatota | Hypersaline microbial mats | Polysaccharide degradation; Carbon cycling | Biofuel production; Bioremediation enzymes |
| Candidate Lokiarchaeota | Hypersaline microbial mats | Mixotrophic lifestyle; Carbon fixation | Novel metabolic pathways; Evolutionary insights |
| Candidate Heimdallarchaeota | Hypersaline microbial mats | Mixotrophic lifestyle; Methanol utilization | Specialty chemical production |
| Myxococcota | Hypersaline microbial mats | Complete photosynthetic gene cluster | Bioenergy applications; Light-harvesting pigments |
| Planctomycetota | Anoxic marine basins | Extremely large genomes (up to 18.4 Mb); Diverse metabolic pathways | Novel gene discovery; Complex natural products |
In Silico Bioprospecting for Antimicrobial Compounds
Marinisomatota and other marine microbes represent promising sources for novel antimicrobial peptides (AMPs), which are increasingly important in addressing the global crisis of multidrug-resistant pathogens [45]. Computational approaches have been successfully applied to discover AMPs from diverse marine sources, including spider venoms and marine microorganisms [44] [45].
The process for AMP discovery involves:
- Peptide characterization using tools like Heliquest to determine physicochemical parameters (net charge, hydrophobicity, hydrophobic moment, molecular weight)
- Target identification through reverse docking with PharmMapper
- Molecular docking using PatchDock to evaluate binding affinity to microbial targets
- Dynamics simulations with GROMACS to assess interaction stability
This approach has identified potential targets for known antimicrobial peptides, including outer membrane proteins F (1MPF) and A (1QJP), flavoprotein fumarate reductase (1D4E), and ATP-dependent Holliday junction DNA helicase (1IN4) [44]. Similarly, studies on the peptide Oligoventin have identified enoyl-ACP reductase and thymidylate synthase ThyX as potential molecular targets [45].
The following diagram illustrates the molecular docking process for antimicrobial peptide discovery:
Diagram 2: Antimicrobial Peptide Discovery Pipeline. Computational workflow for identifying and validating antimicrobial peptides from sequence data to candidate selection.
Experimental Protocols and Methodologies
Metagenomic Assembly and Binning Protocol
Sample Preparation and Sequencing:
- Collect marine samples (water, sediment, or microbial mats) using sterile containers
- Extract DNA using commercial kits (e.g., DNeasy PowerSoil Kit) with modifications for difficult samples
- Perform quality control on extracted DNA using fluorometric quantification and gel electrophoresis
- Prepare sequencing libraries with appropriate insert sizes for short-read (Illumina) or long-read (PacBio, Nanopore) platforms
- Sequence using high-throughput platforms (e.g., Illumina NovaSeq) with sufficient depth (~70 million reads per sample for complex communities) [37]
Data Processing and Genome Reconstruction:
- Quality Filtering: Remove adapters and low-quality sequences using Fastp (v0.23.2) or similar tools
- Metagenomic Assembly: Assemble quality-filtered reads using metaSPAdes or MEGAHIT with optimized parameters for complex communities
- Binning: Recover MAGs using multiple binning tools (e.g., MetaBAT2, MaxBin2, CONCOCT) followed by integration and refinement with metaWRAP [46]
- Quality Assessment: Evaluate MAG quality based on completeness and contamination using CheckM with default parameters
- Taxonomic Classification: Assign taxonomy to MAGs using GTDB-Tk against the Genome Taxonomy Database
Molecular Docking and Dynamics Protocol
Target Identification and Preparation:
- Identify potential targets through reverse docking using PharmMapper with default settings
- Retrieve protein structures from PDB database (https://www.rcsb.org/)
- Prepare receptor files by removing water molecules and adding hydrogen atoms using UCSF Chimera
- Optimize structures through energy minimization (1000 steps steepest descent, 10 steps conjugate gradient) [45]
Ligand Preparation:
- Predict peptide three-dimensional structure using I-TASSER server
- Perform energy minimization with UCSF Chimera (steepest descent step size 0.02Å)
- Save structures in .MOL2 and .PDB formats for docking analyses
Molecular Docking:
- Perform docking using PatchDock server with Clustering RMSD 4.0 and Default Complex Type
- Evaluate results based on geometric shape complementarity scores
- Analyze hydrogen bonds and hydrophobic interactions using UCSF Chimera FindhBond tool (relax constraints: 2Å and 20 degrees; maximum distance 4Å)
- Validate binding sites using I-TASSER server for ligand site prediction
Molecular Dynamics Simulations:
- Conduct simulations using GROMACS (v.2022.4)
- Set simulation parameters: temperature 300K, pressure 1 bar, simulation time 10ns [44]
- Analyze trajectory files for complex stability and interaction persistence
Research Reagent Solutions for In Silico Bioprospecting
Table 3: Essential Computational Tools and Databases for Marine Bioprospecting
| Tool/Resource | Category | Function | Access |
|---|---|---|---|
| GTDB-Tk | Taxonomic Classification | Standardized taxonomic assignment of microbial genomes | https://ecogenomics.github.io/GTDBTk/ |
| CheckM | Quality Assessment | Evaluate completeness and contamination of MAGs | https://github.com/Ecogenomics/CheckM |
| metaWRAP | Binning Pipeline | Integrate and refine bins from multiple tools | https://github.com/bxlab/metaWRAP |
| I-TASSER | Structure Prediction | Predict 3D protein structures from amino acid sequences | https://zhanggroup.org/I-TASSER/ |
| PharmMapper | Target Identification | Reverse docking for potential target identification | http://www.lilab-ecust.cn/pharmmapper/ |
| PatchDock | Molecular Docking | Evaluate receptor-ligand binding compatibility | https://bioinfo3d.cs.tau.ac.il/PatchDock/ |
| GROMACS | Dynamics Simulation | Molecular dynamics simulations of biomolecules | https://www.gromacs.org/ |
| UCSF Chimera | Visualization | Molecular visualization and analysis | https://www.cgl.ucsf.edu/chimera/ |
| Heliquest | Peptide Analysis | Determine physicochemical parameters of peptides | https://heliquest.ipmc.cnrs.fr/ |
In silico bioprospecting represents a powerful approach for unlocking the functional potential of marine microbial diversity, with Marinisomatota serving as an exemplary case of the promising bioactive resources awaiting discovery in ocean ecosystems. The integration of high-throughput sequencing, advanced bioinformatics, and computational modeling has created an efficient pipeline for identifying novel enzymes, antimicrobial peptides, and other valuable compounds from marine genomes before laboratory synthesis and validation [4] [42].
Future advances in in silico bioprospecting will likely focus on improving algorithm accuracy for predicting protein structure and function, expanding reference databases with diverse marine genomes, and developing integrated platforms that combine multi-omics data for comprehensive functional assessment [46]. As these computational methods continue to evolve, they will dramatically accelerate the discovery of novel bioactives from marine sources, contributing to drug development, industrial biotechnology, and environmental sustainability while highlighting the invaluable functional diversity of marine microorganisms like Marinisomatota in ocean ecosystem research.
The oceans represent the planet's most extensive ecosystem, within which marine microorganisms act as the fundamental engines of global biogeochemical cycles. The direct linkage between the genetic potential of these microorganisms and the large-scale cycling of carbon and nutrients represents a frontier in marine microbial ecology. This connection is epitomized by the functional diversity found within specific microbial clades, which directly influences ecosystem-level processes. The advent of genome-resolved metagenomics has revolutionized this field by enabling researchers to move beyond mere taxonomic identification to a detailed understanding of the metabolic capabilities encoded within microbial genomes. By analyzing these genomic blueprints, scientists can now decipher the specific roles microorganisms play in carbon fixation, organic matter degradation, and nutrient transformation across diverse marine environments.
This technical guide explores the critical link between genetic potential and ecosystem function, with a specific focus on the phylum Marinisomatota (formerly known as Marinimicrobia, Marine Group A, and SAR406) as a model system. These organisms exemplify how genomic diversity translates to functional diversity in marine ecosystems. Through detailed analysis of their metabolic strategies, distribution patterns, and enzymatic capabilities, we can establish a mechanistic understanding of how microbial communities drive the oceanic carbon pump and nutrient regeneration processes that sustain life on Earth.
Quantitative Profiling of Marinisomatota Diversity and Distribution
Comprehensive analysis of Marinisomatota across global ocean basins has revealed remarkable patterns of abundance, diversity, and distribution. These findings provide critical baseline data for understanding their potential contribution to carbon and nutrient cycling on a global scale.
Table 1: Global Distribution and Abundance of Marinisomatota
| Parameter | Value/Range | Significance |
|---|---|---|
| Latitudinal Preference | Low-latitude marine regions | Highest abundance in tropical and subtropical waters |
| Relative Abundance | 0.18% to 36.21% | Can dominate microbial communities in specific niches |
| Genomic Diversity | 1,588 genomes recovered | Represents substantial phylogenetic diversity |
| Taxonomic Resolution | 1 class, 2 orders, 14 families, 31 genera, 67 species | Extensive radiation within the phylum |
| Notable Families | S15-B10, TCS55, UBA1611, UBA2128, UBA8226 | Families with photoautotrophic potential |
Table 2: Metabolic Strategies Identified in Marinisomatota
| Metabolic Strategy | Trophic Mode | Key Characteristics | Ecological Niche |
|---|---|---|---|
| MS0 | Photoautotrophic potential | Capacity for light-dependent carbon fixation via Crassulacean acid metabolism (M00169) | Translucent zone or transition between translucent and aphotic layers |
| MS1 | Heterotrophic | Pronounced glycolytic pathway for organic carbon degradation | Various depths, depending on organic matter availability |
| MS2 | Heterotrophic | Lacks glycolysis; alternative pathways for carbon processing | Environments with specific organic substrate availability |
The emergence of these distinct metabolic strategies likely represents an evolutionary response to nutrient limitations within the ocean, allowing Marinisomatota to occupy diverse ecological niches and maximize resource utilization in different marine environments [2] [1]. The coexistence of multiple trophic modes within a single phylum exemplifies the metabolic plasticity that enables microbial taxa to significantly influence both carbon fixation and carbon degradation pathways within oceanic ecosystems.
Methodologies for Linking Genetic Potential to Ecosystem Function
Genome-Resolved Metagenomics Workflow
Establishing robust connections between genetic potential and ecosystem function requires sophisticated methodological approaches centered on genome-resolved metagenomics. The following protocol outlines the key steps for processing marine samples from collection to functional annotation:
Sample Collection and Processing:
- Collect marine samples (water, sediment, or microbial mats) using appropriate methods (e.g., Niskin bottles for water, corers for sediments)
- Immediately preserve samples at -80°C or in DNA/RNA stabilization buffers to prevent degradation
- For metatranscriptomic studies, add RNase inhibitors and process samples rapidly to preserve RNA integrity
DNA Extraction and Sequencing:
- Extract high-molecular-weight DNA using kits specifically designed for environmental samples (accounting for diverse cell wall types and potential inhibitors)
- Assess DNA quality and quantity using fluorometric methods (e.g., Qubit) and fragment analyzers
- Prepare sequencing libraries using appropriate kits for Illumina, PacBio, or Oxford Nanopore platforms
- Sequence to sufficient depth (typically 20-50 million reads per sample for complex marine communities)
Bioinformatic Processing:
- Perform quality control using Fastp [1] or similar tools to remove adapter sequences and low-quality reads
- Assemble quality-filtered reads into contigs using metaSPAdes, MEGAHIT, or similar metagenomic assemblers
- Bin contigs into metagenome-assembled genomes (MAGs) using composition and coverage information with tools like MaxBin, MetaBAT, or CONCOCT
- Assess genome quality using CheckM or similar tools, reporting completeness and contamination estimates according to established standards [4]
Functional Annotation:
- Annotate protein-coding genes using Prokka or similar pipelines
- Perform functional assignment using KEGG, COG, Pfam, and TIGRFAM databases
- Identify specific metabolic pathways of interest (e.g., carbon fixation, sulfur oxidation, nitrogen metabolism) using specialized tools like METABOLIC or HMMER searches against custom profile HMMs
- For Marinisomatota specifically, screen for genes associated with Crassulacean acid metabolism (M00169) and glycolytic pathways [2] [1]
Experimental Validation of Predicted Functions
While genomic predictions provide valuable insights, experimental validation is essential to confirm the hypothesized ecological functions. Key validation approaches include:
Metatranscriptomic Analysis:
- Extract RNA from the same environment using RNA stabilization protocols
- Remove rRNA and prepare mRNA sequencing libraries
- Sequence and map reads to reference MAGs to identify actively transcribed genes
- Compare expression levels of key metabolic genes across different environmental conditions
Heterologous Expression:
- Clone putative functional genes into expression vectors
- Express in model bacterial systems (e.g., E. coli)
- Purify and characterize enzyme activity in vitro
- For example, putative PETases discovered in marine microbiomes have been validated through heterologous expression and confirmation of plastic-degrading activity [4]
Isotopic Tracer Experiments:
- Incubate environmental samples with stable isotope-labeled substrates (e.g., 13C-bicarbonate, 15N-nitrate)
- Track incorporation into biomass or specific metabolic products
- Combine with single-cell sorting or density gradient centrifugation to link activity to specific phylogenetic groups
Carbon Cycling Pathways in Marine Microbiomes
Genomic Blueprints of Carbon Transformation
The genetic potential for carbon cycling represents one of the most critical links between microbial communities and ecosystem function. Different microbial groups possess distinct genetic repertoires that determine their roles in the marine carbon cycle, from CO₂ fixation to complex carbon degradation.
Marinisomatota as Model Mixotrophs in the Carbon Cycle
Marinisomatota represent a particularly interesting case study in microbial contributions to carbon cycling due to their metabolic plasticity. Genomic analysis has revealed that different members of this phylum employ distinct metabolic strategies:
Photoautotrophic Potential (MS0):
- Several Marinisomatota families (S15-B10, TCS55, UBA1611, UBA2128, and UBA8226) encode proteins associated with Crassulacean acid metabolism (M00169) [2] [1]
- This light-dependent carbon fixation pathway allows these organisms to function as primary producers in the translucent zone
- The capacity to fix inorganic carbon positions these organisms as significant contributors to carbon uptake in oligotrophic waters
Heterotrophic Carbon Processing (MS1 and MS2):
- MS1 genotypes possess complete glycolytic pathways for efficient processing of organic carbon
- MS2 genotypes lack glycolysis but utilize alternative pathways for carbon metabolism
- Certain Marinisomatota MAGs show genetic potential for polysaccharide degradation, contributing to the breakdown of complex organic matter [47] [48]
- This functional diversity enables different Marinisomatota populations to participate in various stages of organic carbon remineralization
The coexistence of autotrophic and heterotrophic strategies within a single phylum exemplifies how genomic diversity within microbial groups creates functional redundancy and resilience in marine carbon cycling processes.
Nutrient Cycling and Interconnections with Carbon Flow
Integrated Nutrient Cycling Pathways
The cycling of carbon in marine ecosystems is intrinsically linked to the transformation of essential nutrients, particularly nitrogen, phosphorus, and sulfur. Microorganisms mediate these interconnected cycles through specialized metabolic pathways encoded in their genomes.
Table 3: Microbial Genes Involved in Nutrient Cycling Processes
| Nutrient Cycle | Key Metabolic Process | Representative Genes | Microbial Groups |
|---|---|---|---|
| Nitrogen Cycle | Nitrogen Fixation | nifH, nifD, nifK | Cyanobacteria, KSB1 bacteria [47] [48] |
| Denitrification | nirS, nirK, nosZ | Marinisomatota, other heterotrophic bacteria [47] | |
| Sulfur Cycle | Thiosulfate Oxidation | SOX gene complex (soxA, soxB, soxX, soxY, soxZ) | Asgardarchaeota, Coatesbacteria [47] [48] |
| Sulfate Reduction | dsrA, dsrB | Various sulfate-reducing bacteria and archaea | |
| Phosphorus Cycle | Organic P Hydrolysis | Alkaline phosphatase (phoA, phoX) | Diverse marine bacteria and archaea |
Genomic Evidence for Coupled Biogeochemical Processes
Microbial genomes frequently reveal the genetic potential for coupled biogeochemical transformations that link multiple nutrient cycles:
Marinisomatota in Carbon-Nitrogen Coupling:
- Genomic evidence indicates that some Marinisomatota can degrade nitrogen-containing organic compounds
- This simultaneous processing of carbon and nitrogen structures positions these organisms at the interface of multiple biogeochemical cycles
Microbial Dark Matter in Extreme Environments:
- In hypersaline microbial mats like Solar Lake, previously uncharacterized microbial dark matter (including Asgardarchaeota and candidate phyla) have been found to encode genes for thiosulfate oxidation (SOX complex), nitrogen fixation, and denitrification [47] [48]
- These findings demonstrate that uncultured microbial groups play significant roles in connecting carbon, nitrogen, and sulfur cycles in specialized ecosystems
Hadal Zone Adaptations:
- In deep-sea trench sediments, microbial communities exhibit genomic adaptations for utilizing aromatic compounds (carbon cycling) under oligotrophic conditions while simultaneously maintaining antioxidant systems for high-pressure adaptation [7]
- This coupling of carbon metabolism with stress response mechanisms illustrates how environmental constraints shape functional genetic potential
The interconnection between nutrient cycles at the genomic level creates a network of biogeochemical processes that ultimately controls ecosystem-level carbon and nutrient fluxes in the ocean.
The Scientist's Toolkit: Essential Research Reagents and Materials
Table 4: Essential Research Reagents for Marine Microbial Genomics
| Category | Specific Product/Kit | Application | Key Features |
|---|---|---|---|
| Sample Preservation | RNAlater, DNA/RNA Shield | Nucleic acid stabilization | Preserves integrity during storage and transport |
| DNA Extraction | DNeasy PowerSoil Pro Kit | Environmental DNA extraction | Effective with low biomass and inhibitor removal |
| RNA Extraction | RNeasy PowerMicrobiome Kit | Environmental RNA extraction | Maintains RNA integrity, removes co-purified inhibitors |
| Library Preparation | Illumina DNA Prep, Nextera XT | Sequencing library construction | Compatible with low-input samples, dual index barcoding |
| Long-read Sequencing | PacBio SMRTbell, Oxford Nanopore | Complete genome assembly | Resolves repetitive regions, complete genomes |
| Functional Annotation | KofamKOALA, eggNOG-mapper | Metabolic pathway prediction | KEGG orthology assignment, hidden Markov models |
| Genome Binning | MetaBAT2, MaxBin 2.0 | MAG reconstruction | Uses sequence composition and coverage patterns |
| Taxonomic Classification | GTDB-Tk | Genome-based taxonomy | Standardized taxonomy based on bacterial and archaeal genomes |
| Metabolic Analysis | METABOLIC, HMMER | Pathway profiling | Custom HMM profiles for key metabolic functions |
The direct linkage between genetic potential and ecosystem function represents a paradigm shift in our understanding of marine biogeochemical cycles. Through genome-resolved metagenomics, we can now identify the specific microbial actors responsible for carbon fixation, organic matter degradation, and nutrient transformations that collectively regulate ocean fertility and carbon sequestration. The functional diversity within groups like Marinisomatota—spanning photoautotrophic, heterotrophic, and mixotrophic strategies—exemplifies how metabolic plasticity at the genomic level translates to ecological resilience at the ecosystem level.
Future research in this field will increasingly focus on quantifying the expression of genetic potential through metatranscriptomic and metaproteomic approaches, coupled with stable isotope probing to directly link taxonomy to function. As global sequencing efforts continue to expand [4], and as analytical methods become more sophisticated, we will develop increasingly predictive models of how marine ecosystems respond to environmental change based on the genetic makeup of their microbial communities. This knowledge is not only fundamental to understanding ocean biogeochemistry but also critical for projecting how climate change will alter the ocean's biological carbon pump and nutrient cycles that support marine life.
Navigating Research Challenges: Common Pitfalls in Characterizing Marinisomatota Function and Metabolism
Addressing Primer Biases and Detection Gaps in Community Profiling
The accurate profiling of microbial communities, essential for understanding ecosystems from the human gut to the global ocean, is fundamentally constrained by methodological choices in molecular amplification. Primer bias—the distortion of microbial community representation due to mismatches in primer binding sites—presents a significant challenge in molecular ecology, potentially leading to the underestimation of key taxa and flawed ecological inferences [49] [50]. This technical guide addresses these biases within the specific context of studying the functional diversity of Marinisomatota (formerly Marinimicrobia) in ocean ecosystems. Marinisomatota are ubiquitous and abundant in marine environments, traditionally characterized as heterotrophic microorganisms but now recognized for their metabolic versatility, including the capacity for light-dependent processes in some lineages [2]. Their ecological roles are shaped by diverse metabolic strategies, yet their comprehensive profiling is susceptible to the primer-related detection gaps discussed herein. This guide provides researchers with a structured framework to identify, quantify, and mitigate these biases through rigorous experimental design and data analysis, thereby enabling more accurate characterization of complex microbial communities.
Quantitative Evidence of Primer Bias Across Ecosystems
The impact of primer selection is quantifiable and varies significantly across different genetic markers and ecosystems. The following summaries highlight key findings from recent studies.
Table 1: Documented Primer Bias Across Genetic Markers and Ecosystems
| Genetic Marker | Ecosystem | Documented Bias | Performance Summary |
|---|---|---|---|
| ITS1 & ITS2 [51] | Human Gut Mycobiome | Enhanced coverage of fungal taxa compared to 18S rRNA. | ITS2 yielded 183 OTUs, ITS1 158 OTUs, versus only 58 OTUs for 18S. |
| ITS2 (Plant) [49] | Large Mammalian Herbivore Diets | Consistent underrepresentation of graminoids. | >40% of graminoid species failed to amplify in vitro; relative abundance was underestimated. |
| COI [50] | Marine Metazoan Biodiversity | Highly variable taxon recovery based on primer set. | Mismatches, especially near the 3' end, significantly reduce PCR efficacy and biodiversity estimates. |
| Multi-Marker Combination [51] | Human Gut Mycobiome | Outperformed single-marker approaches. | The combination of ITS1–ITS2–18S produced the highest fungal richness. |
The consistency of primer bias across diverse systems underscores its fundamental nature. In fungal profiling, the choice between ITS1, ITS2, and 18S rRNA markers leads to dramatically different outcomes. One study found that ITS2 primers yielded 183 operational taxonomic units (OTUs), ITS1 yielded 158 OTUs, while 18S primers detected only 58 OTUs from the same samples, highlighting a stark difference in taxonomic coverage [51]. Similarly, in plant DNA metabarcoding of herbivore diets, both tested ITS2 primer pairs (ITS-S2F/ITS4 and UniPlant F/R) consistently underrepresented graminoids, with over 40% of graminoid species failing to amplify during in vitro tests [49]. This bias can lead to incorrect ecological conclusions, such as overestimating diet overlap among herbivores.
The root of this bias often lies in primer-template mismatches. Research on the Cytochrome c Oxidase Subunit I (COI) gene for marine metazoan biodiversity found that the number and position of these mismatches are critical. Exceeding three mismatches in a single primer, or three in one primer and two in the other, can inhibit PCR entirely. Mismatches within the last 5 bases of the primer's 3' end are particularly detrimental to amplification efficiency [50]. Given the ubiquity of these issues, a single primer set is often insufficient for accurate biodiversity assessment, arguing for a multi-marker approach [51] [50].
Experimental Protocols for Bias Assessment and Mitigation
To ensure the accuracy of community profiling data, researchers must implement protocols to actively identify and account for primer biases. The following workflows provide a pathway to achieve this.
Core Workflow for Bias Evaluation
The following diagram outlines the critical stages for a robust evaluation of primer bias in any profiling study.
Detailed Experimental Procedures
1. In Silico Primer Evaluation
- Objective: Computationally predict primer coverage and specificity before wet-lab work.
- Procedure:
- Database Curation: Compile a relevant, high-quality reference database. For marine microbes, this may involve downloading complete genomes from NCBI RefSeq and filtering for marine taxa using databases like WoRMS (World Register of Marine Species) [50].
- Mismatch Analysis: Extract the target gene region (e.g., 16S, 18S, ITS, COI) from the reference database. Use bioinformatics scripts (e.g., in R or Python) to align primer sequences to these targets and identify the number and position of mismatches. Primers with >3 mismatches, especially in the 3' region, should be flagged [50].
- Coverage Estimation: Calculate the percentage of target taxa in your reference database that would be amplified with a minimal number of mismatches.
2. Mock Community Construction & Validation
- Objective: Create a defined microbial community with known composition to serve as a ground truth for testing.
- Procedure:
- Design: Create mock communities with different abundance distributions (e.g., even, dominant for a specific taxon). A study on plant primers used four types: equal, grass-dominant, forb-dominant, and tree/shrub-dominant [49].
- Pooling Strategies: Employ two pooling approaches to isolate PCR bias from other effects [49]:
- MC-A (Pool after PCR): Amplify each specimen's DNA separately with unique index primers, then pool the resulting amplicons in known concentrations. This controls for post-amplification steps.
- MC-B (Pool before PCR): Pool the genomic DNA of all specimens in known concentrations before a single PCR amplification. This directly tests the bias introduced during amplification.
- Validation: Use alternative quantification methods (e.g., qPCR, fluorometry) to confirm the initial DNA concentrations in the mock community.
3. Wet-Lab Primer Testing & Amplification
- Objective: Empirically determine the amplification efficiency of different primer sets.
- Procedure:
- Standardized PCR: Amplify the mock communities (both MC-A and MC-B) with each candidate primer set using the same thermocycling conditions, polymerase, and number of PCR cycles.
- Replication: Perform a minimum of three technical replicates per primer set to account for stochastic PCR effects.
- Control: Include a negative control (no template) to detect contamination.
4. Sequencing & Bioinformatic Processing
- Objective: Generate and process sequencing data to determine observed community composition.
- Procedure:
- Sequencing: Sequence the amplicons on a platform like Illumina MiSeq or DNBSEQ.
- Bioinformatics: Process raw reads using standardized pipelines (e.g., QIIME 2, USEARCH) for quality filtering, denoising, and clustering into OTUs or ASVs (Amplicon Sequence Variants) [51].
- Taxonomic Assignment: Classify sequences against reference databases (e.g., SILVA for 16S/18S, UNITE for ITS) [51].
5. Bias Quantification & Decision
- Objective: Quantify the discrepancy between expected and observed compositions to guide primer selection.
- Procedure:
- Statistical Comparison: Compare the expected composition of the mock community to the observed sequencing results. Calculate metrics like Fold-Change for each taxon:
(Observed Relative Abundance / Expected Relative Abundance). - Amplification Efficiency: For a taxon, a fold-change of 1 indicates perfect efficiency; <1 indicates under-representation; >1 indicates over-representation.
- Decision: Select the primer set that shows the highest fidelity to the expected mock community structure or the smallest bias against your taxa of interest (e.g., Marinisomatota).
- Statistical Comparison: Compare the expected composition of the mock community to the observed sequencing results. Calculate metrics like Fold-Change for each taxon:
A Case Study: From Bias to Functional Insights in Marinisomatota
Applying these bias-aware methods is crucial for accurate profiling of specific groups like Marinisomatota. These bacteria are abundant in global oceans and exhibit remarkable metabolic versatility, with recent studies identifying three distinct strategies: photoautotrophic potential (MS0), heterotrophic with pronounced glycolysis (MS1), and heterotrophic without glycolysis (MS2) [2]. Primer bias in 16S rRNA surveys could easily lead to the underrepresentation of certain Marinisomatota lineages, distorting our understanding of their ecological roles.
Once communities are accurately profiled, tools like METABOLIC can be used to infer functional potential from genomic data. METABOLIC is a scalable software that annotates microbial genomes, validates protein motifs, analyzes metabolic pathways, and calculates contributions to biogeochemical cycles [52]. It can process genomes from isolates, metagenome-assembled genomes (MAGs), or single-cell genomes.
For a community-scale analysis, METABOLIC can incorporate metagenomic read mappings to determine genome abundance. It then reconstructs functional networks based on "metabolic handoffs"—where sequential metabolic transformations are distributed among different organisms [52]. This allows researchers to visualize the interconnected roles of community members, including Marinisomatota, in driving processes like carbon and sulfur cycling. METABOLIC produces outputs such as heatmaps, functional network diagrams, and Sankey diagrams illustrating microbial contributions to biogeochemical processes, providing a systems-level view of the community's functional potential [52].
Table 2: Research Reagent Solutions for Primer Bias and Functional Analysis
| Reagent / Tool | Function / Application | Specifications & Considerations |
|---|---|---|
| Mock Communities [49] | Ground truth for evaluating primer bias. | Should include taxa and abundance distributions relevant to the study ecosystem (e.g., marine samples). |
| DNBSEQ / Illumina Systems [51] | High-throughput amplicon sequencing. | Platform choice affects read length and cost; ensure compatibility with amplicon size. |
| SILVA & UNITE Databases [51] | Taxonomic classification of 16S/18S and ITS sequences. | Requires regular updating to ensure comprehensive taxonomic coverage. |
| METABOLIC Software [52] | Functional profiling of genomes/MAGs; biogeochemical cycle inference. | Integrates KEGG, Pfam, TIGRfam, and custom HMMs for comprehensive annotation. |
| GTDB (Genome Taxonomy Database) [29] | Standardized microbial taxonomy based on genomes. | Essential for consistent taxonomic naming of novel groups like Marinisomatota. |
| KOfam, TIGRfam, Pfam HMMs [52] | Hidden Markov Model databases for protein family annotation. | Used by METABOLIC with manually curated cutoffs to minimize false positives. |
Primer bias is an inherent and significant challenge in molecular community profiling that cannot be ignored. As demonstrated across diverse ecosystems, the choice of genetic marker and primer set directly and measurably impacts the perceived diversity, composition, and dynamics of microbial communities. A commitment to rigorous, bias-aware methodologies—combining in silico checks, mock community validation, and multi-marker approaches—is fundamental for generating reliable data. For the study of complex groups like Marinisomatota, moving beyond biased amplicon sequencing to genome-resolved metagenomics and functional tools like METABOLIC is the path forward. This integrated strategy allows researchers to not only identify which microorganisms are present but also to accurately delineate their metabolic strategies and interconnected roles in global biogeochemical cycles, turning robust profiling data into meaningful ecological insight.
Resolving Functional Annotations for Hypothetical and Novel Genes
In the evolving field of marine microbial genomics, a significant portion of sequenced genes remains functionally uncharacterized. These hypothetical proteins (HPs)—predicted from genomic sequences but lacking experimental validation of their biological functions—represent a substantial knowledge gap in understanding ocean ecosystems. In marine bacteria like the widespread Marinisomatota phylum (formerly known as Marinimicrobia, Marine Group A, and SAR406), hypothetical genes can constitute a considerable proportion of genomic content [2]. Resolving their functions is critical for advancing our understanding of marine microbial ecology, biogeochemical cycling, and biotechnological applications.
The challenge is particularly acute in marine systems where microbial diversity vastly exceeds current cultivation capabilities. As of 2024, global ocean microbiome catalogs encompass over 43,000 metagenome-assembled genomes (MAGs) spanning 138 phyla, with a striking 43% of bacterial and archaeal genomes representing potentially novel taxa [4]. Within this reservoir of genetic novelty, hypothetical genes represent both a challenge and an opportunity—they may encode novel metabolic pathways, unique adaptations to marine environments, or biotechnologically valuable enzymes, but their characterization requires sophisticated computational and experimental approaches.
This technical guide provides a comprehensive framework for resolving functional annotations of hypothetical and novel genes, with specific emphasis on methodologies relevant to Marinisomatota research. We integrate cutting-edge computational predictions with experimental validation strategies, contextualized within the unique constraints and opportunities of marine microbiome studies.
Computational Prediction and Prioritization Pipelines
Structural and Functional Annotation Workflows
Initial functional annotation requires integrated bioinformatics pipelines that combine multiple prediction algorithms. The core workflow begins with genome quality assessment and proceeds through sequential layers of analysis (Figure 1). For Marinisomatota genomes, which are primarily obtained through metagenomic assembly, quality verification using tools like CheckM is essential to ensure reliable downstream analyses [53].
Table 1: Key Bioinformatics Tools for Functional Annotation
| Tool Category | Specific Tools | Primary Function | Considerations for Marine Microbes |
|---|---|---|---|
| Genome Quality Assessment | CheckM | Assess completeness and contamination | Crucial for metagenome-assembled genomes |
| Structural Annotation | PROKKA, RAST | Gene calling and initial function assignment | Performance varies with atypical GC content |
| Domain Identification | InterProScan, Pfam | Protein family classification | Identifies conserved domains in novel proteins |
| Transmembrane Prediction | TMHMM | Helical transmembrane regions | Important for transporter identification |
| Subcellular Localization | PSORTb, Cell-PLoc | Cellular compartment prediction | Informed by gram-status (often negative for marine bacteria) |
| Tertiary Structure Prediction | AlphaFold2, ColabFold | 3D protein structure modeling | Reveals functional insights when sequence similarity is low |
Advanced structural annotation leverages both ab initio gene prediction and homology-based methods. For Marinisomatota, with their distinctive genomic features including potential mixotrophic capabilities, specialized attention should be paid to metabolic pathway genes that may be underrepresented in reference databases [2]. Subsequent functional annotation employs integrated pipelines that combine results from multiple databases including Pfam, TIGRFAM, COG, and GO through platforms like InterProScan [53].
Prioritization Strategies for Hypothetical Proteins
With typically dozens to hundreds of hypothetical proteins per genome, strategic prioritization is essential for efficient research. The following criteria help identify HPs with high probability of functional significance:
- Essentiality: Determine whether genes are essential using database comparisons (e.g., DEG) or genomic context [53].
- Conservation: Identify HPs with orthologs across multiple Marinisomatota lineages or related phyla.
- Genomic Context: Analyze operonic structures and gene neighborhoods for guilt-by-association predictions [54].
- Expression Evidence: Prioritize HPs with supporting transcriptomic or proteomic data.
- Structuredness: Assess predicted secondary structure and disorder; well-structured proteins often have more definable functions.
For Marinisomatota research, particular attention should be paid to HPs located near genes with established roles in marine nutrient cycling, light-harvesting, or stress response, as these may represent novel components of known adaptive strategies [2].
Advanced Functional Prediction Methodologies
Genomic Language Models and Semantic Design
A transformative approach in functional prediction leverages genomic language models like Evo, which learns semantic relationships across prokaryotic genes by training on vast genomic datasets [54]. These models employ a "guilt-by-association" principle at scale, recognizing that functionally related genes often cluster together in prokaryotic genomes.
The semantic design methodology (Figure 2) enables function-guided discovery through several applications:
- Contextual Autocomplete: Partial gene sequences can be completed with functionally consistent extensions, useful for fragmentary metagenomic data.
- Operon Prediction: Generating missing components of multi-gene systems based on genomic neighbors.
- Novel Enzyme Discovery: Designing sequences for desired catalytic activities based on contextual prompts.
For Marinisomatota research, this approach could generate hypotheses about the functions of hypothetical genes located in defense islands, photosynthetic gene clusters, or nutrient utilization operons [54]. The generated sequences can be tested for structural stability and functional potential before experimental validation.
Structure-Based Functional Inference
When sequence similarity offers limited functional insights, tertiary structure predictions can reveal unexpected relationships. Tools like AlphaFold2 and ColabFold enable accurate protein structure prediction even for novel sequences [53]. Subsequent structural comparison against databases like PDB and FoldSeek can identify distant homologs with established functions.
For Marinisomatota hypothetical proteins, structural analysis might reveal:
- Novel catalytic triads in putative enzymes
- DNA-binding motifs in regulatory proteins
- Transmembrane domains in potential transporters
- Protein-protein interaction interfaces
Particularly valuable is the identification of structural motifs associated with marine-relevant functions such as light-sensing domains, osmoregulatory components, or heavy metal binding sites [55].
Experimental Validation Frameworks
Molecular Cloning and Heterologous Expression
Functional characterization typically requires recombinant protein production. For marine microbes like Marinisomatota, this presents special challenges due to potential codon usage biases, requirement for specific ion concentrations, or unusual temperature optima.
Table 2: Experimental Approaches for Functional Validation
| Method Category | Specific Techniques | Information Gained | Marine-Specific Considerations |
|---|---|---|---|
| Heterologous Expression | E. coli, Vibrio systems | Protein production for biochemical assays | Codon optimization often needed for high GC genes |
| Phenotypic Screening | Growth complementation | Reveals role in metabolic pathways | Marine-simulating media conditions |
| Protein Interaction | Yeast two-hybrid, AP-MS | Identifies interaction partners | May require marine-like salt conditions |
| Enzyme Assays | Spectrophotometry, HPLC | Catalytic activity measurement | Temperature and pH reflecting native habitat |
| Localization Studies | Fluorescence tagging | Subcellular distribution | Membrane integrity in osmotic stress |
Essential steps in cloning Marinisomatota genes include:
- Codon Optimization: Adapt rare codon usage to expression host
- Vector Selection: Choose appropriate promoters and tags
- Expression Screening: Test different temperatures and inducters
- Solubility Enhancement: Use fusion tags or specialized strains
Successful examples include the expression of novel polyethylene terephthalate-degrading enzymes from marine microbes, where activity was confirmed in vitro after computational prediction [4].
Functional Assays for Marine-Relevant Activities
Hypothesized functions should be tested through targeted biochemical assays:
- Enzymatic Activities: For predicted enzymes, establish assays with putative substrates including marine-specific compounds like dimethylsulfoniopropionate (DMSP), methylphosphonate, or algal polysaccharides.
- Metabolic Complementarity: Introduce genes into mutant strains lacking specific metabolic capabilities to test functional rescue.
- Binding Studies: Use surface plasmon resonance or microscale thermophoresis to test interactions with potential ligands.
- Cellular Phenotypes: Express genes in model organisms to observe morphological or growth changes.
For Marinisomatota, particular attention should be paid to testing predicted functions related to their documented metabolic versatility, including potential involvement in light-driven metabolism, organic matter degradation, or specialized nutrient acquisition [2] [56].
Case Studies in Marine Microbial Genomics
Functional Prediction in Marinisomatota
Recent research on Marinisomatota illustrates the power of integrated approaches. Xiang et al. (2025) reconstructed 1,588 Marinisomatota genomes from global ocean datasets, identifying three distinct metabolic strategies: MS0 (photoautotrophic potential), MS1 (heterotrophic with enhanced glycolytic capacity), and MS2 (heterotrophic without glycolysis) [2]. This classification was enabled by:
- Comparative Genomics: Identifying genes and pathways differentially present across metabolic types
- Phylogenomic Analysis: Mapping metabolic traits onto evolutionary relationships
- Metatranscriptomics: Validating expression of key genes in environmental samples
The study revealed that certain Marinisomatota families encode proteins for Crassulacean acid metabolism (M00169), explaining their ability to transition between photic and aphotic zones [2]. This discovery emerged from persistent investigation of previously hypothetical genes adjacent to known metabolic markers.
Mercury Biotransformation Genes in Deep-Sea Sediments
A comprehensive study of mercury cycling genes in deep-sea sediments demonstrates the value of targeted functional screening. By analyzing 101 sediment layers from the South China Sea to the Mariana Trench, researchers identified novel Hg-methylating microorganisms affiliated with Desulfobacterota, Spirochaetota, and Zixibacteria [55]. The methodology included:
- Hidden Markov Model Searches: Using custom models to identify hgcAB and mer genes
- Genomic Context Analysis: Correlating gene presence with geochemical measurements
- Phylogenetic Placement: Determining evolutionary relationships of novel genes
- Adaptation Signature Detection: Identifying deep-sea-specific sequence features
This approach expanded the diversity of known Hg-transforming taxa and revealed unique ecophysiological adaptations, providing a template for investigating other biogeochemical cycles [55].
The Scientist's Toolkit: Research Reagent Solutions
Table 3: Essential Research Reagents for Functional Genomics
| Reagent Category | Specific Examples | Function in Workflow | Implementation Notes |
|---|---|---|---|
| Cloning Systems | pET vectors, Gateway | Recombinant protein expression | Codon-optimized for GC-rich marine genes |
| Expression Hosts | E.BL21, Vibrio natriegens | Heterologous protein production | Marine-adapted hosts for difficult proteins |
| Annotation Software | rTOOLS, Pharokka | Phage genome annotation | Superior functional annotation performance [57] |
| Protein Purification | His-tag resins, SEC | Isolation of recombinant proteins | May require specialized buffers mimicking marine conditions |
| Activity Assays | PNPP, ONPG substrates | Enzymatic activity detection | Marine-relevant substrates enhance ecological relevance |
| Antibiotic Resources | Custom resistance markers | Selection in cloning workflows | Consider marine bacterial susceptibility profiles |
Resolving the functions of hypothetical and novel genes in Marinisomatota and other marine microbes requires increasingly sophisticated integration of computational prediction and experimental validation. As genomic language models advance and structural prediction becomes more accurate, the marine microbiology field is poised to transition from cataloging genetic diversity to understanding functional significance.
The unique adaptations of Marinisomatota to oceanic environments—from their metabolic flexibility to their distribution across ocean depths—make them particularly rewarding targets for functional genomics. By applying the methodologies outlined in this guide, researchers can accelerate the discovery of novel biological mechanisms with potential applications in biotechnology, climate science, and drug development.
Future directions will likely include high-throughput functional screening, single-cell omics, and machine learning approaches that integrate multiple data types to predict gene function with increasing accuracy. As these tools mature, the vast repository of hypothetical genes in marine microbes will transform from a catalog of mysteries into a roadmap for biological discovery.
Figure 1. Workflow for functional annotation of hypothetical proteins from Marinisomatota and other marine microbes. The pipeline integrates computational predictions with experimental validation, with specific considerations for marine microbial genomics.
Figure 2. Semantic design approach using genomic language models for functional discovery. This methodology leverages the genomic context of known genes to generate novel sequences with related functions, applicable to understanding Marinisomatota metabolic diversity.
Differentiating True Autotrophy from Heterotrophic Capabilities
Within marine microbial ecology, accurately distinguishing obligate autotrophs from metabolically versatile organisms is fundamental for understanding carbon cycling and energy flow in ocean ecosystems. This differentiation is particularly critical for phyla like Marinisomatota (formerly SAR406), which are abundant in global oceans and exhibit complex metabolic strategies that blur traditional trophic classifications [1]. Relying solely on phylogenetic markers or the presence of a few key genes can lead to misclassification, as the genetic potential for autotrophy does not necessarily equate to its ecological implementation. This technical guide provides researchers with a structured framework, combining genomic, experimental, and analytical approaches to conclusively determine an organism's trophic mode, with a specific focus on its application within the context of Marinisomatota research.
Defining True Autotrophy and Key Differentiators
True autotrophy is defined as the ability of an organism to use inorganic carbon (CO₂ or HCO₃⁻) as its sole carbon source for biomass synthesis, deriving energy from light (photoautotrophy) or the oxidation of inorganic chemicals (chemoautotrophy). The core differentiator from heterotrophy is the assimilation of inorganic carbon versus the assimilation of organic carbon compounds.
The challenge in differentiation arises from widespread mixotrophy (the capability of both autotrophic and heterotrophic metabolism) and the presence of heterotrophic contaminants in cultivation experiments. Key physiological and genomic differentiators are summarized in Table 1.
Table 1: Key Differentiators Between True Autotrophy and Heterotrophic Capabilities
| Feature | True Autotrophy | Heterotrophy |
|---|---|---|
| Primary Carbon Source | Inorganic carbon (CO₂, HCO₃⁻) | Organic carbon compounds |
| Energy Source | Light (photo-) or inorganic chemical oxidation (chemo-) | Oxidation of organic compounds |
| Essential Metabolic Pathways | Complete carbon fixation pathways (e.g., Calvin Cycle, rTCA, 3-HP/4-HB) | Transporters and pathways for organic carbon degradation (e.g., glycolysis) |
| Stable Isotope Probing (SIP) | >¹³C-bicarbonate/¹⁴CO₂ into biomass in the absence of organic carbon | >¹³C- or ¹⁴C-labeled organic compounds into biomass |
| Growth Validation | Growth in minimal medium with CO₂ as sole carbon source | Requires one or more organic carbon sources for growth |
For Marinisomatota, recent metagenomic studies have revealed a phylum in metabolic transition. While traditionally characterized as heterotrophic, certain members possess genes for proteorhodopsin-based light harvesting and Crassulacean acid metabolism (CAM)-like carbon fixation pathways [1]. This does not necessarily indicate full photoautotrophy but suggests a mixotrophic strategy where light energy is potentially used to enhance survival under nutrient limitation, complicating clear-cut classification.
Methodological Approaches for Differentiation
A multi-faceted approach is required to unambiguously assign a trophic mode. The following methodologies should be employed in concert.
Genomic and Metagenomic Analysis
Genome-resolved metagenomics provides the foundational blueprint for an organism's metabolic potential.
- Target: Identify key autotrophy marker genes.
- Protocol:
- Genome Assembly & Curation: Recover high-quality metagenome-assembled genomes (MAGs) or isolate genomes. Standards suggest >80% completeness and <5% contamination for reliable metabolic inference [4].
- Pathway Identification: Use tools like METASCAPE, KEGG, or MetaCyc to screen for complete carbon fixation pathways. The presence of a full pathway (e.g., all genes of the Calvin-Benson-Bassham cycle) is a minimum prerequisite.
- Contextual Gene Analysis: Assess the genomic context. The co-localization of carbon fixation genes with light-harvesting genes (e.g., proteorhodopsin) or inorganic electron transport chains (e.g., for Fe²⁺, S⁰ oxidation) strengthens the case for autotrophy.
- Expression Profiling: Conduct metatranscriptomic or metaproteomic analysis to confirm the expression of key autotrophic genes in situ [1]. The mere presence of genes is insufficient.
Stable Isotope Probing (SIP)
SIP provides direct evidence of inorganic carbon assimilation into biomass.
- Target: Quantify the incorporation of ¹³C-labeled bicarbonate into biomass.
- Protocol:
- Incubation: Incubate a microbial sample (enrichment culture, isolated cells, or filtered biomass) with ¹³C-labeled sodium bicarbonate (e.g., 1-5 mM final concentration) in a minimal medium. Crucially, the medium must contain no organic carbon sources to rule out heterotrophic uptake of minerogenic CO₂.
- Control: Run a parallel incubation with ¹²C-bicarbonate.
- Incubation Conditions: Maintain conditions (temperature, light, pressure) that are environmentally relevant to the source organism.
- Biomass Recovery & Analysis: After incubation, collect cells by filtration. Analyze the isotopic enrichment of bulk biomass or specific biomarkers (like phospholipid-derived fatty acids, DNA/RNA) using Isotope-Ratio Mass Spectrometry (IRMS) or Nanoscale Secondary Ion Mass Spectrometry (NanoSIMS) for single-cell resolution [58].
Cultivation-Based Assays
Pure culture or highly enriched culture studies remain the gold standard for validating autotrophy.
- Target: Demonstrate growth with CO₂ as the sole carbon source.
- Protocol:
- Medium Design: Prepare a strictly inorganic mineral medium. A carbon-free base is supplemented with bicarbonate (e.g., 10-30 mM NaHCO₃) as the sole carbon source. The gas headspace should be air or a CO₂-enriched mix (e.g., 5% CO₂).
- Growth Monitoring: Track growth over multiple serial transfers into fresh inorganic medium using cell counts (e.g., flow cytometry [59]), protein content, or optical density. A consistent increase in biomass confirms autotrophic potential.
- Control for Contamination: Include controls with added organic carbon (e.g., acetate, pyruvate) to test for heterotrophic growth. The absence of growth in the inorganic medium but growth in the organic-amended medium indicates obligate heterotrophy.
- Advanced Cultivation: For fastidious organisms, consider diffusion chambers or co-culture with other bacteria that may provide essential growth factors without providing a carbon source [60].
The following workflow diagram illustrates the integration of these key methodological approaches:
The Scientist's Toolkit: Essential Research Reagents and Materials
Successful differentiation of trophic strategies relies on specific reagents and instruments. Key materials for these experiments are listed below.
Table 2: Essential Reagents and Materials for Autotrophy Research
| Item | Function/Application | Example Use Case |
|---|---|---|
| ¹³C-Labeled Sodium Bicarbonate | Tracer for inorganic carbon assimilation in SIP experiments. | Quantifying CO₂ fixation rates in Marinisomatota enrichments. |
| Inorganic Mineral Medium | Provides essential nutrients without organic carbon for cultivation assays. | Formulating a medium to test for autotrophic growth of a novel isolate. |
| Sterivex (0.22 µm) Cartridge Filters | For concentrating microbial biomass from large water volumes for DNA/SIP. | Collecting biomass from oligotrophic ocean waters for metagenomics [61]. |
| DNA/RNA Isolation Kits (PowerSoil, etc.) | Nucleic acid extraction from environmental samples and cultures. | Preparing template for 16S rRNA amplicon or metagenomic sequencing. |
| Flow Cytometer | For precise cell counting and sorting to monitor growth or assess purity. | Tracking population growth in autotrophic cultivation experiments [59]. |
| NanoSIMS | Provides high-resolution imaging and quantification of isotopic labels at the single-cell level. | Confirming ¹³C-bicarbonate incorporation into individual Marinisomatota cells. |
| Metagenomic Assembly & Annotation Software (e.g., anvi'o, GTDB-Tk) | Reconstruction of MAGs and functional profiling. | Identifying carbon fixation pathway genes in Marinisomatota genomes [1] [4]. |
Case Study: Application to Marinisomatota
The global distribution and ecological success of Marinisomatota have long been enigmatic. Applying the above framework has been pivotal in redefining their functional diversity.
- Genomic Evidence: Analysis of 1,588 Marinisomatota genomes revealed three distinct metabolic strategies: MS0 (possessing photoautotrophic potential via proteorhodopsin and CAM-like carbon fixation genes), MS1 (heterotrophic with strong glycolytic pathways), and MS2 (heterotrophic without glycolysis) [1]. This genomic diversity immediately signals that the phylum cannot be classified under a single trophic mode.
- Ecological Interpretation: The presence of light-harvesting and carbon fixation genes in the MS0 group suggests a mixotrophic lifestyle. This is hypothesized as an adaptation to nutrient-limited oceans, where the ability to harness light energy can supplement heterotrophic carbon acquisition, providing a competitive advantage in the deep chlorophyll maximum where light is dim but organic carbon is scarce [1]. True autotrophy (obligate dependence on this pathway) remains unconfirmed.
- Research Imperative: This case highlights the necessity of moving beyond genomic prediction to experimental validation. Future work must employ SIP and targeted cultivation of MS0 Marinisomatota to determine if they can indeed function as true autotrophs or if their autotrophic genes serve a different physiological purpose.
The following diagram summarizes the metabolic strategies identified within the Marinisomatota phylum and the key genes used for their classification:
Differentiating true autotrophy from heterotrophy, especially in versatile phyla like Marinisomatota, requires a rigorous, multi-pronged investigative framework. Reliance on any single line of evidence is insufficient. Genomic predictions must be validated by direct measurement of metabolic activity via SIP and cultivation. The application of this integrated approach is reshaping our understanding of the ocean's carbon cycle, revealing a world of microbial metabolic complexity where mixotrophy may be a key strategy for survival and success. For Marinisomatota, the confirmed presence of multiple metabolic strategies within the phylum underscores the importance of species- and strain-level analysis to accurately define their role in marine ecosystem function and biogeochemical processes [1] [62].
Strategies for Isolating and Maintaining Pure Cultures in the Lab
The phylum Marinisomatota (formerly known as Marinimicrobia, Marine Group A, and SAR406) represents a ubiquitous and abundant group of microorganisms in marine ecosystems, yet remains largely uncultured and physiologically enigmatic [2] [1]. Genomic analyses suggest they play significant roles in global biogeochemical cycles, with recent metagenomic studies revealing astonishing diversity—1,588 genomes representing 14 families, 31 genera, and 67 species, with relative abundances reaching up to 36.21% in low-latitude marine regions [1]. Despite this pervasive presence, a profound gap exists between their detected genomic diversity and our ability to cultivate them in laboratory settings, limiting our understanding of their functional roles in ocean ecosystems.
Closing this gap through advanced isolation and maintenance strategies is imperative for a comprehensive thesis on the functional diversity of Marinisomatota. While genomic data can predict metabolic potential, only through pure culture experimentation can researchers validate these predictions, elucidate physiological capabilities, and understand the complex interactions that define their ecological niches. This guide provides detailed methodologies for isolating and maintaining pure cultures of fastidious marine microorganisms, with specific application to Marinisomatota, enabling researchers to bridge the divide between genomic predictions and physiological reality.
Physiological Background and Ecological Context of Marinisomatota
Understanding the metabolic capabilities and environmental preferences of Marinisomatota is foundational to developing successful isolation strategies. Current knowledge, derived primarily from metagenome-assembled genomes (MAGs), indicates this group exhibits remarkable metabolic plasticity. Three distinct metabolic strategies have been identified: MS0 (photoautotrophic potential), MS1 (heterotrophic with pronounced glycolytic pathway), and MS2 (heterotrophic without glycolysis) [1]. This metabolic diversity likely explains their success across diverse marine habitats, from the photic zone to the deep sea.
Certain Marinisomatota families, including S15-B10, TCS55, UBA1611, UBA2128, and UBA8226, possess genetic potential for light-dependent processes associated with Crassulacean acid metabolism [1]. This suggests some lineages may employ a mixotrophic strategy, combining heterotrophic and phototrophic capabilities—a crucial consideration when designing cultivation media and conditions. Their distribution patterns indicate adaptation to specific environmental gradients, with depth, nutrient availability, and light penetration serving as key selective factors [2].
The historical difficulty in cultivating Marinisomatota and similar marine lineages stems from our incomplete understanding of their specific nutritional requirements, symbiotic dependencies, and sensitivity to oxygen and pressure changes. Furthermore, many marine microorganisms exist in a state of metabolic dormancy or require specific signaling compounds for activation, making traditional cultivation approaches insufficient [63]. The strategies outlined below address these challenges through targeted, ecologically-informed approaches.
Sample Collection and Preservation Strategies
Proper collection and preservation of environmental samples is the critical first step in any isolation campaign, as it preserves community structure and viability for subsequent cultivation efforts.
Table 1: Comparison of Sample Preservation Methods for Microbial Diversity Studies
| Preservation Method | Impact on Microbial Diversity | Impact on Community Structure | Recommended Storage Duration | Best Use Cases |
|---|---|---|---|---|
| Dry Ice (+ subsequent -80°C) | Minimal impact | Minimal impact | 1 day on dry ice + 5 days at -80°C | Field collections, shipping |
| Liquid Nitrogen (+ subsequent -80°C) | Minimal impact | Minimal impact | 1 day in LN₂ + 5 days at -80°C | Critical samples, long-term viability |
| Freezing at -20°C | Moderate to high impact | Altered community structure | Not recommended beyond 3 days | Temporary holding only |
| Refrigeration at 4°C | Moderate to high impact | Altered community structure, especially rare taxa | Not recommended beyond 3 days | Short-term transport |
For intestinal microbiota of marine fishes, which can serve as a model for host-associated Marinisomatota, dry ice and liquid nitrogen methods with subsequent transfer to -80°C storage demonstrated the least impact on microbial diversity and community structure [64]. Refrigeration at 4°C and freezing at -20°C resulted in suboptimal reproducibility and significantly altered community structure, particularly affecting rare microbial taxa [64]. These findings are applicable to sediment and water column sampling for Marinisomatota, as maintaining the integrity of rare community members is essential for isolating representatives of this typically low-abundance phylum.
Sample Collection Protocol for Marine Sediments
- Sample Using Cores: Collect sediment samples using push corers or box corers to maintain stratigraphic integrity. For hydrothermal sediments as in Guaymas Basin, samples are typically collected from multiple horizons (e.g., 0–2 cm, 3–4 cm, and 5–10 cm below seafloor) [5].
- Anoxic Preservation: Immediately transfer samples into wide-mouth glass bottles with minimal headspace to preserve anaerobic conditions crucial for many Marinisomatota lineages.
- Temperature Control: Maintain samples at in situ temperature during transport using insulated containers. For deep-sea samples, this may require cooling rather than warming.
- Rapid Processing: Begin isolation procedures within 24 hours of sample collection whenever possible, even when using optimal preservation methods.
Isolation Techniques and Cultivation Strategies
Enrichment Strategies
Strategic enrichment cultures can significantly increase the relative abundance of target organisms, making subsequent isolation feasible. For previously uncultured groups like Gaopeijiales (a marine lineage of Gemmatimonadota), aerobic enrichment successfully increased relative abundance from 0.37% in the original sample to 2.6% in the enrichment culture [63].
Table 2: Enrichment Culture Formulations for Targeting Different Metabolic Groups
| Target Metabolism | Carbon Source | Electron Acceptor | Incubation Temperature | Key Additives | Potential Marinisomatota Group |
|---|---|---|---|---|---|
| Heterotrophic Polysaccharide Degraders | Mix of polysaccharides (chitin, cellulose, pectin, alginate) | Sulfate or oxygen | 15-25°C (mesophilic) | Vitamin mix, trace elements | Families with multiple CAZymes [5] |
| Heterotrophic Protein Degraders | Bovine Serum Albumin (BSA) | Sulfate or oxygen | 15-25°C (mesophilic) | Vitamin mix, trace elements | Putative peptide transporters |
| Mixotrophic Types | Bicarbonate + organic acids | Oxygen (microaerophilic) | 15-25°C (mesophilic) | Vitamin mix, neutral density filters | MS0-type Marinisomatota [1] |
| Hadal Zone Adaptations | Aromatic compounds + lipids | Sulfate or nitrate | 4-10°C (psychrophilic) | Antioxidants, pressure vessels | Deep-sea adapted lineages |
For hydrothermal sediments, such as those from Guaymas Basin, successful enrichment cultures have been established at 60°C for 4 weeks under oxic, sulfate-reducing, and fermentative conditions [5]. However, for most Marinisomatota, moderate temperatures (15-25°C) are more appropriate, reflecting their typical pelagic and mesophilic habitats.
Direct Isolation Methods
Aerobic Enrichment and Dilution-to-Extinction Protocol:
Preparation of Inoculum:
- Create sediment slurries using a 1:10 ratio of sediment to anoxic artificial seawater medium [5].
- For water column samples, concentrate cells via gentle filtration (0.22 µm filters) and resuspend in sterile medium.
Medium Formulation:
- Base saltwater medium should mimic natural seawater composition.
- Include a carbon source cocktail reflecting Marinisomatota's predicted capabilities: combinations of polysaccharides (chitin, cellulose, pectin), organic acids (acetate, pyruvate), and bicarbonate [5] [1].
- Add vitamin and trace element supplements, as marine oligotrophs often require specific growth factors.
Enrichment Incubation:
- Incubate under a range of oxygen conditions (oxic, microaerophilic, anoxic) to capture different metabolic types.
- Use low nutrient concentrations (typical of marine environments) to avoid favoring fast-growing generalists.
Dilution-to-Extinction:
- Serially dilute enriched cultures in fresh medium (typically 10-fold serial dilutions).
- Dispense into multi-well plates (96-well format is efficient).
- Incubate for 4-12 weeks, monitoring for growth via turbidity or microscopic examination.
Purity Assessment:
- Use phase-contrast microscopy to check for morphological uniformity.
- Employ 16S rRNA gene sequencing to confirm culture purity.
- Use BOX-PCR profiling to genetically distinguish closely related strains [63].
High-Throughput Isolation Using Automated Systems
For processing large sample sets, automated systems can significantly improve isolation efficiency:
- Robotic Liquid Handling: Systems like the ROTOR robot (Singer Instrument Company) can perform high-throughput sample transfer, picking, and arraying in multi-well formats [65].
- Arrayed Culture Libraries: Cultures can be arrayed in 96-, 384-, or 1536-well format in multi-well plates containing liquid media or solid agar [65].
- High-Throughput Imaging: The Strain Library Imaging Protocol (SLIP) enables automated microscopy of large strain collections, with image acquisition completed within 4 minutes per 96-well plate [65].
Maintenance and Preservation of Pure Cultures
Optimal Growth Conditions for Marinisomatota
Based on related marine isolates and genomic predictions, Marinisomatota likely require specific conditions for long-term maintenance:
- Salinity: Most marine isolates require at least 1% (wt/vol) NaCl, with optimum growth at 3% (wt/vol) NaCl, similar to the novel Gaopeijiales strains which tolerated up to 7-8% NaCl [63].
- Temperature: Based on their distribution, most Marinisomatota likely prefer mesophilic temperatures (15-25°C), though some deep-sea lineages may require cooler temperatures (4-10°C).
- Oxygen Conditions: Marinisomatota likely include aerobic, microaerophilic, and anaerobic representatives. The recently isolated Gaopeijiales strains grew under aerobic and microaerophilic (8-9% O₂) conditions, but not under strict anaerobiosis [63].
- Pressure: For deep-sea isolates, consider using pressure reactors to maintain in situ pressure conditions, as this can significantly impact growth and metabolism.
Long-Term Preservation Methods
Cryopreservation at -80°C:
- Prepare cryoprotectant medium containing 10-15% glycerol or DMSO in growth medium.
- Mix exponentially growing culture with cryoprotectant in equal volumes.
- Use controlled-rate freezing when possible (cooling at approximately 1°C per minute to -40°C, then transfer to -80°C).
- For long-term storage, maintain at -80°C or in liquid nitrogen vapor phase.
Lyophilization:
- Suspend cells in a lyoprotectant such as skim milk (10-20%) or sucrose (10-12%).
- Flash-freeze in liquid nitrogen.
- Lyophilize for 24-48 hours.
- Seal under vacuum and store at 4°C or -20°C.
Characterization and Validation of Pure Cultures
Morphological and Phenotypic Characterization
Cell Imaging Techniques:
- Phase Contrast Microscopy: Useful for basic morphological assessment of live cells without staining [66].
- Ptychography: A label-free, high-contrast imaging technique that provides quantitative phase information, particularly suitable for reporting cellular changes such as mitosis, apoptosis, and differentiation [66].
- Electron Microscopy: For detailed ultrastructural analysis of cell morphology and surface features.
Phenotypic Microarrays:
- Test carbon source utilization profiles using BIOLOG plates or similar systems.
- Determine temperature, pH, and salinity ranges for growth.
- Test susceptibility to various antibiotics to establish genetic manipulation potential.
Genetic Validation and Monitoring
- 16S rRNA Gene Sequencing: Confirm phylogenetic placement and culture purity.
- BOX-PCR Profiling: Generate strain-specific fingerprints to distinguish closely related isolates and monitor culture stability [63].
- Whole Genome Sequencing: Essential for confirming the identity of isolates and linking them to metagenomic data.
Essential Research Reagents and Equipment
Table 3: Research Reagent Solutions for Marine Microbial Cultivation
| Reagent/Equipment | Function | Application Example | Specific Considerations |
|---|---|---|---|
| Anoxic Artificial Seawater Medium | Base medium for isolation | Creating sediment slurries and dilution series | Must be prepared anoxically with resazurin as redox indicator [5] |
| Polysaccharide Cocktail | Carbon source for heterotrophs | Enriching polysaccharide-degrading Marinisomatota | Include chitin, cellulose, pectin, alginate, chondroitin [5] |
| Vitamin and Trace Element Supplements | Essential cofactors | All cultivation attempts for oligotrophic marine bacteria | Critical for growth of fastidious marine microorganisms |
| 96-Pin Replicators | High-throughput transfer | Inoculating large format agar plates | Enables processing of multiple samples simultaneously [65] |
| Large Agar Pads | Substrate for single-cell imaging | SLIP protocol for high-throughput microscopy | Same size as multi-well plates for efficient transfer [65] |
| TTL Signal Control System | Hardware communication | Automated microscopy acquisition | Reduces stage movement time by >80% [65] |
Successfully isolating and maintaining pure cultures of Marinisomatota requires an integrated approach that combines ecologically-informed cultivation strategies with modern genomic tools. By using environmental genomic data to predict metabolic capabilities and environmental preferences, researchers can design targeted isolation strategies that specifically enrich for these elusive microorganisms. Once isolated, maintaining these cultures requires careful attention to their specific physiological requirements, particularly regarding salinity, oxygen tension, and nutrient concentrations.
The ability to cultivate Marinisomatota in pure culture will dramatically advance our understanding of their functional roles in marine ecosystems, allowing researchers to move beyond genomic predictions to physiological validation. This technical guide provides the foundational methodologies necessary to achieve this goal, contributing essential tools for a comprehensive thesis on the functional diversity of Marinisomatota in ocean ecosystems.
Experimental Workflow Diagram
Marinisomatota Isolation Workflow
Interpreting Ecological Niche Based on Genomic Potential vs. Expression Data
The ecological niche of a microorganism represents the total set of biological and environmental conditions where it can maintain stable population sizes. Traditional microbial ecology relied on taxonomic classifications from 16S rRNA gene surveys, which provided limited functional insights. The advent of omics technologies has revolutionized this paradigm by enabling researchers to move beyond mere presence/absence data to understand functional potential (genomic capacity encoded in DNA) and functional expression (active processes revealed via RNA and proteins).
This distinction is particularly crucial for understanding the ecology of ubiquitous marine bacterial phyla like Marinisomatota (formerly Marinimicrobia, Marine Group A, SAR406), which thrive across diverse oceanic zones from sunlit surface waters to the deep aphotic zone [2]. For such widely distributed taxa, genomic potential often reveals a broad metabolic capability, while expression data uncovers the specific strategies employed in response to local environmental conditions. Framing niche interpretation through this dual-lens approach provides unprecedented resolution into the mechanisms driving microbial community assembly and ecosystem function, ultimately illuminating the functional diversity of Marinisomatota in global ocean ecosystems.
Methodological Framework: From Samples to Ecological Inference
Core Experimental Workflows
A robust analysis integrating genomic potential and expression data involves a multi-stage process, from sample collection to ecological modeling. The workflow below outlines the primary pathways for niche interpretation.
Diagram 1: Integrated workflow for niche interpretation from genomic and transcriptomic data.
The Scientist's Toolkit: Essential Research Reagents and Materials
Successful implementation of the workflow depends on specific laboratory and computational tools. The following table catalogs key reagents, software, and their functions critical for marine microbialomics studies.
Table 1: Essential Research Reagents and Computational Tools
| Category/Item | Specific Examples | Function/Application |
|---|---|---|
| DNA/RNA Extraction Kit | DNeasy PowerSoil Kit (Qiagen) [67] | Standardized isolation of high-quality genomic DNA and total RNA from diverse marine samples (water, biofilm). |
| Library Prep Kits | Illumina DNA Prep, Illumina RNA Prep | Preparation of sequencing libraries for next-generation platforms like Illumina NovaSeq. |
| Sequencing Platform | Illumina NovaSeq [67] | High-throughput generation of metagenomic and metatranscriptomic short-read data (e.g., 150 bp paired-end). |
| Assembly Software | MEGAHIT [67] | De novo assembly of quality-filtered sequencing reads into longer contiguous sequences (contigs). |
| Binning Tool | MaxBin2 [67] | Clustering of contigs into Metagenome-Assembled Genomes (MAGs) based on sequence composition and abundance. |
| Quality Assessment | CheckM [67] | Evaluation of MAG completeness and contamination using conserved single-copy marker genes. |
| Taxonomic Classifier | GTDB-Tk [67] | Accurate taxonomic assignment of MAGs against the Genome Taxonomy Database (GTDB). |
| Functional Annotator | Prokka [67] | Rapid annotation of coding sequences (CDS) within MAGs, identifying protein-coding genes, rRNAs, and tRNAs. |
| Abundance Profiler | CoverM [67] | Calculation of MAG abundance (read coverage) across different samples. |
Data Integration and Interpretation: Contrasting Potential with Activity
Conceptual Framework for Niche Interpretation
The core challenge lies in synthesizing genomic and transcriptomic data into a coherent ecological narrative. The following conceptual diagram illustrates the relationship between a population's total genomic potential and its expressed niche in a given environment.
Diagram 2: The realized niche is formed when environmental filters shape gene expression from the total genomic potential.
Case Study: Metabolic Strategies in Widespread Marinisomatota
A 2025 study on Marinisomatota exemplifies this approach. Metagenomic analysis of 1,588 genomes revealed a broad genomic potential for diverse metabolic strategies, from photoautotrophy to heterotrophy [2]. However, metatranscriptomic data was crucial for identifying three distinct, active metabolic strategies (MS0, MS1, MS2) and understanding their distribution across different oceanic provinces. This integration showed how populations with similar genomic potential functionally diverge to occupy specific niches.
Table 2: Quantitative Comparison of Marinisomatota Metabolic Strategies [2]
| Metabolic Strategy | Defining Genomic Potential | Key Expressed Functions (RNA) | Relative Abundance Range | Inferred Ecological Niche |
|---|---|---|---|---|
| MS0 | Genes for light-dependent processes (Crassulacean acid metabolism, M00169) | Expression of proteorhodopsin and CO₂ fixation genes | 0.18% to 36.21% | Mixotrophic; dominant in the translucent ocean zone |
| MS1 | Full glycolytic pathway | High expression of glycolytic enzymes | Not Specified | Heterotrophic; specialized in carbon processing in nutrient-rich zones |
| MS2 | Incomplete glycolytic pathway | Expression of alternative carbon catabolism pathways | Not Specified | Heterotrophic; adapted to nutrient-poor or aphotic zones |
The data in Table 2 demonstrates a clear niche partitioning based on expressed function. While many Marinisomatota genomes hold the genetic blueprint for light utilization (genomic potential), only the MS0 group significantly expresses these genes in the photic zone, thereby realizing a distinct mixotrophic niche [2].
Advanced Modeling: Integrating Genomics with Environmental Gradients
Cutting-edge research further incorporates these data into models predicting responses to environmental change. The genomic offset metric quantifies the genetic mismatch a population may face under future climate scenarios by analyzing genotype-environment associations [68]. This can be coupled with niche suitability models based on current distribution. For example, cold-tolerant bird populations showed higher genomic offset but less niche suitability decline under future climates than warm-tolerant ones, revealing complex vulnerability patterns [68]. This genome-niche framework is directly applicable to marine microbes, allowing researchers to predict which Marinisomatota populations are most vulnerable to ocean warming or deoxygenation.
Detailed Experimental Protocols
Metagenomic Assembly and Binning for Genomic Potential
This protocol is adapted from methodologies used in recent studies of engineered and natural microbial systems [67].
- Quality Control and Sequencing: Generate 150-bp paired-end reads on an Illumina NovaSeq platform. Quality-trim raw reads using tools like Trimmomatic or Fastp to remove adapters and low-quality sequences.
- Co-assembly: Assemble the high-quality reads from all samples co-assembled or individual-assembled using MEGAHIT [67]. Retain contigs longer than 1000 bp for downstream analysis.
- Bin Metagenome-Assembled Genomes (MAGs): Bin contigs from each sample into MAGs using a tool like MaxBin2 [67]. This leverages sequence composition and sample abundance.
- Assess MAG Quality: Use CheckM to estimate the completeness and contamination of each MAG [67]. Retain only high-quality (completeness >90%, contamination <5%) and medium-quality (completeness >50%, contamination <5%) MAGs as per current community standards [67].
- Dereplication: Cluster MAGs from across all samples using dRep to obtain a non-redundant set of representative MAGs (rMAGs). A common threshold is 99% average nucleotide identity for secondary clustering [67].
Metatranscriptomic Analysis for Gene Expression
- RNA Extraction and Library Preparation: Extract total RNA from biomass filters. Remove ribosomal RNA (rRNA) from the total RNA sample using a depletion kit. Synthesize cDNA and prepare sequencing libraries for Illumina sequencing.
- Read Mapping and Quantification: Map the quality-controlled metatranscriptomic reads to the catalog of genes predicted from the MAGs (the "functional annotation" from Table 1). Use a tool like Salmon or HTSeq to quantify the number of reads mapping to each gene.
- Normalization and Expression Profiling: Normalize read counts to account for gene length and total library size (e.g., calculating TPM - Transcripts Per Million). This creates a gene expression profile for each sample, indicating which metabolic pathways are actively being transcribed.
Genomic Offset Calculation for Climate Vulnerability
This protocol, adapted from genomic studies on macro-organisms, provides a framework for forecasting microbial vulnerability [68].
- Genotype-Environment Association: Use a machine-learning method like gradientForest to identify SNPs in the rMAGs that are significantly associated with current spatial gradients in environmental variables (e.g., temperature, nutrient concentrations) [68].
- Build a Prediction Model: The algorithm learns a function that transforms the multidimensional environmental space into a multidimensional genetic space (allele frequencies).
- Project Future Genomic Mismatch: Use the trained model to predict the expected genetic composition under future climate scenarios (e.g., RCP 4.5 or 8.5 for 2050/2070). The genomic offset is calculated as the Euclidean distance between the current and future predicted genetic compositions for a given location, representing the amount of genetic adaptation required for population persistence [68].
Validating Functional Roles: How Marinisomatota Compare to Other Key Marine Microbes
Marine mixotrophy, the combination of autotrophic and heterotrophic metabolic strategies within a single organism, represents a critical adaptation for survival in nutrient-limited oceanic environments. This whitepaper examines the functional diversity of Marinisomatota (formerly known as Marinimicrobia, Marine Group A, and SAR406) in comparison with other mixotrophic marine bacteria. Through analysis of recent global-scale metagenomic studies and experimental data, we reveal the unique metabolic plasticity and ecological distribution of Marinisomatota, identifying three distinct metabolic modes (MS0, MS1, MS2) that demonstrate evolutionary adaptations to oceanic nutrient gradients. The implications of these findings for understanding microbial ecosystem functioning and potential biotechnological applications are discussed within the framework of ocean ecosystem research.
The functional diversity of marine microorganisms underpins global biogeochemical cycles and ecosystem stability. Within this framework, Marinisomatota have emerged as a ubiquitous and abundant group in global oceans, traditionally characterized as heterotrophic microorganisms but recently revealed to possess remarkable metabolic versatility [2]. These organisms inhabit a wide range of marine environments, from surface waters to the deep ocean, with relative abundances ranging from 0.18% to 36.21% across different oceanic provinces [2].
Mixotrophy represents a strategic advantage in the marine environment, allowing organisms to adapt to fluctuating nutrient conditions by combining carbon fixation through autotrophic processes with organic carbon assimilation through heterotrophic nutrition. While multiple bacterial lineages have developed mixotrophic capabilities, Marinisomatota exhibit particularly sophisticated adaptations that enable their persistence across diverse marine habitats, from the sunlit translucent zone to the dark aphotic layers of the ocean [2]. Understanding the contrasting lifestyles between Marinisomatota and other mixotrophic marine bacteria provides critical insights into the microbial mechanisms driving carbon and energy flow in ocean ecosystems.
Marinisomatota: Ecological Distribution and Metabolic Diversity
Taxonomic Diversity and Genomic Features
Recent large-scale metagenomic studies have dramatically expanded our understanding of Marinisomatota diversity. A 2025 analysis reconstructed 1,588 Marinisomatota genomes from global ocean datasets, representing substantial diversity including one class, two orders, 14 families, 31 genera, and 67 species [2]. This taxonomic breadth underscores the evolutionary success of this group and highlights their significant genetic potential for diverse metabolic functions.
The genomic features of Marinisomatota reveal adaptations to their marine habitats. Among the 14 families identified, five (S15-B10, TCS55, UBA1611, UBA2128, and UBA8226) exhibit genetic potential for light-dependent processes associated with Crassulacean acid metabolism (M00169) [2]. This metabolic capability represents a key differentiator from other marine mixotrophic bacteria and enables Marinisomatota to occupy unique ecological niches.
Distinct Metabolic Strategies
Research has identified three distinct metabolic strategies within Marinisomatota populations, demonstrating a spectrum of trophic adaptations:
Table 1: Metabolic Strategies in Marinisomatota
| Metabolic Strategy | Trophic Mode | Key Characteristics | Ecological Distribution |
|---|---|---|---|
| MS0 | Photoautotrophic potential | Capable of light-dependent carbon fixation | Primarily in translucent zone |
| MS1 | Heterotrophic with enhanced glycolytic capacity | Pronounced glycolytic pathway; versatile energy generation | Transition zones between translucent and aphotic layers |
| MS2 | Heterotrophic without glycolysis | Relies on alternative energy-yielding pathways | Predominantly in aphotic zones |
The MS0 strategy represents Marinisomatota with photoautotrophic potential, capable of harnessing light for carbon dioxide fixation and organic compound synthesis [2]. These organisms predominantly inhabit the translucent zone of the ocean where light penetration supports their energy needs. The MS1 strategy describes heterotrophic Marinisomatota with pronounced glycolytic capacity, enabling efficient processing of organic carbon sources while potentially maintaining limited autotrophic capabilities [2]. Finally, the MS2 strategy comprises heterotrophic organisms without glycolysis, relying instead on alternative metabolic pathways for energy generation in nutrient-limited environments [2].
The emergence of these distinct metabolic strategies likely represents an evolutionary response to nutrient limitations within oceanic environments, allowing Marinisomatota to exploit varied ecological niches across depth gradients and water masses [2].
Comparative Analysis: Marinisomatota vs. Other Mixotrophic Marine Bacteria
Metabolic Pathway Specialization
When compared to other mixotrophic marine bacteria, Marinisomatota exhibit distinct metabolic specializations that define their ecological roles:
Table 2: Metabolic Comparison of Marinisomatota with Other Mixotrophic Marine Bacteria
| Characteristic | Marinisomatota | Other Mixotrophic Marine Bacteria |
|---|---|---|
| Primary Autotrophic Mechanism | Crassulacean acid metabolism (M00169) in specific families [2] | Diverse mechanisms including proteorhodopsin-based systems, anoxygenic photosynthesis |
| Carbon Fixation Pathways | Light-dependent CO₂ fixation in MS0 type [2] | Multiple pathways including Calvin cycle, reverse TCA cycle |
| Heterotrophic Capabilities | Ranges from glycolytic (MS1) to non-glycolytic (MS2) strategies [2] | Typically specialized for specific organic substrate groups |
| Environmental Distribution | Low-latitude marine regions, relative abundance 0.18-36.21% [2] | Varies by taxonomic group; often more restricted distribution |
| Genomic Features | 1,588 genomes representing substantial diversity [2] | Variable genome sizes and coding density |
Unlike many other mixotrophic bacteria that employ proteorhodopsin-based light energy capture or anoxygenic photosynthesis, Marinisomatota utilize Crassulacean acid metabolism (CAM)-like pathways in specific families, representing a unique adaptation within marine bacterial communities [2]. This metabolic distinction potentially provides competitive advantages in specific oceanic environments where traditional photosynthetic mechanisms are less efficient.
Ecological Niches and Biogeographic Patterns
Marinisomatota demonstrate distinct biogeographic patterns compared to other mixotrophic bacteria. They are predominantly found in low-latitude marine regions with specific adaptations to different depth zones [2]. Their distribution contrasts with other mixotrophic groups that may show more restricted geographic ranges or depth preferences.
Evidence from studies of isolated marine environments further highlights the unique position of Marinisomatota. Beneath the Ross Ice Shelf, a dark, oligotrophic environment, Marinisomatota were identified among the dominant microbial community members, alongside Proteobacteria, SAR324, Crenarchaeota, Chloroflexota, and Planctomycetota [25]. This presence in an extreme environment underscores their metabolic versatility and ability to thrive in habitats where traditional photosynthetic mixotrophs cannot persist.
Methodological Approaches: Experimental Protocols for Studying Marine Mixotrophy
Genomic Reconstruction and Metabolic Inference
The investigation of Marinisomatota metabolic strategies relies on sophisticated genomic approaches:
Figure 1: Workflow for Genomic Reconstruction of Metabolic Strategies
Sample Collection and Processing:
- Environmental samples collected across depth gradients (surface to bathypelagic) and geographic regions
- Filtration through sequential size fractions (0.2-0.8 μm for free-living; 0.8-20 μm for particle-attached) to capture different ecological niches [69]
- DNA extraction using optimized protocols for microbial community DNA preservation
Metagenomic Sequencing and Assembly:
- High-throughput sequencing using Illumina or PacBio platforms
- Assembly of sequencing reads into contigs using metaSPAdes or similar assemblers
- Bin extraction and refinement to obtain metagenome-assembled genomes (MAGs) [70]
- Quality assessment based on completeness (<82.33% average), contamination (<1.79% potential), and strain heterogeneity [70]
Metabolic Inference:
- Taxonomic classification against Genome Taxonomy Database (GTDB)
- Functional annotation using KEGG, Pfam, and custom databases
- Identification of key metabolic markers: Crassulacean acid metabolism genes, glycolytic pathway components, and electron transport chain genes [2]
- Metatranscriptomic analysis to validate gene expression and metabolic activity [2]
Computational Host Prediction for Viral Interactions
Understanding virus-host interactions provides insights into microbial ecology and metabolic constraints:
Figure 2: Host Prediction Methodology for Viral Ecology
This approach has revealed specific virus-host associations, with 39 viral sequences linked to Marinisomatota hosts in bathypelagic ecosystems [69]. These interactions influence microbial community structure and metabolic functioning through the transfer of auxiliary metabolic genes (AMGs).
Table 3: Key Research Reagents and Computational Tools for Studying Marine Mixotrophy
| Resource Category | Specific Tools/Reagents | Application/Function |
|---|---|---|
| Sequencing Technologies | Illumina NovaSeq, PacBio Sequel, Oxford Nanopore | High-throughput DNA sequencing for metagenomic and metatranscriptomic analysis |
| Bioinformatics Tools | GTDB-Tk, CheckV, VIBRANT, PHIST | Taxonomic classification, viral genome quality assessment, host prediction [69] |
| Reference Databases | GTDB, KEGG, Pfam, UniRef | Functional annotation and metabolic pathway inference [2] |
| Cultivation Media | Modified low-nutrient media, diffusion-based chambers | Isolation of previously uncultured marine bacteria [56] |
| Analytical Tools | VIBRANT, CheckV, PHIST | Viral identification, quality assessment, and host prediction [69] |
Research Implications and Future Directions
The functional diversity of Marinisomatota has significant implications for understanding ocean ecosystem dynamics. Their metabolic versatility contributes to carbon cycling across depth gradients, potentially influencing carbon export efficiency and nutrient remineralization in the deep ocean [2]. The distinct metabolic strategies (MS0, MS1, MS2) represent adaptations to specific ecological niches, allowing Marinisomatota to persist across a range of marine environments.
Future research should focus on several critical areas:
- Cultivation of representative strains to validate metabolic predictions through physiological experiments
- Integration of multi-omics data (genomics, transcriptomics, proteomics, metabolomics) to build comprehensive models of metabolic networks
- Investigation of viral influences on Marinisomatota metabolism and evolution through analysis of auxiliary metabolic genes
- Expansion of biogeographic sampling to include underrepresented ocean regions and depth zones
The contrasting lifestyles of Marinisomatota compared to other mixotrophic marine bacteria highlight the complexity of microbial interactions in ocean ecosystems and underscore the need for continued research into the functional diversity of marine microorganisms.
Functional Redundancy and Uniqueness in the Marine Microbial Web
The concept of functional redundancy has long served as a foundational principle in marine microbial ecology, positing that the ocean's tremendous microbial diversity masks a fundamental metabolic simplicity wherein different taxa perform identical biochemical roles [71] [72]. This paradigm has significantly influenced how scientists model biogeochemical cycles, project ecosystem responses to environmental change, and interpret the ecological significance of microbial diversity. The "paradox of the plankton"—how an apparently limited range of resources can support an unexpectedly large number of species—has often been resolved by invoking this principle of redundancy [72]. However, emerging genomic evidence now challenges this entrenched view, suggesting that the marine microbial web exhibits remarkable functional uniqueness, where taxonomic shifts produce consequential changes in ecosystem function [71]. This paradigm shift carries profound implications for predicting how ocean ecosystems will respond to anthropogenic pressures and climate change.
Within this reconceptualized framework, the Marinisomatota phylum (formerly known as Marinimicrobia, Marine Group A, and SAR406) emerges as a critical case study [2]. These ubiquitous and abundant microorganisms demonstrate how phylogenetic groups can exhibit substantial metabolic versatility, blurring the traditional boundaries between autotrophic and heterotrophic lifestyles and defying simple categorization. The functional diversity within this single phylum illustrates why a nuanced understanding of microbial ecology requires moving beyond broad assumptions of redundancy to appreciate the specialized adaptations and unique metabolic contributions of different taxa [8] [2]. This whitepaper synthesizes recent advances in our understanding of functional redundancy and uniqueness in marine microbial systems, with particular emphasis on Marinisomatota as a model for reevaluating ecosystem structure and function in ocean environments.
The Functional Redundancy Debate: From Theoretical Assumption to Empirical Testing
Defining the Spectrum of Redundancy
The debate over functional redundancy necessitates precise terminology. Strict functional redundancy describes the scenario where different microbial taxa share an identical set of metabolic functions and can readily replace one another without altering ecosystem processes [72]. In contrast, partial functional redundancy occurs when organisms share some specific functions but differ in others or in their ecological preferences (e.g., temperature optima, substrate affinities) [72]. Much of the historical assumption of redundancy in marine systems implicitly referred to strict redundancy, which provided a convenient simplification for modeling microbial contributions to biogeochemical cycles.
Evidence Challenging the Redundancy Paradigm
A landmark study directly tested the functional redundancy hypothesis by examining microbial communities across temporal and spatial scales in the northwestern Mediterranean Sea. The research revealed that shifts in taxonomic composition consistently altered the functional attributes of the communities, demonstrating that marine microbial diversity reflects a "tremendous diversity of microbial metabolism" rather than interchangeable parts [71] [72]. This finding fundamentally contradicts the notion of strict functional redundancy.
Crucially, this study employed a read-based metagenomic approach (using Commet software) that analyzed all sequencing reads rather than relying solely on annotated genes, thus capturing the full functional potential of the communities without bias toward known sequences [72]. When the researchers compared the functional profiles of different communities, they found strong coupling between taxonomic and functional composition, indicating that taxonomically distinct communities maintain distinct metabolic capabilities. This approach avoided the oversimplification inherent in methods that depend exclusively on reference databases, which are skewed toward cultured organisms and known functions [72].
Table 1: Key Evidence Challenging Strict Functional Redundancy in Marine Microbial Systems
| Evidence Type | Findings | Implications |
|---|---|---|
| Metagenomic Monitoring | Strong link between community composition and functional attributes across temporal and spatial scales [71] [72] | Taxonomic shifts alter ecosystem functioning, refuting strict redundancy |
| Protein Diversity | Diverse microbial communities harbor high diversity of potential proteins [72] | Marine microbial diversity reflects extensive metabolic innovation |
| Analytical Approach | Working with all metagenomic reads (not just annotated genes) revealed similarity between taxonomic and functional composition [72] | Previous studies relying on known genes may have overestimated redundancy |
Marinisomatota: A Case Study in Metabolic Versatility
Ecological Distribution and Genomic Diversity
Marinisomatota are ubiquitous and abundant in marine environments, with relative abundances ranging from 0.18% to 36.21% across low-latitude marine regions [2]. They inhabit diverse oceanic zones, from sunlit surface waters to the dark ocean interior, with certain members demonstrating capacity to harness light for carbon dioxide fixation while transitioning between photic and aphotic layers [2]. This ecological distribution across light and nutrient gradients has likely driven the evolutionary diversification observed within the phylum.
Recent genomic investigations have reconstructed 1,588 Marinisomatota genomes from global ocean datasets, revealing extensive phylogenetic diversity encompassing one class, two orders, 14 families, 31 genera, and 67 species [2]. Among these, families such as S15-B10, TCS55, UBA1611, UBA2128, and UBA8226 exhibit genetic potential for light-dependent processes associated with Crassulacean acid metabolism (M00169), challenging the traditional characterization of Marinisomatota as exclusively heterotrophic [2].
Distinct Metabolic Strategies and Niche Specialization
Detailed analysis of Marinisomatota genomes has identified three distinct metabolic modes, demonstrating how functional diversity enables niche specialization within a single phylum [2]:
MS0 (Photoautotrophic Potential): These lineages possess genetic machinery for light capture and carbon fixation, potentially enabling them to function as photoautotrophs under certain conditions.
MS1 (Heterotrophic with Enhanced Glycolytic Capacity): These heterotrophic specialists exhibit enhanced glycolytic pathways for carbon processing, likely specializing in the breakdown of organic matter.
MS2 (Heterotrophic without Glycolysis): These heterotrophs utilize alternative pathways for carbon metabolism, representing a distinct metabolic strategy from MS1 taxa.
The emergence of these specialized metabolic strategies likely represents an evolutionary response to nutrient limitation in oceanic ecosystems [2]. The coexistence of these functionally distinct types within the same phylum demonstrates that what might appear as redundancy at broad phylogenetic levels actually conceals significant functional specialization at finer taxonomic scales.
Table 2: Metabolic Strategies Identified in Marinisomatota [2]
| Metabolic Strategy | Key Characteristics | Ecological Advantages | Relative Distribution |
|---|---|---|---|
| MS0 | Photoautotrophic potential; capacity for light-dependent carbon fixation | Energy generation in light-limited environments; mixotrophic lifestyle | Predominant in regions with variable light conditions |
| MS1 | Heterotrophic with enhanced glycolytic capacity | Efficient organic carbon processing in nutrient-rich microzones | Widespread across nutrient gradients |
| MS2 | Heterotrophic without glycolysis; utilizes alternative pathways | Metabolic flexibility under energy limitation | Found in deeper water layers and oligotrophic regions |
Methodologies for Investigating Functional Diversity
Metagenomic and Metatranscriptomic Approaches
Comprehensive investigation of Marinisomatota metabolic strategies requires integrated genomic and transcriptomic methodologies [2]. The following workflow outlines the key experimental and analytical steps:
Sample Collection and Processing: Marine samples are collected across spatial, depth, and temporal gradients to capture environmental variability. Biomass is typically collected via filtration (e.g., 0.22-μm pore-size Sterivex cartridges) and stored at -80°C until nucleic acid extraction [72].
DNA Extraction and Sequencing: Nucleic acids are extracted using commercial kits (e.g., AllPrep DNA/RNA kit, Qiagen) with modifications for marine samples, potentially including lysozyme and proteinase K treatment for enhanced cell lysis [72] [73]. For metagenomic analysis, libraries are prepared using kits such as Nextera XT DNA Sample Preparation Kit and sequenced on platforms such as Illumina HiSeq (2×100 bp paired-end) [72].
Bioinformatic Processing: Quality-controlled reads are assembled into contigs using tools such as IDBA-UD or MEGAHIT [74] [72]. For Marinisomatota-specific investigations, genome reconstruction from metagenomic data involves binning procedures to recover population genomes. Gene prediction is performed on contigs using tools such as MetaGeneAnnotator or Prodigal, followed by functional annotation against databases such as eggNOG, KEGG, and specialized metabolic pathway databases [74] [72].
Metabolic Classification: Metabolic strategies are inferred through the presence and completeness of key metabolic pathways, including carbon fixation genes, photosynthetic machinery, and heterotrophic carbon processing pathways [2]. Transcriptomic data can further reveal actively expressed pathways under different environmental conditions.
Large-scale investigation of marine microbial functional diversity benefits from integrated computational platforms. The MASH-Ocean platform (Microbiome Atlas/Sino-Hydrosphere for Ocean Ecosystem) represents one such resource, comprising 2,147 metagenomic samples with analysis modules for diversity, function, biogeography, and interaction networks [74]. This platform enables researchers to visualize global distribution patterns of specific microbial taxa and functional genes, facilitating investigation of functional diversity across oceanic gradients.
The Scientist's Toolkit: Essential Research Reagents and Materials
Table 3: Essential Research Reagents and Materials for Marine Microbial Functional Diversity Studies
| Item | Function/Application | Examples/Specifications |
|---|---|---|
| Sterivex Filter Cartridges | Biomass collection from seawater | 0.22-μm pore-size GV Sterivex (Millipore) for microbial cell collection [72] |
| Nucleic Acid Extraction Kits | DNA/RNA co-extraction from microbial biomass | AllPrep DNA/RNA Kit (Qiagen) with lysozyme/proteinase K pretreatment [72] |
| Library Preparation Kits | Metagenomic library construction for sequencing | Nextera XT DNA Sample Preparation Kit (Illumina) [72] |
| Sequence Assembly Software | Reconstruction of contigs from sequencing reads | MEGAHIT v1.2.9 [74], IDBA-UD [72] |
| Gene Prediction Tools | Identification of protein-coding sequences | MetaGeneAnnotator [72], Prodigal v2.6.3 [74] |
| Functional Annotation Databases | Metabolic pathway assignment and classification | eggNOG [74], KEGG [74], GTDB-Tk v2.3.2 for taxonomy [74] |
| Metabolic Pathway Analysis | Inference of metabolic strategies from genomic data | Presence/absence of key genes (e.g., CBB cycle, glycolysis, CAs) [2] |
Implications for Ocean Ecosystem Research and Biogeochemical Modeling
The recognition of limited functional redundancy in marine microbial communities carries profound implications for understanding and predicting ocean ecosystem responses to environmental change. Rather than functioning as buffered systems where microbial activities remain stable despite taxonomic shifts, marine ecosystems may be more susceptible to biodiversity loss than previously assumed [71]. The functional uniqueness of microbial taxa means that changes in community composition could directly alter biogeochemical cycling rates and pathways, with potential consequences for global climate processes [8] [71].
For researchers investigating the functional diversity of Marinisomatota in ocean ecosystems, these findings highlight the importance of strain-level metabolic differences and their ecological significance. The mixotrophic capabilities observed in certain Marinisomatota lineages [2] represent precisely the type of metabolic specialization that would be overlooked under a functional redundancy paradigm but which may critically influence carbon cycling in the ocean's interior. Future research should prioritize linking these metabolic capabilities to in situ activities through integrated metatranscriptomic and metaproteomic approaches, and exploring how Marinisomatota interactions with other microbial taxa shape broader ecosystem processes.
The marine microbial web represents a complex system of functionally distinctive taxa whose metabolic capabilities are tightly linked to their phylogenetic identity. The case of Marinisomatota illustrates how presumed functional redundancy often reflects insufficient resolution of metabolic diversity rather than true ecological equivalence. Moving forward, marine microbial ecology must embrace this complexity, developing models and approaches that account for functional uniqueness and its ecosystem consequences. Such refined understanding will be essential for predicting how ocean ecosystems will respond to ongoing global change and for harnessing marine microbial capabilities in biotechnological applications.
Crassulacean Acid Metabolism (CAM) represents a pivotal evolutionary innovation in plant biology, enhancing water-use efficiency and photosynthetic performance in arid environments. Recent genomic investigations have elucidated the complex genetic underpinnings of CAM, revealing a suite of core genes responsible for its characteristic diurnal acid metabolism. This whitepaper examines the functional diversity of CAM genes, with particular emphasis on their role in marine microbial systems including the Marinisomatota phylum. We synthesize current understanding of CAM pathway genetics, present quantitative analyses of gene expression patterns, and detail experimental methodologies for investigating CAM in non-model aquatic organisms. The findings demonstrate that CAM photosynthesis employs conserved genetic components across terrestrial and aquatic species, yet exhibits significant evolutionary plasticity in its regulatory mechanisms and enzyme recruitment strategies.
Crassulacean Acid Metabolism (CAM) is a carbon-concentrating mechanism that evolved independently in numerous plant lineages as an adaptation to environmental stressors [75]. The pathway temporally separates carbon acquisition from fixation: stomata open at night for CO₂ uptake and fixation into organic acids (primarily malate), which are stored in vacuoles. During the day, stomata close to conserve water while the stored malate is decarboxylated, releasing CO₂ for photosynthesis via the Calvin cycle [75]. While historically associated with terrestrial succulent plants in arid environments, CAM also exists in aquatic species where it solves problems of CO₂ limitation rather than water conservation [76] [75].
In marine ecosystems, CAM-like metabolism may contribute to the functional diversity of microbial communities, including the Marinisomatota phylum. These bacteria inhabit environments with fluctuating nutrient availability where diurnal carbon concentration strategies could provide selective advantages. Understanding the genetic basis of CAM provides insights into metabolic innovation and the evolution of carbon concentration mechanisms across diverse biological systems.
Core CAM Genes and Their Functions
The CAM pathway relies on coordinated expression of genes encoding enzymes that facilitate nocturnal carboxylation, diurnal decarboxylation, and transporter proteins that facilitate metabolite movement across cellular compartments.
Key Enzymes in the CAM Pathway
Table 1: Core Enzymes in the CAM Photosynthetic Pathway
| Enzyme | Abbreviation | Primary Function | Phase | Cellular Location |
|---|---|---|---|---|
| Phosphoenolpyruvate carboxylase | PEPC | Nocturnal CO₂ fixation: carboxylates PEP to form oxaloacetate | Night | Cytosol |
| NAD-dependent malate dehydrogenase | NAD-MDH | Reduces oxaloacetate to malate using NADH | Night | Cytosol |
| Vacuolar ATPase | V-ATPase | Acidifies vacuole to facilitate malate storage | Night | Tonoplast |
| Vacuolar pyrophosphatase | V-PPase | Secondary proton pump for malate transport | Night | Tonoplast |
| NADP-dependent malic enzyme | NADP-ME | Diurnal decarboxylation of malate to pyruvate and CO₂ | Day | Chloroplast |
| Phosphoenolpyruvate carboxykinase | PEPCK | Alternative decarboxylation pathway enzyme | Day | Cytosol |
| Pyruvate phosphate dikinase | PPDK | Regenerates PEP from pyruvate | Day | Chloroplast |
The primary nocturnal carboxylation is catalyzed by phosphoenolpyruvate carboxylase (PEPC), which fixes HCO₃⁻ onto phosphoenolpyruvate (PEP) to form oxaloacetate [75]. This represents a critical entry point for carbon into the CAM cycle. In the aquatic lycophyte Isoetes taiwanensis, genomic analysis revealed recruitment of both plant-type and bacterial-type PEPCs, suggesting evolutionary flexibility in this key CAM component [76]. The resulting oxaloacetate is reduced to malate by NAD-dependent malate dehydrogenase (NAD-MDH), and malate is transported into vacuoles for storage as malic acid [75].
Diurnal decarboxylation is mediated by NADP-dependent malic enzyme (NADP-ME) or, in some species, phosphoenolpyruvate carboxykinase (PEPCK), which release CO₂ from malate for fixation by Rubisco in the Calvin cycle [75]. The resulting pyruvate is converted back to PEP via pyruvate phosphate dikinase (PPDK), completing the cycle.
Transporter and Regulatory Genes
Beyond the core enzymes, CAM functionality depends on transporter genes, particularly those governing malate movement across the tonoplast. The vacuolar ATPase (V-ATPase) and vacuolar pyrophosphatase (V-PPase) establish the proton gradient that drives malate uptake into vacuoles at night and its release during the day [75].
Circadian clock genes form the regulatory backbone that synchronizes CAM gene expression with diurnal cycles. In Isoetes, core circadian regulators show distinct expression patterns compared to angiosperm CAM species, suggesting divergent evolutionary paths to achieving temporal separation of carboxylation and decarboxylation phases [76].
Genomic Features of CAM in Aquatic Systems
Distinctive Features of Aquatic CAM Genetics
Comparative genomics between terrestrial and aquatic CAM plants reveals both conserved elements and significant divergences in genetic architecture:
- PEPC Gene Diversity: Aquatic Isoetes species utilize a 'bacterial-type' PEPC alongside the 'plant-type' PEPC exclusively used in terrestrial CAM and C4 plants [76]. This represents a fundamental difference in the genetic toolkit for carbon concentration.
- Circadian Regulation Divergence: While terrestrial CAM plants show conserved circadian control of CAM pathway genes, Isoetes exhibits substantially different regulatory patterns, suggesting alternative evolutionary trajectories for coordinating CAM rhythms [76].
- Genome Organization: The Isoetes taiwanensis genome shows even distribution of genes and repetitive elements, contrasting with the gene-rich regions typically found near chromosome ends in angiosperms [76]. This structural difference may influence regulation of metabolic pathways like CAM.
Evolutionary Origins and Horizontal Gene Transfer
The presence of bacterial-type PEPC in Isoetes raises questions about potential horizontal gene transfer events in the evolutionary history of aquatic CAM [76]. Marine ecosystems, with their high microbial density and frequent gene exchange, provide ideal conditions for such transfers. The Marinisomatota phylum, known for genomic plasticity and integrative elements, may possess similar acquired metabolic genes that enhance carbon concentration capabilities [77].
Table 2: Genomic Comparison of CAM Features Across Species
| Genomic Feature | Terrestrial CAM Plants | Aquatic CAM Plants (Isoetes) | Marinisomatota |
|---|---|---|---|
| PEPC Type | Plant-type exclusively | Plant-type and bacterial-type | Unknown (potential bacterial-type) |
| Circadian Control | Highly conserved | Significantly diverged | Likely environmental sensing |
| Genome Organization | Gene-rich chromosomal regions | Even gene/repeat distribution | High plasticity with genomic islands |
| Key Decarboxylase | NADP-ME or PEPCK | NADP-ME predominant | Potential alternative mechanisms |
| Whole Genome Duplications | Multiple events in some lineages | Single ancient WGD (ISTEβ) | Not reported |
Experimental Protocols for CAM Gene Investigation
Genomic Sequencing and Assembly
Protocol 1: High-Quality Genome Assembly for CAM Plants
- DNA Extraction: Use fresh leaf tissue from CAM-performing species. For aquatic plants, include root and leaf tissues to capture full genetic repertoire.
- Multi-platform Sequencing: Combine Illumina short-reads (for accuracy), Nanopore long-reads (for scaffolding), and Bionano optical mapping (for chromosomal structure) [76].
- Genome Assembly: Employ hybrid assembly approaches integrating all data types. For Isoetes taiwanensis, this yielded 204 scaffolds with N50 = 17.40 Mb, covering 90.13% of the predicted genome [76].
- Gene Annotation: Combine ab initio prediction, protein homology, and transcriptome evidence. Use BUSCO scores to assess completeness (target >90%) [76].
Diurnal Expression Analysis
Protocol 2: Time-Course Transcriptomics for CAM Gene Expression
- Sample Collection: Harvest tissue at 4-hour intervals over 24-hour cycles, with biological replicates (n≥3) for each time point [76].
- RNA Extraction: Use standardized methods with DNase treatment to remove genomic DNA contamination.
- Library Preparation and Sequencing: Prepare stranded RNA-seq libraries and sequence on Illumina platforms to minimum depth of 30 million reads per sample.
- Bioinformatic Analysis:
- Map reads to reference genome using splice-aware aligners (e.g., STAR)
- Quantify transcript abundance (e.g., with StringTie)
- Identify differentially expressed genes across time points
- Conduct phase analysis for circadian cycling of CAM genes
Functional Characterization of CAM Enzymes
Protocol 3: Enzyme Activity Assays for Key CAM Components
- Protein Extraction: Prepare crude extracts from tissue harvested at peak day/night phases.
- PEPC Activity Assay:
- Reaction buffer: 50 mM HEPES-KOH (pH 8.0), 5 mM MgCl₂, 5 mM NaHCO₃, 0.2 mM NADH, 10 U malate dehydrogenase, 2 mM PEP
- Monitor NADH oxidation at 340 nm for 5 minutes
- Calculate activity as µmol NADH oxidized min⁻¹ mg⁻¹ protein
- NADP-ME Activity Assay:
- Reaction buffer: 50 mM HEPES-KOH (pH 7.3), 5 mM MgCl₂, 0.5 mM NADP⁺, 10 mM malate
- Monitor NADP⁺ reduction at 340 nm for 5 minutes
- Malate Quantification: Use enzymatic test kits or HPLC to measure tissue malate content throughout diurnal cycle.
Research Reagent Solutions for CAM Studies
Table 3: Essential Research Reagents for CAM Investigation
| Reagent/Category | Specific Examples | Research Application | Function in CAM Studies |
|---|---|---|---|
| Sequencing Kits | Illumina NovaSeq, Nanopore Ligation Sequencing | Whole genome sequencing | Genome assembly and variant discovery |
| RNA Library Prep | Illumina TruSeq Stranded mRNA | Transcriptome analysis | Diurnal gene expression profiling |
| Enzyme Assay Kits | PEPC Activity Assay Kit (Sigma MAK310), Malate Assay Kit (Sigma MAK067) | Biochemical characterization | Quantifying enzyme activities and metabolite flux |
| Antibodies | Anti-PEPC, Anti-NADP-ME (Agrisera) | Protein localization and quantification | Immunohistochemistry and western blotting |
| Metabolite Standards | Malic acid, Phosphoenolpyruvate (Sigma) | Metabolite profiling | HPLC and LC-MS quantification references |
| Bioinformatics Tools | BUSCO, OrthoFinder, ggplot2 | Data analysis and visualization | Genome assessment, orthology identification, figure generation |
Visualizing CAM Pathways and Experimental Workflows
Figure 1: CAM Biochemical Pathway Showing Nocturnal and Diurnal Phases
Figure 2: Experimental Workflow for Comprehensive CAM Gene Analysis
The genetic architecture of Crassulacean Acid Metabolism reveals both conserved core components and remarkable evolutionary flexibility across terrestrial and aquatic systems. Key CAM genes encoding PEPC, decarboxylases, and transporters show distinct evolutionary patterns in aquatic species like Isoetes, including recruitment of bacterial-type enzymes and divergent circadian regulation [76]. These findings highlight the potential for discovering novel carbon concentration mechanisms in marine microbial systems, including the Marinisomatota phylum.
Future research should prioritize functional characterization of CAM-like genes in marine bacteria, investigation of horizontal gene transfer events in carbon concentration pathways, and exploration of CAM gene regulatory networks across diverse aquatic organisms. The experimental frameworks and reagent resources outlined here provide foundational methodologies for advancing this research frontier. Understanding the genetic basis of CAM photosynthesis in marine systems not only elucidates fundamental biological mechanisms but also informs biotechnological applications in carbon capture and crop engineering for water-limited environments.
The phylum Marinisomatota (formerly recognized as Marinimicrobia, Marine Group A, and SAR406) represents a ubiquitous and abundant group of microorganisms in global ocean ecosystems [2]. Traditionally characterized as heterotrophic, emerging research reveals a complex functional diversity within this phylum, encompassing roles in both carbon fixation and the remineralization of organic matter [2]. Understanding the metabolic strategies that govern the trophic behaviors of Marinisomatota is critical for a holistic view of the ocean's biological carbon pump. This whitepaper synthesizes current research to elucidate the dual ecological impact of Marinisomatota, framing their activities within the broader context of functional diversity in marine microbial communities. The findings herein are based on metagenomic, metatranscriptomic, and metaproteomic analyses, providing an in-depth technical guide for researchers and scientists [2] [78].
Metabolic Strategies and Functional Diversity of Marinisomatota
Comprehensive analysis of 1,588 metagenomically-assembled Marinisomatota genomes from global open oceans has delineated a significant breadth of functional diversity within the phylum, which is classified into one class, two orders, 14 families, 31 genera, and 67 species [2]. These organisms are predominantly found in low-latitude marine regions, with relative abundances ranging from 0.18% to 36.21% [2].
Three distinct metabolic strategies (MS) have been identified, which represent adaptations to nutrient limitations in the ocean and underscore a potential for mixotrophy [2]:
- MS0 (Photoautotrophic Potential): Characterized by the genetic capacity for light-dependent processes associated with Crassulacean acid metabolism (M00169). This strategy allows for carbon dioxide fixation and the synthesis of organic compounds, enabling Marinisomatota to thrive in the translucent zone and transition layers [2].
- MS1 (Heterotrophic with Glycolysis): A heterotrophic strategy with a pronounced glycolytic pathway for the breakdown of organic carbon [2].
- MS2 (Heterotrophic without Glycolysis): A heterotrophic strategy that operates without a strong glycolytic pathway, suggesting alternative mechanisms for carbon acquisition [2].
The emergence of these strategies highlights a critical interplay between life history traits and metabolic pathways in the evolution of novel nutritional groups [2].
Table 1: Metabolic Strategies and Distribution of Marinisomatota
| Metabolic Strategy | Trophic Mode | Key Genetic or Metabolic Feature | Ecological Niche |
|---|---|---|---|
| MS0 | Photoautotrophic Potential | Crassulacean acid metabolism (M00169) | Translucent zone, Aphotic transition |
| MS1 | Heterotrophic | Pronounced glycolytic pathway | Various marine depths |
| MS2 | Heterotrophic | Lacks strong glycolysis | Various marine depths |
Marinisomatota in the Context of Microbial Remineralization
The remineralization of particulate organic carbon (POC) is a critical process in the ocean's twilight zone (base of the euphotic zone to 1,000 m depth), determining the efficiency of carbon sequestration and global climate regulation [78]. Prokaryotes are responsible for 70-92% of POC remineralization [78]. While Marinisomatota is a key player, other bacterial groups also contribute significantly to this process, illustrating the functional diversity of microbial communities in the dark ocean.
Metaproteomic studies of POC in the Northwest Pacific Ocean have identified specific active bacterial groups and their metabolic pathways [78]. These studies reveal that particle-attached bacteria possess specialized extracellular hydrolytic enzymes that release carbon trapped in POC, and the expression levels and properties of these enzymes control the microbial breakdown rate [78].
Table 2: Key Microbial Players in POC Remineralization in the Twilight Zone
| Microbial Order | Class | Key Hydrolases Produced | Primary Function in POC Degradation |
|---|---|---|---|
| Alteromonadales | Gammaproteobacteria | Proteases, Hydrolases | Degrades proteinaceous components and polysaccharides |
| Rhodobacterales | Alphaproteobacteria | Proteases, Hydrolases | Degrades proteinaceous components and polysaccharides |
| Enterobacterales | Gammaproteobacteria | Proteases, Hydrolases | Degrades proteinaceous components and polysaccharides; dominates in cold waters |
The community composition and functional processes are strongly influenced by environmental factors, with temperature being a primary driver. For instance, Enterobacterales can replace Alteromonadales as the predominant remineralizing group under low-temperature conditions [78]. Furthermore, niche complementarity and species substitution among these bacterial groups ensure the efficient remineralization of POC across diverse marine environments [78].
Methodologies for Investigating Microbial Carbon Cycling
Metagenomic and Metatranscriptomic Workflow for Marinisomatota
The analysis of Marinisomatota's functional diversity relies on advanced genomic techniques. The following workflow outlines the process from sample collection to metabolic inference, which can be applied to other microbial groups as well.
Metaproteomic Analysis of POC-Associated Microbes
To directly assess the active microbial groups and their in situ metabolic activities in POC remineralization, a metaproteomic approach is employed. This method provides direct evidence of expressed proteins and functional pathways [78].
Detailed Experimental Protocol:
- Large-Volume In Situ Sampling: POC samples (size range: 0.7 to 200 μm) are collected from targeted depths (e.g., DCM, 100 m, 200 m, 500 m) using a large-volume in situ water transfer system to enrich sufficient biomass for analysis [78].
- Protein Extraction and Digestion: Proteins are extracted from the POC samples. A three-step search strategy against a comprehensive database like the Ocean Microbial Reference Gene Catalog (OM-RGC) is used to achieve high qualitative and quantitative protein coverage. This typically involves filter-aided sample preparation and digestion with trypsin [78].
- Liquid Chromatography-Tandem Mass Spectrometry (LC-MS/MS): The digested peptides are separated by liquid chromatography and analyzed by tandem mass spectrometry to obtain peptide mass and fragmentation data [78].
- Data Analysis and Protein Identification: MS/MS spectra are searched against the protein database to identify peptides and proteins. The study cited identified an average of 7,177 proteins per sample, resulting in 24,967 nonredundant proteins. 97.28% of these were assigned a taxonomic origin [78].
- Functional and Taxonomic Assignment: Identified proteins are classified using databases like KEGG to reconstruct metabolic pathways and assigned to taxonomic groups to identify active key microbial players [78].
Research Reagent Solutions
The following reagents and materials are essential for executing the protocols described above.
Table 3: Essential Research Reagents and Materials
| Reagent/Material | Function in Protocol |
|---|---|
| Ocean Microbial Reference Gene Catalog (OM-RGC) | A curated database used for protein and gene identification; provides a standardized reference for annotating metagenomic and metaproteomic data from marine environments [78]. |
| GF/F Filters (0.7 μm) | Glass fiber filters used for the initial concentration and size-fractionation of particulate organic matter and microbial biomass from large volumes of seawater [78]. |
| Trypsin | A protease enzyme used to digest extracted proteins into peptides for subsequent analysis by mass spectrometry [78]. |
| KEGG Database | Bioinformatics database used for the functional annotation of identified genes and proteins, enabling reconstruction of metabolic pathways such as carbon fixation and glycolysis [2] [78]. |
The functional diversity of Marinisomatota has a profound and integrated impact on the ocean's carbon cycle. Through the metabolic strategies outlined, they contribute to both the input (via photoautotrophy) and output (via heterotrophy) of organic carbon in the water column. The mixotrophic potential of certain Marinisomatota lineages allows them to adapt to the fluctuating energy conditions of the oceanic water column, particularly in the transition zone between light and dark [2].
This functional versatility positions Marinisomatota as a key phylum within the broader context of marine microbial ecology. Their activities are complemented by other specialized heterotrophic bacteria like Alteromonadales and Rhodobacterales, which are primary agents of POC remineralization [78]. The collective metabolic output of these diverse groups, regulated by environmental drivers like temperature, ultimately determines the efficiency of the biological carbon pump. Understanding the functional diversity of Marinisomatota and related microbes is, therefore, essential for accurately modeling global carbon fluxes and predicting the ocean's response to environmental change.
The functional diversity of microbial life is a cornerstone of ocean ecosystem function. Within this complex community, the phyla Proteobacteria and Bacteroidota (formerly Bacteroidetes) have been extensively studied and are often treated as model systems for understanding microbial ecology and metabolism in marine environments [79] [80]. These model phyla provide a foundational benchmark against which the biology of less-characterized groups can be measured. This guide frames the ecological and metabolic strategies of the ubiquitous yet enigmatic phylum Marinisomatota (formerly Marinimicrobia) within the context of the well-established functional profiles of these model phyla [2].
Marinisomatota are abundant and globally distributed in marine environments, particularly in the deep ocean, but their metabolic capabilities and ecological roles are not as fully defined as those of Proteobacteria and Bacteroidota [2] [4]. By employing a comparative genomics approach, benchmarking against model phyla allows researchers to generate testable hypotheses about the potential functions of Marinisomatota in nutrient cycling, energy acquisition, and ecosystem productivity. This whitepaper provides a technical framework for such comparative analyses, detailing essential experimental protocols, data interpretation strategies, and reagent solutions to advance research in this field.
Ecological Dominance and Functional Profiles of Model Phyla
Proteobacteria: The Metabolic Generalists
As one of the most abundant and diverse bacterial phyla in the ocean, Proteobacteria play a wide array of roles in carbon, nitrogen, and sulfur cycling. Their ecological success is linked to tremendous metabolic versatility, allowing them to thrive across diverse marine habitats, from nutrient-rich coastal areas to oligotrophic open oceans [81].
Bacteroidota: Specialists in High-Molecular-Weight Organic Matter Degradation
Bacteroidota are critically important for the marine carbon cycle due to their specialization in degrading particulate organic matter, such as proteins and polysaccharides. Genomic analyses reveal specific adaptations for this lifestyle, including an extensive arsenal of hydrolytic enzymes [80]. Table 1 summarizes the key genomic features that underpin their ecological strategies.
Table 1: Comparative Genomic and Ecological Features of Model Marine Phyla
| Feature | Proteobacteria | Bacteroidota | Marinisomatota (Context) |
|---|---|---|---|
| Primary Ecological Role | Metabolic generalists; involved in multiple biogeochemical cycles | Specialists in degradation of high-molecular-weight organic matter (proteins, polysaccharides) | Traditionally considered heterotrophic, with recent evidence for photoautotrophic potential [2] |
| Characteristic Metabolic Traits | Diverse aerobic heterotrophy, chemolithotrophy, photosynthesis | High numbers of peptidases, glycoside hydrolases (GHs), glycosyl transferases | Three distinct metabolic strategies identified: photoautotrophic (MS0), heterotrophic with glycolysis (MS1), heterotrophic without glycolysis (MS2) [2] |
| Genomic Adaptations | Versatile core metabolism, diverse substrate utilization pathways | Genes for gliding motility, adhesion proteins, TonB-dependent transporters | Presence of genes for Crassulacean acid metabolism (CAM) in some families (e.g., S15-B10, TCS55) [2] |
| Habitat Preference | Free-living in water column, particle-associated | Particle-associated, especially during algal blooms | Low-latitude marine regions, relative abundance 0.18% to 36.21% [2] |
Benchmarking Marinisomatota Against Model Phyla
Metabolic Strategy Classification in Marinisomatota
The functional diversity of Marinisomatota can be decoded by benchmarking their genomic signatures against the established profiles of Proteobacteria and Bacteroidota. A recent analysis of 1,588 Marinisomatota genomes revealed three distinct metabolic strategies, demonstrating a functional plasticity that overlaps with and diverges from the model phyla [2].
The MS0 strategy shows photoautotrophic potential, a trait uncommon in the heterotrophic Bacteroidota but present in some Proteobacteria (e.g., Rhodobacterales). The MS1 and MS2 strategies are heterotrophic, akin to the primary lifestyles of both Proteobacteria and Bacteroidota, but with a key differentiation: MS1 utilizes a pronounced glycolytic pathway, while MS2 does not. This suggests niche partitioning in carbon source utilization, potentially reducing direct competition with the highly efficient heterotrophic pathways of Bacteroidota [80] [2].
Table 2: Metabolic Strategies and Functional Potential in Marinisomatota
| Metabolic Strategy | Defining Characteristics | Putative Ecological Niche | Benchmarking Against Model Phyla |
|---|---|---|---|
| MS0 | Photoautotrophic potential; genes for Crassulacean acid metabolism (CAM) | Inorganic carbon fixation in the translucent zone | Functional overlap with photoautotrophic Proteobacteria; distinct from primary Bacteroidota strategy |
| MS1 | Heterotrophic with a pronounced glycolytic pathway | Utilization of labile organic carbon in nutrient-rich microzones | Parallels the generalist heterotrophy of many Proteobacteria |
| MS2 | Heterotrophic without glycolysis | Utilization of alternative, possibly more recalcitrant, carbon sources in nutrient-poor conditions | Diverges from the classic glycolytic model, suggesting a unique niche distinct from both model phyla |
A Conceptual Workflow for Functional Benchmarking
The following diagram illustrates a structured workflow for benchmarking a less-studied phylum (like Marinisomatota) against model marine phyla, integrating genomic, environmental, and experimental data.
Essential Experimental Methodologies
Genome-Resolved Metagenomics for Cataloging Diversity
Principle: This culture-independent method allows for the reconstruction of Metagenome-Assembled Genomes (MAGs) directly from environmental samples (e.g., seawater, sediment), enabling the study of uncultured microorganisms like many Marinisomatota [4].
Detailed Protocol:
- Sample Collection and Sequencing: Filter a large volume of seawater (e.g., 2 L) through a 0.22 µm polycarbonate membrane to capture microbial cells [81]. Flash-freeze the filters in liquid nitrogen and store at -80°C. Extract total genomic DNA using a commercial kit (e.g., PowerWater DNA Isolation Kit). Perform whole-genome shotgun sequencing on an Illumina or PacBio platform.
- Bioinformatic Processing and MAG Reconstruction:
- Quality Control: Use tools like Trimmomatic to remove adapters and low-quality bases from raw sequencing reads [82].
- Assembly: Assemble quality-filtered reads into longer contigs using a metaSPAdes or MEGAHIT.
- Binning: Group contigs into putative MAGs based on sequence composition (k-mer frequency, GC content) and abundance across samples using tools like MetaBAT2 or MaxBin2.
- Quality Assessment: Check MAG quality using CheckM. Aim for medium to high-quality drafts (e.g., >50% completeness, <10% contamination) [4].
- Taxonomic Classification: Classify MAGs against a reference database such as the Genome Taxonomy Database (GTDB) [82] [4].
16S rRNA Gene Amplicon Sequencing for Community Profiling
Principle: Sequencing a hypervariable region of the 16S rRNA gene provides a cost-effective method to profile microbial community composition and relative abundance, though with lower taxonomic resolution than metagenomics [82].
Detailed Protocol:
- PCR Amplification: Amplify the target region (e.g., V3-V4 with primers 341F/806R, or the near-full-length gene with ONT27F/ONT1492R) from the extracted environmental DNA [82] [81].
- Library Preparation and Sequencing: This can be done via:
- Bioinformatic Analysis:
- Demultiplexing: Assign sequences to samples based on barcodes.
- Denoising & ASV/OTU Picking: Use DADA2 (for Amplicon Sequence Variants - ASVs) in QIIME2 or Mothur (for Operational Taxonomic Units - OTUs at 97% identity) to cluster sequences into taxonomic units [82] [81].
- Taxonomy Assignment: Assign taxonomy to ASVs/OTUs using reference databases like SILVA, GreenGenes2, or NCBI [82].
Culture-Dependent Isolation and Characterization
Principle: Cultivation provides pure bacterial strains for detailed physiological and genetic studies, enabling the functional validation of genomic predictions and the discovery of novel species [79].
Detailed Protocol (as applied to marine turtles, adaptable for water samples):
- Sample Homogenization: Aseptically homogenize the sample (e.g., fecal matter, marine snow particles) in sterile seawater [79].
- Culture Conditions: Plate serial dilutions of the homogenate onto marine-specific agar media (e.g., 2216E medium, supplemented with sodium acetate or jellyfish extract). Incubate plates under both aerobic and anaerobic conditions at a relevant temperature (e.g., 28°C) to capture a wider diversity of organisms [79].
- Strain Purification and Identification: Pick morphologically distinct colonies and re-streak repeatedly on fresh media to obtain pure cultures. Extract genomic DNA from pure colonies.
- 16S rRNA Gene Sequencing: Amplify and sequence the nearly full-length 16S rRNA gene using primers 27F and 1492R. Compare the resulting sequences against public databases (EzTaxon, NCBI BLAST) for identification and to check for novelty [79].
The Scientist's Toolkit: Key Research Reagents & Materials
Table 3: Essential Reagents and Kits for Marine Microbiome Research
| Item | Specific Example | Function/Application |
|---|---|---|
| DNA Extraction Kit | PowerWater DNA Isolation Kit (MP BIO) | Designed to efficiently extract microbial DNA from water filters, overcoming inhibitors common in marine environments [81]. |
| PCR Enzymes | KAPA 3G Kit (Illumina); LongAmp Taq 2X Master Mix (Nanopore) | Polymerases optimized for amplicon generation for specific sequencing platforms (short-read vs. long-read) [82]. |
| Sequencing Primers | 341F/806R (V3-V4); ONT27F/ONT1492R (full-length 16S) | Target specific regions of the 16S rRNA gene for amplification prior to sequencing [82]. |
| Culture Media | 2216E Marine Agar, supplemented with sodium acetate or jellyfish extract | A standard nutrient-rich medium for cultivating heterotrophic marine bacteria under aerobic or anaerobic conditions [79]. |
| Bioinformatic Databases | SILVA, GTDB, NCBI RefSeq, Pfam | Used for taxonomic classification of sequences and functional annotation of genes and genomes [80] [82] [4]. |
Visualization of Metabolic Strategies and Niche Partitioning
The metabolic strategies of Marinisomatota can be conceptualized as adaptations to nutrient gradients in the ocean. The following diagram illustrates how the different strategies (MS0, MS1, MS2) may occupy distinct niches relative to the model phyla.
Conclusion
The functional diversity of Marinisomatota, particularly their mixotrophic capabilities and distinct metabolic strategies (MS0, MS1, MS2), underscores their critical and previously underestimated role in ocean biogeochemical cycles. Their adaptation to nutrient limitation through metabolic flexibility represents a key evolutionary innovation for survival in the oligotrophic ocean. The application of advanced genomic and cultivation techniques has been instrumental in moving this phylum from a 'microbial dark matter' candidate to a group with defined ecological functions. For biomedical and clinical research, the vast, untapped genetic repertoire of Marinisomatota, as part of the broader marine microbial diversity, presents a promising frontier for bioprospecting. Future research should focus on isolating novel strains, experimentally validating their metabolic pathways, and screening their genomes for biosynthetic gene clusters that could yield new antimicrobial peptides, enzymes, or other therapeutic compounds, thereby bridging the gap between marine microbial ecology and drug discovery pipelines.
References
- 1. Ecological diversity and metabolic strategies of widespread ... [https://link.springer.com/article/10.1007/s42995-025-00293-x]
- 2. Ecological diversity and metabolic strategies of widespread ... [https://pubmed.ncbi.nlm.nih.gov/40919477/]
- 3. Expanding the World of Marine Bacterial and Archaeal Clades [https://pmc.ncbi.nlm.nih.gov/articles/PMC4705458/]
- 4. Global marine microbial diversity and its potential in ... [https://www.nature.com/articles/s41586-024-07891-2]
- 5. Degradation of biological macromolecules supports ... [https://www.nature.com/articles/s41396-021-01026-5]
- 6. New globally distributed bacterial phyla within the FCB ... [https://pmc.ncbi.nlm.nih.gov/articles/PMC9727166/]
- 7. Microbial ecosystems and ecological driving forces in the ... [https://www.sciencedirect.com/science/article/pii/S009286742401479X]
- 8. Advancing ecological and environmental biology research [https://pmc.ncbi.nlm.nih.gov/articles/PMC12413372/]
- 9. Long-term patterns of an interconnected core marine microbiota [https://environmentalmicrobiome.biomedcentral.com/articles/10.1186/s40793-022-00417-1]
- 10. Quantitatively Partitioning Microbial Genomic Traits among ... [https://pmc.ncbi.nlm.nih.gov/articles/PMC6714891/]
- 11. Depth-dependent microbial metagenomes sampled in the ... [https://www.nature.com/articles/s41597-024-02939-4]
- 12. Ultrahigh resolution MS1/MS2-based reconstruction of ... [https://pmc.ncbi.nlm.nih.gov/articles/PMC9667311/]
- 13. Emergent Relationships Between the Functional Diversity ... [https://pmc.ncbi.nlm.nih.gov/articles/PMC11897942/]
- 14. Mass-spectrometry based metabolomics - PubMed Central - NIH [https://pmc.ncbi.nlm.nih.gov/articles/PMC12105183/]
- 15. A mass spectrum-oriented computational method for ion ... [https://www.nature.com/articles/s41467-023-37539-0]
- 16. Knowledge and data-driven two-layer networking for ... [https://www.nature.com/articles/s41467-025-63536-6]
- 17. Mixotroph ecology: More than the sum of its parts - PMC [https://pmc.ncbi.nlm.nih.gov/articles/PMC6442617/]
- 18. Marine mixotrophy increases trophic transfer efficiency, mean ... [https://pmc.ncbi.nlm.nih.gov/articles/PMC4801304/]
- 19. Marine mixotrophs exploit multiple resource pools to ... [https://www.us-ocb.org/marine-mixotrophs-exploit-multiple-resource-pools-to-balance-supply-and-demand/]
- 20. 揭秘海洋中广泛分布的Marinisomatota:生态多样性与代谢 ... [https://www.ebiotrade.com/newsf/2025-4/20250422045245682.htm]
- 21. Nutrient and carbon limitation drive broad-scale patterns of ... [https://www.us-ocb.org/nutrient-c-limitation-patterns-mixotrophy/]
- 22. 虫黄藻介导了珊瑚的营养可塑性 [https://www.tio.org.cn/OWUP/html_mobile/kycg/20240115/3512.html]
- 23. 青岛能源所揭示海洋聚球藻与异养菌群长期共存下互利共生 ... [https://qibebt.cas.cn/news/kyjz/202210/t20221001_6519773.html]
- 24. 科研进展|铁磷限制调控单细胞固氮生物对海洋酸化的响应 [https://mel.xmu.edu.cn/info/1012/33948.htm]
- 25. Phylogenetically and functionally diverse microorganisms ... [https://www.nature.com/articles/s41467-021-27769-5]
- 26. Exploring omics strategies for drug discovery from ... [https://pmc.ncbi.nlm.nih.gov/articles/PMC12394500/]
- 27. Metagenomics Unveils Viral Biodiversity [https://virologyresearchservices.com/2025/10/28/metagenomics-unveils-viral-biodiversity/]
- 28. Potential applications and future prospects of ... [https://www.sciencedirect.com/science/article/abs/pii/S0378111925005098]
- 29. The microbiome of the Black Sea water column analyzed by ... [https://pmc.ncbi.nlm.nih.gov/articles/PMC8067304/]
- 30. Skin metatranscriptomics reveals a landscape of variation ... [https://www.nature.com/articles/s41587-025-02797-4]
- 31. Metatranscriptomic and functional metagenomic analysis of ... [https://www.frontiersin.org/journals/microbiology/articles/10.3389/fmicb.2013.00340/full]
- 32. Metagenomic analysis reveals Northwest Pacific Ocean as ... [https://www.sciencedirect.com/science/article/abs/pii/S0269749125013119]
- 33. New globally distributed bacterial phyla within the FCB ... [https://www.nature.com/articles/s41467-022-34388-1]
- 34. Metagenomics-assembled genomes reveal microbial ... [https://pmc.ncbi.nlm.nih.gov/articles/PMC12174138/]
- 35. Phylogenetically and functionally diverse microorganisms ... [https://pmc.ncbi.nlm.nih.gov/articles/PMC8748734/]
- 36. Emergent Relationships Between the Functional Diversity ... [https://pubmed.ncbi.nlm.nih.gov/40071437/]
- 37. Microbial dark matter spearheading the biogeochemical ... [https://pmc.ncbi.nlm.nih.gov/articles/PMC12343361/]
- 38. Ecological diversity and metabolic strategies of widespread ... [https://ui.adsabs.harvard.edu/abs/2025MLST....7..523X/abstract]
- 39. Seasonal variability in community structure and metabolism of ... [https://pmc.ncbi.nlm.nih.gov/articles/PMC12507015/]
- 40. Clear niche partitioning of nitrite-oxidizing bacteria from the ... [https://microbiomejournal.biomedcentral.com/articles/10.1186/s40168-025-02192-w]
- 41. Exploring marine-derived bacterial compounds targeting ... [https://www.nature.com/articles/s41598-025-96411-x]
- 42. Bioprospecting and marine 'omics': surfing the deep blue ... [https://www.frontiersin.org/journals/marine-science/articles/10.3389/fmars.2024.1362697/full]
- 43. Novel Bioactive Compounds From Marine Sources as a ... [https://www.frontiersin.org/journals/marine-science/articles/10.3389/fmars.2022.832957/full]
- 44. In silico bioprospecting of receptors associated with the ... [https://pmc.ncbi.nlm.nih.gov/articles/PMC11162988/]
- 45. In silico bioprospecting of receptors for Oligoventin [https://www.sciencedirect.com/science/article/abs/pii/S0927776524007318]
- 46. MAGdb: a comprehensive high quality MAGs repository for ... [https://genomebiology.biomedcentral.com/articles/10.1186/s13059-025-03711-6]
- 47. Microbial dark matter spearheading the biogeochemical ... [https://www.sciencedirect.com/science/article/pii/S266651742500094X]
- 48. Microbial dark matter spearheading the biogeochemical ... [https://pubmed.ncbi.nlm.nih.gov/40808764/]
- 49. Mock Plant Communities and a Large Mammal Case Study ... [https://pmc.ncbi.nlm.nih.gov/articles/PMC12414724/]
- 50. Assessing the efficiency of COI primers in eDNA ... [https://www.sciencedirect.com/science/article/abs/pii/S0141113625005070]
- 51. Multi-marker comparative analysis of 18S, ITS1, and ITS2 ... [https://www.frontiersin.org/articles/10.3389/fbinf.2025.1690766/full]
- 52. METABOLIC: high-throughput profiling of microbial genomes ... [https://microbiomejournal.biomedcentral.com/articles/10.1186/s40168-021-01213-8]
- 53. In-silico structural and functional annotation of hypothetical ... [https://www.sciencedirect.com/science/article/abs/pii/S0010482525012880]
- 54. Semantic design of functional de novo genes from a ... [https://www.nature.com/articles/s41586-025-09749-7]
- 55. Genomic potential for mercury biotransformation in marine ... [https://www.nature.com/articles/s41467-025-63808-1]
- 56. Advancing ecological and environmental biology research [https://link.springer.com/article/10.1007/s42995-025-00319-4]
- 57. High-Performance Genome Annotation for a Safer and ... [https://pmc.ncbi.nlm.nih.gov/articles/PMC11946116/]
- 58. and heterotrophic processes in Mn-rich marine sediments [https://www.frontiersin.org/journals/marine-science/articles/10.3389/fmars.2025.1639181/full]
- 59. Flow cytometric analysis of autotrophic picoplankton [https://www.sciencedirect.com/science/article/pii/S058095170130051X]
- 60. Cultivating marine bacteria under laboratory conditions [https://pmc.ncbi.nlm.nih.gov/articles/PMC9428589/]
- 61. Inter-comparison of marine microbiome sampling protocols [https://www.nature.com/articles/s43705-023-00278-w]
- 62. Environmental preferences and interspecific interactions of ... [https://www.sciencedirect.com/science/article/pii/S0929139325006857]
- 63. Description of the first marine-isolated member of the under ... [https://pmc.ncbi.nlm.nih.gov/articles/PMC11651109/]
- 64. Effects of Different Preservation Methods on the Structure ... [https://pubmed.ncbi.nlm.nih.gov/39804371/]
- 65. Strain Library Imaging Protocol: high-throughput, ... [https://pmc.ncbi.nlm.nih.gov/articles/PMC5831406/]
- 66. Ptychography – a label free, high-contrast imaging ... [https://www.nature.com/articles/srep02369]
- 67. Niche differentiation in microbial communities with stable ... [https://pmc.ncbi.nlm.nih.gov/articles/PMC10987969/]
- 68. The combination of genomic offset and niche modelling ... [https://www.nature.com/articles/s41467-022-32546-z]
- 69. Water mass age structures the auxiliary metabolic gene ... [https://microbiomejournal.biomedcentral.com/articles/10.1186/s40168-023-01547-5]
- 70. Global marine microbial diversity and its potential in ... [https://pmc.ncbi.nlm.nih.gov/articles/PMC11390488/]
- 71. A Strong Link Between Marine Microbial Community ... [https://pubmed.ncbi.nlm.nih.gov/29925880/]
- 72. A strong link between marine microbial ... [https://pmc.ncbi.nlm.nih.gov/articles/PMC6155072/]
- 73. Frontiers | Real-Time PCR Quantification and Diversity of... Analysis [https://www.frontiersin.org/journals/microbiology/articles/10.3389/fmicb.2011.00253/full]
- 74. MASH‐Ocean 1.0: Interactive platform for investigating microbial ... [https://pmc.ncbi.nlm.nih.gov/articles/PMC11183159/]
- 75. Crassulacean acid metabolism [https://en.wikipedia.org/wiki/Crassulacean_acid_metabolism]
- 76. Underwater CAM photosynthesis elucidated by Isoetes ... [https://www.nature.com/articles/s41467-021-26644-7]
- 77. Novel integrative elements and genomic plasticity in ocean ... [https://www.sciencedirect.com/science/article/pii/S0092867422015197]
- 78. Illuminating Key Microbial Players and Metabolic Processes ... [https://pmc.ncbi.nlm.nih.gov/articles/PMC8478463/]
- 79. Analysis of the gut-specific microbiome from critically ... [https://www.frontiersin.org/journals/marine-science/articles/10.3389/fmars.2025.1671894/full]
- 80. Ecology of marine Bacteroidetes: a comparative genomics ... [https://pmc.ncbi.nlm.nih.gov/articles/PMC3635232/]
- 81. Bacterial taxonomic and functional profiles from Bohai Sea ... [https://www.frontiersin.org/journals/microbiology/articles/10.3389/fmicb.2023.1139950/full]
- 82. Benchmarking 16S rRNA Gene-Based Approaches to ... [https://pmc.ncbi.nlm.nih.gov/articles/PMC12367389/]