Unlocking Nature's Blue Carbon Hack: C4 Photosynthesis in Marine Macroalgae and Its Biomedical Implications
This article provides a comprehensive review of C4 photosynthesis in marine macroalgae, a significant yet underexplored adaptation to carbon limitation in aquatic environments.
Unlocking Nature's Blue Carbon Hack: C4 Photosynthesis in Marine Macroalgae and Its Biomedical Implications
Abstract
This article provides a comprehensive review of C4 photosynthesis in marine macroalgae, a significant yet underexplored adaptation to carbon limitation in aquatic environments. We examine its foundational biology, covering the evolutionary drivers, key biochemical pathways, and primary algal taxa involved. We detail the methodological approaches—from isotope discrimination assays to molecular analyses—critical for identifying and studying this mechanism. The discussion addresses challenges in isolating C4 activity from other carbon concentrating mechanisms (CCMs) and optimizing study conditions. Finally, we validate findings through comparative analysis with terrestrial C4 plants and other marine CCMs, highlighting the unique features and potential of algal C4 systems. The synthesis underscores the relevance of this research for developing novel biotechnological and biomedical tools, including insights for bioengineering and drug discovery targeting carbon metabolism.
Decoding the Aquatic Anomaly: The Evolutionary Basis and Biochemistry of C4 in Macroalgae
The canonical C4 photosynthetic pathway is a terrestrial innovation, a biochemical pump that concentrates CO₂ around RuBisCO to overcome photorespiration in hot, arid environments. In marine systems, particularly in macroalgae, the existence and functional significance of C4 photosynthesis remain a subject of debate. This whitepaper re-examines the C4 paradigm within the context of marine macroalgae, where dissolved inorganic carbon (DIC) speciation, diffusion limitations, and a highly variable pH environment present unique challenges. The core thesis is that C4-like metabolism in marine algae may not primarily function as a carbon-concentrating mechanism (CCM) akin to terrestrial plants, but could play roles in carbon storage, photoprotection, and metabolic redundancy under dynamic oceanic conditions.
Biochemical Pathways and Key Enzymes
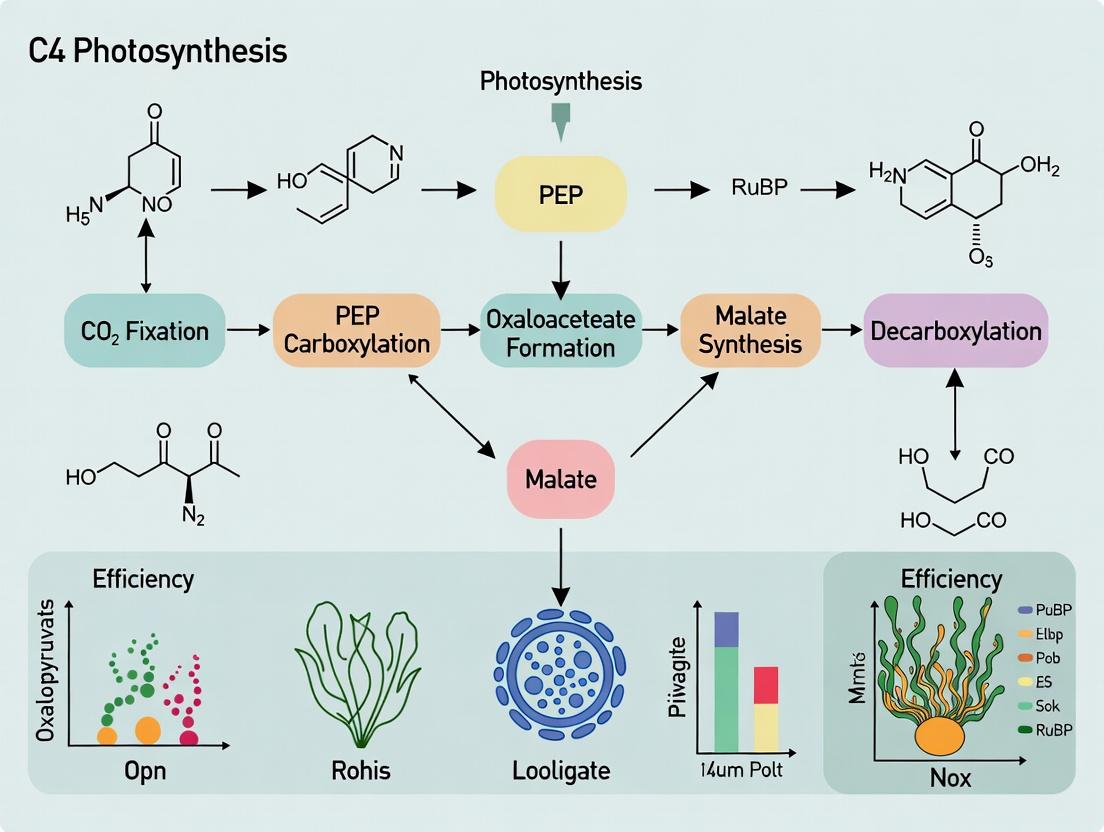
Marine macroalgae exhibit a mosaic of C4-related biochemical components. The pathways are often less spatially segregated than the classical Kranz anatomy of terrestrial C4 plants.
Diagram: Putative C4-Type Pathways in Marine Macroalgae
Diagram Title: C4-Type Metabolic Routes in a Macroalgal Cell
Table 1: Core Enzymes in Terrestrial C4 vs. Marine Macroalgae
| Enzyme (Abbr.) | Primary Role in Terrestrial C4 | Detection & Role in Marine Macroalgae | Key Algal Species Studied |
|---|---|---|---|
| Phosphoenolpyruvate carboxylase (PEPC) | Primary HCO₃⁻/CO₂ fixation in mesophyll cells. | Ubiquitous. High activity measured. May fix HCO₃⁻ for C4 acid production. | Ulva spp., Gracilariopsis spp., Sargassum spp. |
| Phosphoenolpyruvate carboxykinase (PEPCK) | A primary decarboxylase in some subtypes. | Often the dominant decarboxylase. High activity in light/dark. | Thalassiosira (diatom), Udotea (green alga). |
| NADP-malic enzyme (NADP-ME) | Common decarboxylase in Kranz anatomy (e.g., maize). | Less common. Activity detected but often lower than PEPCK. | Hydropuntia (red alga). |
| RuBisCO | Confined to bundle-sheath cells for final fixation. | Not spatially isolated. Co-exists with C4 enzymes in same cell. | All species. |
| Pyruvate, Pi dikinase (PPDK) | Regenerates PEP in mesophyll cells. | Activity variable; often low or absent in many species. | Some Udotea species. |
Experimental Protocols for Investigation
3.1. Enzyme Activity Assays (In Vitro)
- Objective: Quantify maximal activity (Vmax) of key C4 enzymes (PEPC, PEPCK, NADP-ME, RuBisCO).
- Protocol:
- Tissue Homogenization: Flash-freeze algal tissue in liquid N₂. Grind to fine powder under continuous N₂ cooling. Homogenize in ice-cold extraction buffer (e.g., 100 mM HEPES-KOH pH 7.5, 10 mM MgCl₂, 1 mM EDTA, 10% glycerol, 5 mM DTT, 1% PVP, 0.05% Triton X-100, protease inhibitors).
- Centrifugation: Clarify extract at 16,000 x g for 15 min at 4°C. Use supernatant as crude enzyme extract.
- PEPC Activity: Monitor NADH oxidation at 340 nm. Reaction mix: 50 mM Tris-HCl (pH 8.0), 10 mM MgCl₂, 10 mM NaHCO₃, 2 mM PEP, 0.15 mM NADH, 5 U malate dehydrogenase. Start reaction with PEP.
- PEPCK Activity: Monitor NADH oxidation at 340 nm. Reaction mix: 50 mM Imidazole-HCl (pH 6.6), 5 mM MnCl₂, 50 mM NaHCO₃, 2 mM PEP, 2 mM ADP, 0.15 mM NADH, 5 U malate dehydrogenase. Start with ADP.
- Data Normalization: Express activity as μmol product formed·min⁻¹·mg⁻¹ of total protein (determined by Bradford assay).
3.2. Pulse-Chase Isotope Tracing (¹⁴C or ¹³C)
- Objective: Track the flow of inorganic carbon into metabolic intermediates to identify a C4 pathway.
- Protocol:
- Incubation: Incubate fresh algal segments in sterile, buffered seawater under controlled light/temperature.
- Pulse: Introduce NaH¹⁴CO₃ or NaH¹³CO₃ (e.g., 10-50 μCi/mL ¹⁴C, or 99% ¹³C) for a short period (5-60 sec).
- Chase: Rapidly transfer tissue to non-radioactive/normal DIC seawater medium. Sample at multiple time points (e.g., 0s, 5s, 30s, 1min, 5min, 30min).
- Metabolite Extraction: Kill samples instantly in boiling 80% ethanol. Homogenize and separate soluble metabolites via ion-exchange chromatography (for ¹⁴C) or prepare for LC-MS (for ¹³C).
- Analysis: For ¹⁴C, quantify radioactivity in malate, aspartate, 3PGA, and sugars. A C4 signature shows rapid early labeling in C4 acids (malate/aspartate) before 3PGA. For ¹³C, analyze fractional enrichment and labeling patterns via LC-MS.
The Scientist's Toolkit: Research Reagent Solutions
Table 2: Essential Reagents for Marine Algal C4 Research
| Item / Reagent | Function / Purpose in Research |
|---|---|
| PEP (Phosphoenolpyruvate) | Essential substrate for PEPC and PEPCK enzyme activity assays. |
| NaH¹⁴CO₃ / NaH¹³CO₃ | Radioactive/stable isotopic tracer for pulse-chase experiments to track carbon flux. |
| Specific Enzyme Inhibitors (e.g., 3,3-Dichloro-2-dihydroxyphosphinoylmethyl-2-propenoate for PEPC) | To chemically knock down specific enzyme activity in vivo and assess physiological impact. |
| Antibodies against C4 Enzymes (PEPC, PEPCK) | For immunolocalization via microscopy to determine subcellular enzyme distribution. |
| RNAlater Stabilization Solution | Preserves RNA instantly for subsequent transcriptomic analysis of C4-related gene expression. |
| LC-MS Grade Solvents (Methanol, Acetonitrile, Water) | Required for high-sensitivity metabolomic profiling of ¹³C-labeled intermediates. |
| DIC Manipulation System (pH-Stat, CO₂ mixing) | To precisely control CO₂ vs. HCO₃⁻ concentrations during physiological experiments. |
Quantitative Evidence and Environmental Drivers
Table 3: Comparative Physiological Data in Selected Macroalgae
| Species (Phylum) | PEPC Activity (μmol·mg⁻¹ Chl·h⁻¹) | Primary Decarboxylase | δ¹³C Value (‰) | Proposed Function of C4 Metabolism |
|---|---|---|---|---|
| Udotea flabellum (Chlorophyta) | ~150-200 | PEPCK | -10 to -15 | Likely CCM, operates in single cell. |
| Gracilariopsis lemaneiformis (Rhodophyta) | ~80-120 | PEPCK / NADP-ME | -12 to -20 | Photoprotection, carbon storage. |
| Sargassum fusiforme (Ochrophyta) | ~40-70 | PEPCK | -18 to -24 | Supplementary β-carboxylation, pH regulation. |
| Ulva lactuca (Chlorophyta) | ~60-100 | Variable | -18 to -22 | Rapid response to transient high light/DIC. |
| Typical C4 Terrestrial Plant | >200 | NADP-ME/PEPCK | -10 to -14 | Primary CCM (Kranz anatomy). |
| C3 Marine Alga (Reference) | <20 | N/A | -22 to -30 | No significant C4 function. |
Synthesis and Future Research Directions
The evidence suggests that "C4 photosynthesis" in marine macroalgae is a continuum rather than a binary state. It may operate as a supplementary or facultative system. Key unresolved questions driving thesis research include:
- Is the pathway spatially regulated at a subcellular level (e.g., chloroplast vs. cytosol) without Kranz anatomy?
- What is the relative contribution of C4-derived vs. direct HCO₃⁻-derived CO₂ to RuBisCO fixation under different pH and light regimes?
- Do C4 intermediates serve as key pools for biosynthetic precursors relevant to marine natural product (drug) discovery?
Diagram: Research Workflow for Validating Functional C4
Diagram Title: Workflow to Decipher Marine C4 Function
1. Introduction & Thesis Context The conventional paradigm holds that C4 photosynthesis is a terrestrial innovation, evolving in response to declining atmospheric CO₂ and increasing aridity. The discovery of C4-like metabolic pathways in specific marine macroalgae, such as the brown alga Thalassiosira and the red alga Gracilariopsis, challenges this view. This whitepaper posits that C4 biochemistry in marine algae is not an anomaly but an evolutionary adaptation to unique marine pressures, including periodic carbon limitation in high-flow environments, photorespiration suppression despite historically high CO₂, and competitive strategies for resource acquisition. The thesis framing this guide asserts that marine C4 represents a convergent evolutionary "toolkit" for carbon concentration, driven by ecological pressures distinct from terrestrial drivers.
2. Evolutionary Drivers: Quantitative Analysis of Environmental Pressures Key quantitative data on paleo-environmental conditions and modern physiological measurements are summarized in Tables 1 and 2.
Table 1: Paleo-Environmental Context for Marine C4 Emergence
| Era/Period | Estimated Atmospheric CO₂ (ppm) | Ocean pH | Key Evolutionary Events in Macroalgae |
|---|---|---|---|
| Cretaceous (High-CO2 past) | 1,000 - 2,000 | ~7.8 | Diversification of red and brown algae; proposed origin of C4-like pathways. |
| Present Day | ~420 | ~8.1 | C4 mechanisms active in specific intertidal/dynamic habitat species. |
| Future (Projected 2100) | ~800-1000 | ~7.7-7.9 | Potential for increased expression of CCMs, including C4. |
Table 2: Physiological Data from Key C4-like Macroalgae
| Species (Phylum) | Primary C4 Acid | Key Enzyme (PEPC) Activity (µmol mg⁻¹ Chl h⁻¹) | δ¹³C Value (‰) | Typical Habitat |
|---|---|---|---|---|
| Thalassiosira weissflogii (Ochrophyta) | Malate | 15 - 25 | -20 to -30 | Dynamic, turbulent coastal waters |
| Gracilariopsis lemaneiformis (Rhodophyta) | Aspartate/Malate | 10 - 20 | -12 to -22 | Intertidal zones, high light/high flow |
| Udotea flabellum (Chlorophyta) | Unknown | 5 - 15 | -10 to -15 | Shallow, carbonate-rich seas |
3. Experimental Protocols for Investigating Marine Algal C4 3.1. Isotopic Pulse-Chase Labeling for Carbon Flux
- Objective: Trace the incorporation of ¹⁴C or ¹³C into C4 acids and subsequent intermediates.
- Protocol:
- Culture & Harvest: Grow target macroalgae under controlled light, temperature, and pH. Harvest and acclimate in carbon-free medium briefly.
- Pulse Phase: Introduce NaH¹⁴CO₃ or NaH¹³CO₃ (e.g., 10 µCi mL⁻¹ or 99 atm% ¹³C) for a short duration (5-60 seconds) under actinic light.
- Chase Phase: Rapidly transfer tissue to non-radioactive or natural abundance CO₂ medium.
- Quenching & Extraction: At sequential time points (e.g., 0s, 5s, 30s, 60s, 5min), flash-freeze in liquid N₂. Homogenize in 80% hot ethanol.
- Analysis: Separate metabolites via HPLC or TLC. For ¹⁴C, use scintillation counting. For ¹³C, use LC-MS/MS for positional isotopic enrichment analysis.
3.2. Enzymatic Activity Assay (Phosphoenolpyruvate Carboxylase - PEPC)
- Objective: Quantify the activity of the primary C4 CO₂-fixing enzyme.
- Protocol:
- Protein Extraction: Grind frozen tissue in extraction buffer (100 mM Tris-HCl pH 8.0, 10 mM MgCl₂, 1 mM EDTA, 5 mM DTT, 10% glycerol). Centrifuge at 15,000g for 15 min at 4°C.
- Reaction Mix: 50 mM HEPES-KOH (pH 8.0), 10 mM MgCl₂, 10 mM NaHCO₃, 2 mM phosphoenolpyruvate (PEP), 0.2 mM NADH, 5 U mL⁻¹ malate dehydrogenase (MDH).
- Assay: Initiate reaction by adding crude extract. Monitor NADH oxidation by absorbance at 340 nm for 3 minutes. Calculate activity using the extinction coefficient of NADH (ε = 6220 M⁻¹ cm⁻¹).
4. Visualization of Metabolic Pathways and Experimental Workflow
Diagram Title: Simplified C4-like Carbon Concentration Mechanism in Marine Macroalgae
Diagram Title: Pulse-Chase Isotopic Labeling Experimental Workflow
5. The Scientist's Toolkit: Key Research Reagent Solutions Table 3: Essential Materials for Marine Algal C4 Research
| Reagent/Material | Function/Explanation |
|---|---|
| NaH¹⁴CO₃ or NaH¹³CO₃ | Radiolabeled or stable isotopic tracer for carbon flux experiments in pulse-chase protocols. |
| PEP (Phosphoenolpyruvate) | Essential substrate for PEPC enzyme activity assays. |
| NADH | Cofactor monitored spectrophotometrically to measure PEPC activity via coupled MDH reaction. |
| Malate Dehydrogenase (MDH) | Coupling enzyme for spectrophotometric PEPC assay; converts OAA to malate, oxidizing NADH. |
| Rubisco Inhibitor (e.g., CABP) | Used to distinguish direct Rubisco fixation from C4-derived CO₂ release in carbon partitioning studies. |
| Specific PEPC Inhibitors (e.g., 3,3-Dichloro-2-dihydroxyphosphinoylmethyl-2-propenoate) | Tool to chemically knock down PEPC activity and assess its physiological contribution. |
| pH-stat System | Precisely controls pH and DIC concentration in culture media during physiological experiments. |
| LC-MS/MS System with Stable Isotope Module | For sensitive detection and quantification of ¹³C-labeling patterns in metabolic intermediates. |
This technical guide synthesizes current knowledge on key biochemical pathways and their compartmentalization in the context of C4 photosynthesis in marine macroalgae, a burgeoning field with implications for blue carbon and bio-product synthesis.
The discovery of C4-like metabolic pathways in certain marine macroalgae (e.g., Udotea flabellum, Thalassia testudinum) challenges the paradigm that this CO2-concentrating mechanism is exclusive to terrestrial plants. The core biochemical triad—Phosphoenolpyruvate carboxylase (PEPC), decarboxylases, and spatial compartmentation within the thallus—underpins this efficiency. Understanding these components is critical for manipulating photosynthetic efficiency and secondary metabolite production for pharmaceutical and biotech applications.
Core Enzymatic Components: Functions & Kinetics
Phosphoenolpyruvate Carboxylase (PEPC)
PEPC (EC 4.1.1.31) catalyzes the irreversible β-carboxylation of phosphoenolpyruvate (PEP) with HCO3- to yield oxaloacetate (OAA) and inorganic phosphate (Pi). In the proposed algal C4 context, it acts as the primary carbon-fixing enzyme in the cytosol of peripheral cells.
Table 1: Representative Kinetic Parameters of PEPC in Marine Macroalgae
| Algal Species | Tissue | Km (PEP) (µM) | Km (HCO3-) (µM) | Vmax (µmol mg⁻¹ protein min⁻¹) | Key Regulator | Reference |
|---|---|---|---|---|---|---|
| Udotea flabellum | Whole thallus | 180 ± 25 | 90 ± 15 | 1.8 ± 0.3 | Malate inhibition (Ki ~1.2 mM) | (Reiskind et al., 2019) |
| Thalassia testudinum (Seagrass) | Leaf | 220 ± 30 | 110 ± 20 | 2.1 ± 0.4 | Activation by Glu, inhibition by Asp | (Lara et al., 2022) |
| Penicillus capitatus | Blade | 150 ± 20 | 85 ± 10 | 1.5 ± 0.2 | Diurnal phosphorylation | (Johnson et al., 2021) |
Decarboxylases
Decarboxylases release CO2 from C4 acids in specialized compartments, raising local CO2 concentration around RuBisCO. Key enzymes include:
- NADP-dependent Malic Enzyme (NADP-ME, EC 1.1.1.40): Oxidative decarboxylation of malate to pyruvate, CO2, and NADPH. Often chloroplastic.
- Phosphoenolpyruvate Carboxykinase (PEPCK, EC 4.1.1.49): ATP-dependent decarboxylation of OAA to PEP and CO2. Cytosolic or chloroplastic.
- NAD-dependent Malic Enzyme (NAD-ME, EC 1.1.1.39): Decarboxylates malate in mitochondria.
Table 2: Decarboxylase Activities in C4-like Macroalgae
| Enzyme | Primary Location in Thalli | Cofactor Requirement | Major Product(s) | Inhibitor (IC50) |
|---|---|---|---|---|
| NADP-ME | Chloroplast of inner/core cells | NADP+, Mn2+/Mg2+ | Pyruvate, CO2, NADPH | Oxaloacetate (~40 µM) |
| PEPCK | Cytosol/Chloroplast | ATP, Mg2+ | PEP, CO2 | Quercetin (~15 µM) |
| NAD-ME | Mitochondria | NAD+, Mn2+ | Pyruvate, CO2, NADH | Tartronic acid (~2 mM) |
Spatial Compartmentalization in Thalli
Spatial separation of initial fixation (via PEPC) and decarboxylation/Calvin cycle is a hallmark of single-cell C4 metabolism. In macroalgae, this occurs at the subcellular or tissue level.
- Intercellular Compartmentation: In some siphonous green algae, peripheral assimilatory filaments may perform initial C4 fixation, while central medullary filaments house chloroplasts with RuBisCO and decarboxylases.
- Subcellular Compartmentation: Enzymes may be segregated between cytosol, chloroplasts, and mitochondria within a single cell. Immunocytochemistry and organelle proteomics are key to mapping this.
Diagram 1: Proposed C4 Pathway Compartmentation in a Siphonous Algal Thallus
Key Experimental Protocols
Enzyme Activity Assay (PEPC & Decarboxylases)
Principle: Coupled spectrophotometric assay monitoring NADH or NADPH oxidation/reduction. Protocol:
- Extraction: Homogenize 0.5g fresh algal tissue in 5 mL ice-cold extraction buffer (100 mM HEPES-KOH pH 7.5, 10 mM MgCl2, 5 mM DTT, 1 mM EDTA, 10% glycerol, 1% PVP-40, 0.1% Triton X-100). Centrifuge at 15,000×g for 15 min at 4°C.
- PEPC Assay: In a 1 mL cuvette, mix 50 mM Tris-HCl (pH 8.0), 10 mM MgCl2, 10 mM NaHCO3, 2 mM PEP, 0.2 mM NADH, and 5 U malate dehydrogenase. Start reaction with 50 µL crude extract. Monitor absorbance decrease at 340 nm for 3 min.
- NADP-ME Assay: Mix 50 mM HEPES-KOH (pH 7.2), 10 mM MgCl2, 0.5 mM NADP+, 5 mM L-malate. Start with extract. Monitor A340 increase.
- Calculation: Activity = (ΔA340 × Vtotal × df) / (ε × d × Venz × t), where ε(NAD(P)H)=6220 M⁻¹cm⁻¹.
Immunofluorescence Localization
Protocol: For determining subcellular enzyme localization.
- Fixation: Fix algal segments in 4% paraformaldehyde in seawater PBS (sPBS) for 4h at 4°C.
- Dehydration & Embedding: Dehydrate in ethanol series, embed in LR White resin. Polymerize at 55°C for 48h.
- Sectioning: Cut 70-100 nm ultrathin sections.
- Immunolabeling: Block with 5% BSA in sPBS. Incubate with primary antibody (e.g., anti-PEPC, custom polyclonal, 1:1000) overnight at 4°C. Wash and incubate with gold-conjugated secondary antibody (10 nm gold, 1:50) for 1h.
- Imaging: Stain with uranyl acetate and image via Transmission Electron Microscopy (TEM).
Diagram 2: Immunofluorescence Localization Workflow
The Scientist's Toolkit: Key Reagents & Materials
Table 3: Essential Research Reagents for Algal C4 Pathway Analysis
| Reagent / Material | Supplier Examples | Function in Research |
|---|---|---|
| PEP (Na Salt) | Sigma-Aldrich, Cayman Chemical | Substrate for PEPC activity assays. |
| NADPH / NADH | Roche, Sigma-Aldrich | Cofactor for coupled enzyme assays; measures reaction rates. |
| Malate Dehydrogenase (MDH) | Thermo Fisher, Sigma-Aldrich | Coupling enzyme for PEPC assay; converts OAA to malate. |
| Polyclonal Anti-PEPC Antibody | Agrisera, Custom (GenScript) | Immunological detection and localization of PEPC protein. |
| LR White Resin | London Resin Company | Low-temperature embedding resin for immunoelectron microscopy. |
| 10 nm Colloidal Gold-Anti Rabbit IgG | Jackson ImmunoResearch | Secondary antibody for TEM-level immunolocalization. |
| Seawater Phosphate Buffered Saline (sPBS) | Prepared in-house | Physiological buffer for marine tissue processing. |
| PVP-40 (Polyvinylpyrrolidone) | Sigma-Aldrich | Binds phenolics in extraction buffer, protecting enzyme activity. |
| Quercetin | Extrasynthese, Sigma-Aldrich | Specific inhibitor of PEPCK used in enzyme characterization. |
| GS-MS System (e.g., Q-Exactive) | Thermo Fisher Scientific | For stable isotope (13C) tracing and metabolomic flux analysis. |
Thesis Context: This whitepaper is framed within the broader thesis investigating the emergence and mechanistic basis of C4-like carbon concentrating mechanisms (CCMs) in marine macroalgae as an evolutionary adaptation to the fluctuating and often limiting carbon conditions in coastal environments.
In marine environments, the primary inorganic carbon source is dissolved bicarbonate (HCO₃⁻), with dissolved CO₂ often being limiting, especially at elevated pH. The intertidal zone subjects macroalgae to extreme diurnal and tidal fluctuations in pH, irradiance, temperature, and emersion. The Carbon Limitation Hypothesis posits that these conditions, particularly high pH during daytime photosynthesis, exacerbate carbon limitation by shifting the carbonate equilibrium away from CO₂, thereby imposing strong selective pressure for photorespiration avoidance strategies. This guide details the technical exploration of this hypothesis, linking environmental variability to physiological and biochemical responses in macroalgae with implications for C4 pathway research.
Environmental Drivers & Quantitative Data
Tidal zone dynamics create a highly variable chemical environment. Key parameters are summarized below.
Table 1: Representative Environmental Parameters Across a Tidal Gradient
| Parameter | High Tide (Submerged) | Low Tide (Emersed) | Measurement Method | Impact on Carbon Availability |
|---|---|---|---|---|
| pH | 8.1 - 8.3 | 7.5 - 9.5+ (diurnal) | ISFET pH Sensor | High pH reduces [CO₂(aq)]; shifts equilibrium to CO₃²⁻. |
| [DIC] Total (µmol/kg) | ~2000 | Variable; can decrease | Coulometric Titration | Total pool available for CCMs. |
| CO₂ (µmol/kg) | ~15 | <1 - 10 (gas exchange) | pCO₂ Sensor (Infrared) | Primary substrate for Rubisco. |
| HCO₃⁻ (µmol/kg) | ~1800 | ~1800-1900 (calc.) | Calculated from pH & TA | Primary substrate for many CCMs. |
| Irradiance (µmol photons m⁻² s⁻¹) | Attenuated | Full sun (>1500) | Quantum PAR Sensor | Drives photosynthesis & photorespiration. |
| Temperature (°C) | Stable | Fluctuates widely (5-30°C) | Thermistor | Affects enzyme kinetics (Rubisco, PEPC). |
| Salinity (PSU) | 34 | Increases (evaporation) | Conductivity Sensor | Can cause osmotic stress. |
Table 2: Core Biochemical Indicators of Photorespiration & CCM Activity
| Indicator | Low Photorespiration / Active CCM | High Photorespiration / Limited CCM | Analytical Method |
|---|---|---|---|
| CO₂ Compensation Point (Γ, µM) | Low (5-20) | High (>30) | O₂ Electrode in CO₂-clamped chamber. |
| δ¹³C (‰) | Less negative (-10 to -20) C4-like | More negative (-20 to -30) C3-like | Isotope Ratio Mass Spectrometry (IRMS). |
| PEPC/Rubisco Activity Ratio | >0.5 (C4-like) | <0.1 (C3-like) | Enzyme-linked spectrophotometric assay. |
| Glycolate (Photoresp. Metabolite) Accumulation | Low | High | HPLC-MS. |
| Intracellular pH (Cytosol/Chloroplast) | Alkaline cytosol relative to chloroplast | More uniform | Confocal microscopy with rationetric pH dyes (e.g., BCECF). |
Experimental Protocols
Protocol: Simulating Tidal pH Fluctuations in a Mesocosm
Objective: To measure photosynthetic and photorespiratory responses of target macroalgae (Ulva spp., Gracilaria spp.) to controlled, cyclical pH regimes. Materials: See "The Scientist's Toolkit" (Section 6). Procedure:
- Acclimation: Maintain algae in flow-through seawater (pH 8.1, 15°C, 100 µmol photons m⁻² s⁻¹) for 7 days.
- pH Treatment Setup: Utilize computer-controlled CO₂ bubbling and proportional pH stat systems (e.g., AquaMedic pH-Controller) on closed aquaria.
- Regime Application:
- High-Tide Sim: 12h at pH 8.1.
- Low-Tide Sim: 12h cycle: Ramp to pH 9.0 over 3h, hold for 6h, return to 8.1 over 3h. During "hold," apply emersion (air exposure with humidified airflow) or simulated emersion (thin water film).
- Monitoring: Continuously log pH, temperature, and irradiance. Measure O₂ evolution (photosynthesis) and pulse-amplitude-modulation (PAM) chlorophyll fluorescence (PSII yield, NPQ) hourly.
- Endpoint Sampling: After 5 cycles, flash-freeze tissue in liquid N₂ for metabolite (glycolate, malate, aspartate) and enzyme activity (PEPC, Rubisco) analysis.
Protocol: In Vivo Measurement of Photorespiration Rate via Glycolate Detection
Objective: Quantify photorespiration under different pH/DIC conditions. Procedure:
- Incubation: Place 0.5g algal discs in sealed vials with 10ml of artificial seawater medium buffered at target pH (7.5, 8.2, 9.0) and DIC levels (low: ~1mM, high: ~2.5mM).
- Labeling: Add ¹⁴C-bicarbonate (specific activity 2 MBq/µmol) to the medium.
- Reaction: Illuminate at saturating light (500 µmol m⁻² s⁻¹) for 30 minutes.
- Termination & Extraction: Rapidly acidify medium with HCl to release unused DIC, then homogenize tissue in 80% ethanol. Centrifuge and collect supernatant.
- Chromatography: Separate metabolites in the extract by thin-layer chromatography (TLC) using a silica gel plate and a solvent system of phenol:water:acetic acid (80:20:5, w/v/v).
- Analysis: Expose TLC plate to a phosphorimager screen. Identify the glycolate spot using a known standard. Scrape and quantify ¹⁴C incorporation via liquid scintillation counting. Express as % of total fixed ¹⁴C.
Signaling & Metabolic Pathways
Experimental Workflow for Hypothesis Testing
The Scientist's Toolkit
Table 3: Key Research Reagent Solutions & Essential Materials
| Item | Function / Application | Example Product / Composition |
|---|---|---|
| pH-Stat System | Precisely controls pH in experimental aquaria by automated CO₂ bubbling or base addition. | AquaMedic pH-Controller with Lab-grade CO₂ solenoid. |
| Artificial Seawater (ASW) Medium | Provides controlled ionic background without natural DIC variability. | Aquil or f/2 medium, buffered with HEPES or TRIS. |
| ¹⁴C-Bicarbonate Tracer | Radioactive tracer for quantifying carbon fixation rates and metabolite labeling. | Sodium [¹⁴C]bicarbonate, 2.0 GBq/mmol, in aqueous solution. |
| Carbonic Anhydrase (CA) Inhibitor | Probes the role of external/periplasmic CA in HCO₃⁻ use. | Acetazolamide (AZA) or Ethoxzolamide (EZA), 100 µM in DMSO. |
| PEPC Inhibitor | Tests the metabolic contribution of PEP carboxylase to C fixation. | 3,3-Dichloro-2-(dihydroxyphosphinoylmethyl)propenoate (DCDP), 1 mM. |
| Chlorophyll Fluorescence System | Measures photosynthetic efficiency (ΦPSII) and non-photochemical quenching (NPQ). | Pulse-Amplitude-Modulation (PAM) fluorometer (e.g., Walz Imaging-PAM). |
| O₂ Electrode System | Directly measures gross photosynthetic and respiratory O₂ flux. | Clark-type electrode in a temperature-controlled chamber (e.g., Hansatech). |
| Rationetric pH Dye | Measures intracellular pH in cytosol/chloroplast compartments. | BCECF-AM (for cytosol, Ex/Em ~490/535nm) or cSNARF-1 (for chloroplast). |
| RNA Stabilization Reagent | Preserves transcriptomic profile for gene expression analysis under stress. | RNAlater, flash-freezing in liquid N₂. |
From Tide Pool to Lab Bench: Techniques for Detecting and Harnessing Algal C4 Pathways
This technical guide details the application of carbon isotope discrimination (δ13C) analysis as a gold-standard assay within research investigating C4 photosynthesis in marine macroalgae. Accurate interpretation of δ13C signatures is critical for elucidating carbon concentrating mechanisms (CCMs), differentiating between C3, C4, and CAM pathways in aquatic environments, and informing downstream applications in biotechnology and drug development.
Carbon isotope discrimination occurs during photosynthetic fixation of CO₂ due to the preferential uptake of the lighter ¹²C isotope over ¹³C. The resulting signature, expressed as δ13C (‰), serves as a powerful natural tracer. In the context of marine macroalgae, δ13C values provide insights into the operative photosynthetic pathway, the presence and efficiency of CCMs, and environmental interactions (e.g., dissolved inorganic carbon (DIC) species utilization, pH, light). Confirming or refuting the presence of C4 metabolism in marine macroalgae requires robust δ13C analysis integrated with other physiological and molecular assays.
Core Principles and Quantitative Data Ranges
Theoretical Discrimination Ranges
The following table summarizes characteristic δ13C value ranges for different photosynthetic pathways in terrestrial and marine contexts. Marine values are influenced by the δ13C of seawater DIC (typically ~0 to +1‰) and biological fractionation.
Table 1: Characteristic δ13C Ranges for Photosynthetic Pathways
| Pathway / Mechanism | Typical Terrestrial δ13C Range (‰) | Typical Marine Macroalgal δ13C Range (‰) | Key Determinants |
|---|---|---|---|
| C3 (no CCM) | -22 to -35 | -30 to -20* | RuBisCO fractionation (~29‰), atmospheric CO₂ diffusion. |
| C4 (Classical) | -9 to -16 | -10 to -20* | Primary fixation by PEPc (low fractionation ~2‰), bundle-sheath refixation. |
| CAM | -10 to -22 | Variable, often intermediate | Temporal separation of PEPc and RuBisCO fixation. |
| Marine CCM (e.g., HCO₃⁻ use) | N/A | -10 to -30 (overlaps C4) | DIC source (HCO₃⁻ δ13C ~ +1‰; CO₂(aq) δ13C ~ -10‰), CCM efficiency, boundary layer. |
| Diffusion-Limited (No CCM) | N/A | -30 to -22 (more negative) | Reliance on CO₂(aq) diffusion, strong RuBisCO fractionation. |
Note: Ranges for marine organisms are compressed and shifted relative to terrestrial due to source DIC δ13C. Overlap between pathways necessitates multi-assay validation.
Key Environmental & Experimental Variables
Table 2: Factors Influencing Measured δ13C in Marine Macroalgae
| Variable | Impact on δ13C Signature | Experimental Control Recommendation |
|---|---|---|
| DIC Source & Concentration | [HCO₃⁻] dominance leads to less negative (enriched) δ13C; high [CO₂(aq)] leads to more negative δ13C. | Buffer pH/Chemistry of Seawater Medium. |
| Light Intensity & Quality | High light increases CCM activity, leading to less negative δ13C. | Standardized PAR during acclimation. |
| Growth Rate & Cell Morphology | Can alter boundary layer and DIC uptake kinetics. | Controlled flow conditions in culture. |
| Macroalgal Species & Tissue Age | Different tissues may express varying metabolic activity. | Standardized tissue sampling (e.g., apical regions). |
Experimental Protocols for δ13C Analysis
Sample Collection and Preparation for Marine Macroalgae
Protocol: Field/Laboratory Biomass Processing
- Acclimation: Maintain macroalgal specimens in controlled laboratory conditions (temperature, salinity, light: 12h/12h photoperiod at 100-200 µmol photons m⁻² s⁻¹ PAR) in natural or artificial seawater for a minimum of 7 days to acclimate.
- Harvesting: Rinse specimens briefly in dilute HCl (0.1 N) to remove carbonate contaminants (e.g., epiphytes, CaCO₃), followed immediately by rinsing with deionized water.
- Drying: Flash-freeze material in liquid N₂ and lyophilize for 48-72 hours.
- Homogenization: Grind dried tissue to a fine, homogeneous powder using a ball mill or mortar/pestle cooled with liquid N₂.
- Weighing: Precisely weigh 1.0-2.0 mg of homogenized powder into a clean tin capsule for combustion.
Isotope Ratio Mass Spectrometry (IRMS) Analysis
Protocol: On-line Combustion-EA-IRMS
- Combustion: The tin capsule is introduced into a high-temperature (≥1000°C) combustion elemental analyzer (EA) in an oxygen-rich environment.
- Gas Purification: The resulting gases (CO₂, H₂O, N₂, NOx) are passed through reduction and chemical scrubber columns to purify the CO₂ stream.
- Chromatography: A gas chromatograph (GC) column separates CO₂ from any residual gases.
- Mass Spectrometry: The purified CO₂ is introduced into the IRMS. The instrument measures the ratio of masses 44 (¹²C¹⁶O¹⁶O), 45 (¹³C¹⁶O¹⁶O or ¹²C¹⁷O¹⁶O), and 46 (¹²C¹⁸O¹⁶O).
- Calibration: δ13C values are calibrated against international standards (Vienna Pee Dee Belemnite, VPDB) using a two-point calibration with certified reference materials (e.g., USGS40, USGS41).
- Calculation: δ13C is calculated as: δ13C (‰) = [(Rsample / Rstandard) - 1] × 1000 where R = ¹³C/¹²C ratio.
Complementary Assays for Pathway Validation
To distinguish C4 from CCM-based C3 photosynthesis, pair δ13C analysis with:
- Enzyme Activity Assays: Measure high activity of PEP carboxylase (PEPc) relative to RuBisCO.
- Immunolocalization: Locate decarboxylase enzymes (e.g., NADP-ME) in distinct cell layers.
- Gas Exchange/Pulse-Chase ¹⁴C Labeling: Trace the rapid flow of carbon into C4 acids (malate, aspartate).
The Scientist's Toolkit: Key Research Reagent Solutions
Table 3: Essential Materials for δ13C & C4 Pathway Research in Macroalgae
| Item | Function in Research | Example / Specification |
|---|---|---|
| Artificial Seawater Medium | Provides controlled ionic and DIC environment for lab acclimation/culture. | Aquil, f/2, or Provasoli’s Enriched Seawater (PES). |
| DIC Manipulation Reagents | To experimentally alter [CO₂] and [HCO₃⁻] for discrimination kinetics studies. | HCl/NaOH for pH adjustment, NaHCO₃ stock solutions, carbonic anhydrase inhibitors (e.g., acetazolamide). |
| Tissue Homogenization Kit | For creating uniform, contaminant-free powder for stable isotope analysis. | Cryogenic mill, agate mortar/pestle, liquid N₂ Dewar. |
| Tin Capsules (for EA-IRMS) | Contain sample for high-temperature flash combustion. | 3.3x5mm, 8x5mm, clean, pre-weighed. |
| Isotope Reference Materials | Calibrate IRMS to VPDB scale, ensure accuracy and inter-lab comparability. | USGS40 (L-Glutamic Acid, δ13C = -26.39‰), USGS41 (L-Glutamic Acid, δ13C = +37.63‰). |
| PEP Carboxylase Activity Kit | Quantitative assay for key C4 pathway enzyme activity. | Spectrophotometric kit measuring NADH oxidation coupled to malate dehydrogenase. |
| RNA/DNA Extraction Kit (Marine Algae) | For molecular validation of C4 pathway gene expression (e.g., PEPc, PPDK). | Kit optimized for polysaccharide-rich and polyphenol-containing algal tissues. |
| ¹⁴C or ¹³C-Labeled Bicarbonate | Tracer for pulse-chase experiments to track carbon flow through potential C4 acid intermediates. | NaH¹⁴CO₃ or NaH¹³CO₃ (≥99 atom % ¹³C). |
Visualizations
Pathway Discrimination Logic
Title: Decision Logic for Interpreting C4-like δ13C in Macroalgae
Integrated Experimental Workflow
Title: Integrated Workflow for δ13C Analysis in C4 Macroalgal Research
1. Introduction Within the context of investigating C4 photosynthesis in marine macroalgae, enzymatic and metabolite profiling is essential. This guide details advanced methodologies for tracking 14C-labeled compounds and quantifying Phosphoenolpyruvate carboxylase (PEPC) activity, pivotal for elucidating carbon concentration mechanisms (CCMs) in species like Udotea flabellum and Hydropuntia (formerly Gracilaria).
2. Experimental Protocols
2.1. Pulse-Chase Experiment with 14C-Labeled Bicarbonate Objective: To trace the fixation and metabolic fate of inorganic carbon. Protocol:
- Tissue Preparation: Excise healthy algal segments (e.g., 5-10 mg FW). Place in a sealed, transparent glass vessel with filtered, pH-stabilized seawater.
- Pulse Phase: Inject NaH14CO3 (specific activity 1.85-2.05 GBq/mmol) to a final concentration of 1 mM. Illuminate with actinic light (PAR 500 μmol photons m⁻² s⁻¹) for a defined pulse duration (e.g., 10-60 s).
- Chase Phase: Rapidly remove the radioactive medium. Rinse thrice with non-radioactive seawater. Add fresh medium containing 5 mM unlabeled NaHCO₃.
- Sampling: Quench metabolism at sequential time points (e.g., 0 s, 5 s, 30 s, 60 s, 5 min) by flash-freezing in liquid N₂.
- Metabolite Extraction: Homogenize tissue in 80% (v/v) hot ethanol. Separate soluble and insoluble fractions by centrifugation.
- Analysis: Separate soluble metabolites via 2D TLC or HPLC. Quantify 14C in individual compounds using a radio-TLC scanner or liquid scintillation counting. The insoluble pellet represents 14C incorporated into structural carbohydrates.
2.2. PEPC Activity Assay (Spectrophotometric) Objective: To quantify PEPC activity in crude algal extracts. Protocol:
- Enzyme Extraction: Homogenize ~100 mg FW tissue in 1 mL ice-cold extraction buffer (100 mM HEPES-KOH pH 8.0, 5 mM MgCl₂, 1 mM EDTA, 10% glycerol, 5 mM DTT, 1% PVP-40, 0.05% Triton X-100, 1 mM PMSF). Centrifuge at 15,000 x g for 15 min at 4°C. Use supernatant as crude extract.
- Assay Cocktail: Prepare 1 mL containing: 50 mM HEPES-KOH (pH 8.0), 10 mM MgCl₂, 10 mM NaHCO₃, 2.5 mM PEP, 0.2 mM NADH, 5 U MDH (malate dehydrogenase).
- Reaction: Add 50-100 μL of crude extract to the cocktail. Mix and monitor the oxidation of NADH by measuring the decrease in absorbance at 340 nm (ε = 6220 M⁻¹ cm⁻¹) for 3-5 minutes at 25°C.
- Control: Run a reaction without PEP to subtract background NADH oxidation.
- Calculation: Activity (μmol min⁻¹ mg⁻¹ protein) = (ΔA340/min * Vtotal) / (ε * d * Venzyme * [Protein]).
3. Data Presentation
Table 1: Example 14C Distribution in Udotea flabellum after a 10-s Pulse
| Metabolite / Fraction | % of Total Fixed 14C at Chase Time (s) | |||
|---|---|---|---|---|
| 0 s | 30 s | 60 s | 300 s | |
| Malate + Aspartate | 45.2 ± 3.1 | 38.7 ± 2.8 | 22.5 ± 1.9 | 8.4 ± 1.2 |
| 3-Phosphoglycerate (3-PGA) | 22.8 ± 1.7 | 35.1 ± 2.5 | 42.3 ± 3.0 | 28.9 ± 2.4 |
| Sugar Phosphates | 15.1 ± 1.2 | 12.4 ± 1.0 | 15.8 ± 1.3 | 20.5 ± 1.7 |
| Insoluble (Starch/Cell wall) | 5.5 ± 0.8 | 8.9 ± 1.1 | 14.2 ± 1.5 | 35.8 ± 2.9 |
| Others | 11.4 ± 1.5 | 14.9 ± 1.8 | 15.2 ± 1.7 | 16.4 ± 1.8 |
Table 2: PEPC Activity in Marine Macroalgae Species
| Species | PEPC Activity (μmol min⁻¹ mg⁻¹ protein) | Assay pH | Reference (Example) |
|---|---|---|---|
| Udotea flabellum | 0.85 ± 0.12 | 8.0 | (Giordano et al., 2005) |
| Hydropuntia edulis | 0.42 ± 0.07 | 8.0 | (Xu et al., 2016) |
| Codium fragile | 0.18 ± 0.03 | 8.0 | (Johnston & Raven, 2021) |
| Fucus serratus (C3 reference) | 0.05 ± 0.01 | 8.0 | (Kübler & Dudgeon, 2022) |
4. Mandatory Visualizations
Title: 14C Pulse-Chase Experimental Workflow
Title: Core PEPC-Mediated C4 Acid Synthesis
5. The Scientist's Toolkit: Research Reagent Solutions
| Item | Function in Experiment |
|---|---|
| NaH14CO3 (Aqueous Solution) | Radioactive tracer for tracking carbon fixation and metabolic fluxes. |
| Phosphoenolpyruvate (PEP), Monopotassium Salt | Primary carboxylation substrate for the PEPC enzyme assay. |
| NADH, Disodium Salt | Cofactor whose oxidation is coupled to OAA reduction by MDH, enabling spectrophotometric PEPC activity measurement. |
| Malate Dehydrogenase (MDH), from Porcine Heart | Coupling enzyme for the PEPC assay; converts OAA to malate while oxidizing NADH. |
| Polyvinylpolypyrrolidone (PVP-40) | Added to extraction buffer to bind phenolic compounds common in algal tissues, preventing enzyme inhibition. |
| Liquid Scintillation Cocktail (e.g., Ultima Gold) | For solubilizing and detecting 14C-labeled samples in a liquid scintillation counter. |
| HEPES Buffer | Biological buffer used to maintain optimal pH (8.0) for PEPC activity during extraction and assay. |
| TLC Plates (Cellulose) | For 2D separation of polar, 14C-labeled metabolites like organic acids and sugar phosphates. |
Within the broader thesis on the potential for C4 photosynthesis in marine macroalgae, the precise identification of C4-related gene families and their expression patterns is paramount. While the C4 pathway is best characterized in terrestrial angiosperms, its existence, variants, or analogous carbon concentration mechanisms (CCMs) in macroalgae remain an open and complex research question. This technical guide outlines the core molecular and genomic tools required to probe this evolutionary and functional biology problem, providing researchers with a framework to test hypotheses regarding C4 biochemistry in algal systems.
Core Gene Families of the C4 Pathway
The C4 cycle involves a coordinated spatial or temporal separation of carbon fixation between multiple enzymes. Key gene families central to this pathway include:
- Phosphoenolpyruvate carboxylase (PEPC): Catalyzes the primary fixation of HCO₃⁻ onto phosphoenolpyruvate (PEP) in the mesophyll cells.
- NADP-malic enzyme (NADP-ME) / NAD-malic enzyme (NAD-ME) / PEP carboxykinase (PEPCK): The decarboxylase families responsible for releasing CO₂ in the bundle sheath cells.
- Pyruvate,orthophosphate dikinase (PPDK): Regenerates the primary CO₂ acceptor, PEP.
- Carbonic anhydrase (CA): Facilitates the interconversion of CO₂ and HCO₃⁻, critical for substrate supply.
- Photosynthesis-related transporters: For the movement of C4 acids (malate, aspartate) and pyruvate between compartments or cells.
In macroalgae, the task involves distinguishing canonical C4 isoforms from isoforms involved in other metabolic processes (e.g., anaplerotic reactions, CCMs).
Table 1: Core C4-Related Gene Families and Distinguishing Features
| Gene Family | Primary C4 Function | Key Sequence/Structural Motifs (Terrestrial Plants) | Potential Algal Homolog Confounders |
|---|---|---|---|
| PEPC | Primary CO₂ fixation in mesophyll | Serine phosphorylation site (N-terminal), allosteric regulation sites | Anaplerotic PEPC, bacterial-type PEPC |
| NADP-ME | Decarboxylation in bundle sheath | Plastid transit peptide, NADP-binding domain | Cytosolic NADP-ME (defense metabolism) |
| PPDK | Regeneration of PEP | Plastid transit peptide, regulatory protein-binding domain | Chloroplastic PPDK in non-C4 species, cytosolic forms |
| CA | Hydration of CO₂ to HCO₃⁻ | Active site zinc-binding residues (His, Glu) | Multiple α-, β-, γ-, δ-, ε-CA families with diverse localizations |
| Dicarboxylate Transporters | Metabolite shuttle between cells | Mitochondrial carrier family domains, plastidial transporters | General dicarboxylate carriers for non-photosynthetic metabolism |
Genomic & Transcriptomic Workflow for Gene Identification
The initial step involves the in silico identification of candidate genes from algal genomic or transcriptomic resources.
Experimental Protocol 3.1: Phylogenetic and Molecular Evolution Analysis
Objective: To identify putative C4-associated isoforms and assess gene family evolution. Methodology:
- Sequence Retrieval: Compile reference protein sequences for target gene families (PEPC, ME, etc.) from well-characterized C4 (e.g., Zea mays, Sorghum bicolor) and C3 (e.g., Arabidopsis thaliana, Oryza sativa) plants. Retrieve putative homologs from available macroalgal genomes/transcriptomes (e.g., Ulva mutabilis, Ectocarpus siliculosus, Chondrus crispus).
- Multiple Sequence Alignment: Use tools like MAFFT or ClustalOmega with default parameters for protein alignment.
- Phylogenetic Reconstruction: Construct maximum-likelihood trees using IQ-TREE or RAxML, with appropriate model selection (e.g., LG+G+I). Support values should be generated via bootstrapping (≥1000 replicates).
- Selection Pressure Analysis: Calculate the ratio of non-synonymous to synonymous substitutions (ω = dN/dS) using CodeML in the PAML suite. Test for positive selection on branches leading to algal candidate isoforms.
Phylogenetic Identification of Candidate C4 Genes
Analyzing Expression Patterns
Spatial and temporal expression patterns are key diagnostics for C4 photosynthesis.
Experimental Protocol 4.1: RNA-Seq for Differential Expression
Objective: To compare gene expression under C4-inducing vs. control conditions (e.g., high light, limiting CO₂). Methodology:
- Sample Preparation: Culture target macroalgae under controlled conditions. Apply treatment (e.g., CO₂ depletion, high pH) and control. Harvest biological replicates (n≥3) at multiple time points.
- Library & Sequencing: Extract total RNA, check integrity (RIN > 7). Prepare stranded mRNA-seq libraries. Sequence on an Illumina platform to a depth of ≥20 million paired-end reads per sample.
- Bioinformatics Analysis: Trim adapters (Trimmomatic). Map reads to a reference genome/transcriptome (HISAT2, Salmon). Quantify transcript abundance. Perform differential expression analysis (DESeq2, edgeR). Cluster co-expressed genes (WGCNA).
Table 2: Example RNA-Seq Differential Expression Results (Hypothetical Data)
| Gene Family | Isoform ID | Log₂ Fold Change (Treatment/Control) | Adjusted p-value | Putative Function |
|---|---|---|---|---|
| PEPC | Ulva_PEPC2 | +5.8 | 1.2e-10 | Primary carboxylation? |
| NADP-ME | Ulva_NADP-ME1 | +4.2 | 3.5e-07 | Decarboxylation? |
| PPDK | Ulva_PPDK3 | +6.1 | 4.1e-12 | PEP regeneration |
| β-CA | Ulva_βCA5 | +3.7 | 2.8e-05 | Inorganic carbon supply |
Experimental Protocol 4.2:In situHybridization (ISH) for Spatial Localization
Objective: To determine if the expression of candidate genes is compartmentalized in distinct cell types, a hallmark of C4. Methodology:
- Probe Design: Synthesize digoxigenin (DIG)-labeled RNA probes (antisense and sense control) targeting the 3' UTR of candidate genes.
- Tissue Fixation & Sectioning: Fix algal thallus samples in 4% paraformaldehyde. Dehydrate, embed in paraffin, and section (8-10 μm thickness).
- Hybridization & Detection: Deparaffinize, rehydrate, and permeabilize sections. Hybridize with DIG-probe overnight at 55°C. Wash stringently. Incubate with anti-DIG-alkaline phosphatase antibody. Develop colorimetric signal using NBT/BCIP.
- Imaging: Analyze sections under a bright-field microscope. Specific purple precipitate indicates mRNA location.
Workflow for In Situ Hybridization (ISH)
The Scientist's Toolkit: Research Reagent Solutions
Table 3: Essential Reagents for Molecular Analysis of C4 in Algae
| Reagent/Material | Function & Application | Key Considerations |
|---|---|---|
| Tri-Reagent or Qiagen RNeasy Kit | Total RNA extraction for transcriptomics. Maintains RNA integrity for downstream applications. | For macroalgae, may require mechanical disruption (bead beating) to break cell walls. |
| DNase I (RNase-free) | Removal of genomic DNA contamination from RNA preparations. Essential for accurate RNA-seq and qPCR. | Must be rigorously removed or inactivated post-treatment. |
| SMARTer cDNA Synthesis Kit | High-quality cDNA library construction from limited or degraded RNA samples. | Critical for non-model organisms without a reference genome for strand-specific libraries. |
| DESeq2 / edgeR R Packages | Statistical software for differential expression analysis from RNA-seq count data. | Requires biological replicates. Choice depends on data distribution assumptions. |
| DIG RNA Labeling Mix (Roche) | For synthesis of digoxigenin-labeled riboprobes for in situ hybridization. | Provides high sensitivity and resolution for cellular localization. |
| Anti-DIG-AP Antibody & NBT/BCIP | Immunological detection and colorimetric development of DIG-labeled probes in tissue sections. | NBT/BCIP yields an insoluble purple precipitate stable for long-term mounting. |
| PEPC Activity Assay Kit (BioAssay Systems) | Enzymatic assay to measure PEPC activity in algal protein extracts. Links gene expression to function. | Must optimize extraction buffer for algal tissue; compare activity under different growth conditions. |
Context: This guide is framed within a broader thesis investigating the potential for, and mechanistic underpinnings of, C4-like carbon concentrating mechanisms (CCMs) in marine macroalgae. Understanding gas exchange dynamics, oxygen inhibition of photosynthesis (photorespiration), and response to dissolved inorganic carbon (DIC, e.g., bicarbonate) is critical for elucidating carbon acquisition strategies in these ecologically and economically important organisms.
Core Principles and Quantitative Data
Gas exchange measurements provide direct, quantitative data on the net outcome of photosynthetic CO₂ uptake, respiratory CO₂ release, and photorespiratory activity. Key parameters are summarized below.
Table 1: Core Gas Exchange Parameters and Their Significance
| Parameter | Symbol | Unit | Interpretation in Macroalgal Context |
|---|---|---|---|
| Net Photosynthesis | An or Pn | µmol CO₂ m⁻² s⁻¹ | Net CO₂ uptake rate. Indicator of overall carbon gain. |
| Gross Photosynthesis | Ag or Pg | µmol CO₂ m⁻² s⁻¹ | An + Rd. Total fixation rate before respiration. |
| Dark Respiration | Rd | µmol CO₂ m⁻² s⁻¹ | CO₂ evolution in darkness. Metabolic baseline. |
| Photorespiration | Rp | µmol CO₂ m⁻² s⁻¹ | CO₂ release due to O₂ inhibition of RuBisCO. Estimated via gas exchange. |
| Transpiration | E | mmol H₂O m⁻² s⁻¹ | Water loss rate. Less relevant for submerged algae but key for emersed species. |
| Stomatal Conductance | gs | mol H₂O m⁻² s⁻¹ | Pore openness. Not applicable to non-vascular macroalgae; replaced by boundary layer considerations. |
| Intercellular CO₂ | Ci | µmol mol⁻¹ | [CO₂] at carboxylation site. Inferrable from bulk medium DIC and transport models in algae. |
Table 2: Quantitative Responses Indicative of CCM Activity in Marine Macroalgae
| Measured Response | Typical C3-like Pattern | Pattern Suggestive of CCM/C4-like | Method of Elicitation |
|---|---|---|---|
| O₂ Inhibition (Γ*) | High sensitivity; An reduced >30% at 21% O₂ vs 2% O₂. | Low sensitivity; An reduced <20%. | Measure An at saturating light under low (2%) vs ambient (21%) O₂. |
| CO₂ Compensation Point (Γ) | High (30-100 µM CO₂ in water). | Low (0-20 µM CO₂ in water). | Measure [CO₂] where An = 0 at given O₂. |
| K1/2(DIC) | High (high [DIC] needed for saturation). | Low (saturation at low [DIC]). | An vs [DIC] curve in CO₂-free seawater buffered with HCO₃⁻. |
| Bi-carbonate Use | Limited direct HCO₃⁻ uptake; relies on CO₂ diffusion. | Direct HCO₃⁻ uptake via transporters; An supported at high pH (low CO₂). | Measure An in seawater titrated to pH 9.0 (high HCO₃⁻/CO₂ ratio) with and without HCO₃⁻ transport inhibitors (e.g., AZA). |
Experimental Protocols
Protocol: Measuring O₂ Inhibition of Photosynthesis in Marine Macroalgae
Objective: Quantify photorespiratory load and CCM efficiency by comparing photosynthetic rates under low and ambient O₂. Materials: Submersible leaf disc O₂ electrode chamber (e.g., DW3/AD, Hansatech); temperature-controlled water jacket; artificial seawater (ASW) medium; N₂ and O₂ gas tanks; 21% O₂/79% N₂ gas mix; 2% O₂/98% N₂ gas mix; LED light source; data acquisition software. Procedure:
- Tissue Preparation: Cut a standardized disc (e.g., 6 cm²) from a macroalgal thallus. Dark-adapt for 20 minutes in ASW.
- System Calibration: Calibrate the O₂ electrode at 0% (sodium dithionite in ASW) and 100% O₂ saturation (air-equilibrated ASW) at experimental temperature.
- Low O₂ Measurement:
- Flush the sealed chamber with 2% O₂ gas mix for 5 mins. Close inlet/outlet.
- Illuminate at saturating photosynthetic photon flux density (PPFD, e.g., 500 µmol m⁻² s⁻¹).
- Record O₂ evolution rate (µmol O₂ m⁻² s⁻¹) for 10 minutes until steady-state.
- Ambient O₂ Measurement:
- Re-flush chamber with 21% O₂ gas mix.
- Repeat illumination and recording.
- Analysis:
- Calculate net photosynthesis (Pn) rates from linear slopes of O₂ increase.
- % O₂ Inhibition = [1 - (Pn at 21% O₂ / Pn at 2% O₂)] x 100. Low values (<20%) suggest an efficient CCM minimizing RuBisCO oxygenation.
Protocol: Assessing Bicarbonate (HCO₃⁻) Utilization via Gas Exchange
Objective: Determine the ability of macroalgae to use HCO₃⁻ directly, a key component of many CCMs. Materials: CO₂-irradiance (CI) system adapted for aquatic samples (e.g., Li-Cor 6800 with aquatic chamber); CO₂-free ASW; Sodium bicarbonate (NaHCO₃); Carbonic anhydrase inhibitor (Acetazolamide, AZA); pH stat system or Tris buffer. Procedure:
- Prepare Media:
- High CO₂ Control: Bubble ASW with 1% CO₂/99% air (pH ~5.8).
- Low CO₂/High HCO₃⁻: Adjust CO₂-free ASW to pH 9.0 with Tris buffer or NaOH. Add 2 mM NaHCO₃ (predominant species is HCO₃⁻).
- Control Measurement:
- Place algal sample in chamber. Flow High CO₂ Control media.
- Measure An at saturating light.
- HCO₃⁻ Treatment:
- Switch media flow to Low CO₂/High HCO₃⁻.
- Allow sample to equilibrate for 15 mins.
- Measure An.
- Inhibitor Treatment:
- Add 200 µM Acetazolamide (AZA) to the Low CO₂/High HCO₃⁻ media.
- Equilibrate for 20 mins.
- Measure An.
- Analysis:
- Compare An rates. Maintenance of >70% of control An in Step 3 indicates strong HCO₃⁻ use.
- Significant reduction of An in Step 4 confirms the role of external carbonic anhydrase or HCO₃⁻ transporters sensitive to AZA.
Visualization of Conceptual Pathways and Workflows
Diagram Title: Logic Flow for Photosynthetic Gas Exchange
Diagram Title: Conceptual Model of a Marine Macroalgal CCM
The Scientist's Toolkit: Research Reagent Solutions
Table 3: Essential Reagents and Materials for Macroalgal Gas Exchange Studies
| Item | Function & Application | Example/Notes |
|---|---|---|
| Acetazolamide (AZA) | Membrane-permeable carbonic anhydrase inhibitor. Used to probe external CA-mediated HCO₃⁻ conversion to CO₂. | Prepare 100 mM stock in DMSO; final working conc. 100-500 µM. |
| Ethoxyzolamide (EZA) | Potent, membrane-permeable CA inhibitor. Inhibits both external and internal CA, used to assess total CA contribution. | 1 mM stock in DMSO; final working conc. 50-200 µM. |
| Diisothiocyanostilbene-disulfonate (DIDS) | Anion exchange inhibitor. Blocks direct HCO₃⁻ transport via certain anion channels/transporters. | Prepare fresh 10 mM stock in ASW or buffer; light-sensitive. |
| TRIS Buffer | pH buffer for artificial seawater. Used to maintain high pH (>8.5) in HCO₃⁻ utilization assays to suppress free CO₂. | Can affect membrane permeability; use appropriate controls. |
| CO₂-free Artificial Seawater | Base medium for constructing precise DIC solutions via NaHCO₃ addition. | Bubble vigorously with N₂ gas for >60 mins; use NaOH to maintain pH. |
| 18O-Labeled Bicarbonate (H13C18O18O2⁻) | Stable isotope tracer. Distinguishes direct HCO₃⁻ uptake vs. CO₂ uptake after CA-mediated conversion via mass spectrometry. | Expensive; requires specialized MIMS (Membrane Inlet Mass Spec) equipment. |
| Licor 6800 Aquatic Chamber | Commercial gas exchange system adapted for flat, submerged samples. Measures An, Ci (modeled), and fluorescence. | Essential for non-invasive, high-resolution CO₂ response (A/Ci) curves. |
| Hansatech DW3/AD Chamber | Submersible O₂ electrode system. Directly measures O₂ evolution/consumption rates in liquid medium. | Robust for inhibitor studies and O₂ inhibition measurements. |
This whitepaper delineates a technical framework for leveraging bioengineering principles derived from the study of C4 photosynthesis in marine macroalgae to enhance crop resilience and terrestrial carbon sequestration. Synthesizing cutting-edge research, we provide a roadmap for translating marine photosynthetic adaptations into biotechnological applications for climate change mitigation and food security.
The discovery of functional C4 photosynthesis in select marine macroalgae, such as Udotea flabellum and Thalassia testudinum, presents a paradigm shift. Unlike the canonical C4 pathway in terrestrial plants (e.g., maize), the marine C4 system operates within single cells, employing rapid biochemical cycling and subcellular compartmentalization. This thesis posits that the mechanistic insights from these efficient, compact carbon-concentrating mechanisms (CCMs) provide a unique blueprint for engineering enhanced photosynthetic efficiency and abiotic stress tolerance in terrestrial crops, directly impacting resilience and biomass-driven carbon drawdown.
Core Bioengineering Lessons from Marine C4 Systems
Biochemical and Anatomical Adaptations
Marine C4 macroalgae have evolved a pyrenoid-based or chloroplastic partitioning system to concentrate CO₂ around RuBisCO, mitigating photorespiration under variable aqueous CO₂ and O₂ conditions. Key lessons include:
- Spatial Efficiency: Single-cell CCMs demonstrate that complex biochemical pathways can be optimized without Kranz anatomy.
- Enzyme Kinetics: The use of specific PEP carboxylase isoforms with high affinity for HCO₃⁻.
- Metabolite Shuttling: Rapid transport of C4 acids (malate, aspartate) within chloroplasts.
Table 1: Comparative Analysis of C4 Systems in Terrestrial Plants vs. Marine Macroalgae
| Feature | Terrestrial C4 Plants (e.g., Maize) | Marine C4 Macroalgae (e.g., Udotea) |
|---|---|---|
| Anatomy | Kranz anatomy: Mesophyll & Bundle Sheath cells | Single-cell, subcellular compartmentation |
| Primary Inorganic Carbon Source | Atmospheric CO₂ | HCO₃⁻ (Bicarbonate) |
| Initial CO₂ Fixing Enzyme | PEPC in mesophyll | PEPC (or PEPCK) in cytosol/chloroplast |
| C4 Acid Decarboxylase | NADP-ME, NAD-ME, or PCK in bundle sheath | Potential mitochondrial/chloroplastic ME |
| CO₂ Concentration Site | Bundle sheath chloroplast stroma | Pyrenoid or chloroplast micro-domain |
| Primary Advantage | Reduced photorespiration, water efficiency | Efficient HCO₃⁻ use in variable pH/low CO₂ |
Stress Resilience Mechanisms
Marine environments subject macroalgae to fluctuating light, salinity, and carbon availability. Their C4 components are often integrated with reactive oxygen species (ROS) scavenging pathways and osmotic regulation, providing a holistic stress-resistance module.
Translational Applications: Protocols for Crop Engineering
Protocol: Evaluating Candidate C4 Gene Constructs in Model Plants
Objective: Test functionality of marine algal C4 pathway genes (e.g., PEPC, ME) in a terrestrial C3 plant chassis (Arabidopsis thaliana, Nicotiana benthamiana).
Detailed Methodology:
- Gene Identification & Synthesis:
- Identify key enzyme coding sequences from marine macroalgae transcriptomic databases (e.g., MMETSP).
- Optimize codon usage for the target plant.
- Synthesize genes with appropriate plant regulatory elements (e.g., 35S promoter, RuBisCO small subunit promoter for chloroplastic targeting, peptide transit sequences).
- Vector Construction:
- Clone individual genes or synthetic operons into plant binary vectors (e.g., pCAMBIA1300).
- Include fluorescent tags (e.g., GFP, mCherry) for subcellular localization verification.
- Use Golden Gate or Gibson assembly for multigene constructs.
- Plant Transformation & Selection:
- Transform Arabidopsis via floral dip (Agrobacterium tumefaciens strain GV3101).
- Transform N. benthamiana via leaf disc agroinfiltration.
- Select transformants on hygromycin (25 mg/L) or kanamycin (50 mg/L) plates.
- Phenotypic & Biochemical Assay:
- Gas Exchange: Measure net CO₂ assimilation rate (A) and CO₂ compensation point (Γ) using an IRGA (InfraRed Gas Analyzer) system under varying light and CO₂.
- Enzymatic Activity: Extract leaf protein. Assay PEPC activity by monitoring NADH oxidation at 340 nm in reaction mix (50 mM HEPES-KOH pH 8.0, 10 mM MgCl₂, 10 mM NaHCO₃, 5 mM PEP, 2 mM NADH, 5 U/mL malate dehydrogenase).
- Metabolite Profiling: Quantify C4 acids (malate, aspartate) and sugars via LC-MS/MS in leaf extracts sampled at different diurnal timepoints.
- Resilience Testing: Subject T2/T3 generation plants to abiotic stress (drought, high light, salinity) and measure biomass, Fv/Fm (chlorophyll fluorescence), and survival rates versus wild-type.
Diagram 1: Marine C4 gene engineering workflow in plants.
Protocol: Enhancing Soil Carbon Sequestration via Root Exudate Engineering
Objective: Engineer crops to release stabilized C4 acids (derived from enhanced photosynthesis) into the rhizosphere to promote microbial formation of stable soil organic carbon (SOC).
Detailed Methodology:
- Root-Specific Expression:
- Fuse marine algal ME or PEPC genes to root-specific promoters (e.g., RCc3 from rice).
- Include secretion signal peptides for apoplastic release of malate.
- Hydroponic Validation:
- Grow engineered plants in hydroponic culture.
- Collect root exudates by immersing roots in sterile 0.5 mM CaCl₂ for 2h.
- Analyze exudates via HPLC for quantitative C4 acid profiling.
- Soil Microcosm Experiment:
- Plant engineered and control plants in defined soil columns (n=6).
- Pulse-label plants with ¹³CO₂ for 7 days.
- Destructively sample soil at depths (0-5cm, 5-15cm) after 30, 60, 90 days.
- Analyze ¹³C enrichment in SOC fractions (particulate organic matter, mineral-associated organic matter) using isotope-ratio mass spectrometry.
- Perform 16S/ITS rRNA sequencing on rhizosphere soil to characterize microbial community shifts.
Table 2: Key Research Reagent Solutions
| Reagent / Material | Function & Specification |
|---|---|
| pCAMBIA1300 Vector | Plant binary vector for Agrobacterium-mediated transformation; contains hygromycin resistance. |
| RuBisCO Small Subunit (RbcS) Transit Peptide | Chloroplast targeting sequence for accurate localization of engineered enzymes. |
| NADH (β-Nicotinamide adenine dinucleotide) | Cofactor for spectrophotometric enzymatic activity assays (e.g., PEPC linked assay). |
| ¹³C-Labeled CO₂ (99 atom % ¹³C) | Stable isotope for pulse-chase labeling to track photosynthetic carbon flux into soil. |
| IRGA System (e.g., LI-6800) | Measures real-time photosynthetic parameters (A, gs, Ci) under controlled environmental conditions. |
| Trichoderma harzianum Spores | Beneficial fungus used in co-culture to test enhanced symbiotic interaction via C4 exudates. |
Integrated Signaling & Carbon Flux Pathways
The engineered system involves interconnected metabolic and signaling networks.
Diagram 2: Integrated C4 signaling and carbon sequestration pathway.
The C4 photosynthetic machinery of marine macroalgae offers a compact, efficient, and stress-resilient blueprint for bioengineering. By extracting and translating these lessons into terrestrial crops via synthetic biology approaches detailed herein, we can develop dual-purpose cultivars with enhanced climate resilience and significant carbon sequestration potential, addressing critical challenges in food security and climate change mitigation.
Navigating Research Pitfalls: Disentangling C4 from Other Carbon Concentrating Mechanisms (CCMs)
The investigation of inorganic carbon concentrating mechanisms (CCMs) in photoautotrophs is pivotal for understanding productivity and resilience. Within the broader thesis on the potential for, and implications of, C4 photosynthesis in marine macroalgae, a central technical challenge arises: definitively distinguishing a fully realized C4 cycle from biophysical CCMs and from CAM (Crassulacean Acid Metabolism)-like temporal dynamics. This guide provides a methodological framework for this differentiation, critical for researchers in algal physiology, biogeochemistry, and for professionals exploring algal platforms for compound production.
Core Mechanistic Comparisons
The primary mechanisms for augmenting carbon concentration around RuBisCO are summarized below.
Table 1: Comparative Overview of Carbon Concentrating Mechanisms (CCMs)
| Feature | Biophysical CCM | C4 Photosynthesis | CAM |
|---|---|---|---|
| Core Strategy | Active transport of CO₂ and/or HCO₃⁻ across membranes. | Biochemical fixation of CO₂ into 4-C acids, followed by spatial decoupling of release and fixation. | Biochemical fixation of CO₂ into 4-C acids, followed by temporal decoupling of release and fixation. |
| Anatomical Requirement | Not required; operates at cellular level. | Requires Kranz anatomy or single-cell compartmentalization. | Not required; operates at cellular level. |
| Temporal Pattern | Concurrent with light. | Concurrent with light. | Fixation (night) and release (day) phases. |
| Primary Enzyme(s) | Carbonic anhydrase (CA), membrane transporters. | PEPC, PPDK, NAD(P)-ME or PEP-CK, RuBisCO. | PEPC (night), NAD(P)-ME (day), RuBisCO (day). |
| Initial Carbon Product | Elevated internal [CO₂] or [HCO₃⁻]. | Oxaloacetate (OAA) -> Malate/Aspartate (C4 acids). | OAA -> Malate (stored in vacuole). |
| Key Diagnostic | Direct measurement of internal inorganic carbon (Ci) pool size and flux. | Compartment-specific enzyme activity & metabolite flux; δ¹³C values typically -10‰ to -14‰. | Diurnal metabolite (malate) fluctuation; δ¹³C values often similar to C4. |
Experimental Protocols for Differentiation
Protocol: Enzymatic & Metabolite Compartmentalization Analysis
Objective: To localize C4-cycle enzymes (PEPC, PPDK, decarboxylase) and metabolites to specific cell types or organelles, distinguishing spatial C4 from biophysical CCMs. Methodology:
- Tissue Fixation & Sectioning: Fix algal thallus samples in 4% paraformaldehyde in PIPES buffer. Dehydrate, embed in resin (e.g., LR White), and cut semi-thin (1-2 µm) sections.
- Immunofluorescence Labeling:
- Treat sections with blocking buffer (1% BSA, 0.05% Tween-20).
- Incubate with primary antibodies (e.g., anti-PEPC, anti-PPDK, anti-RuBisCO) for 2 hours.
- Wash and incubate with fluorophore-conjugated secondary antibodies (e.g., Alexa Fluor 488, 568).
- Counterstain with DAPI for nuclei.
- Microscopy & Analysis: Image using a confocal laser scanning microscope. Co-localization analysis (e.g., Pearson's coefficient) quantifies spatial separation of C4 enzymes from RuBisCO.
- Subcellular Metabolite Profiling: Using non-aqueous density gradient centrifugation, separate chloroplasts from cytosol. Quantify metabolites (PEP, malate, aspartate, 3-PGA) in each fraction via LC-MS/MS.
Protocol: Pulse-Chase Isotope Tracing (¹⁴C or ¹³C)
Objective: To trace the kinetic flow of fixed carbon, identifying precursor-product relationships diagnostic of C4 biochemistry. Methodology:
- Pulse Phase: Illuminate algal samples in a sealed chamber. Introduce ¹⁴C-labeled NaHCO₃ or ¹³C-labeled NaHCO₃ for a short duration (5-60 seconds).
- Chase Phase: Rapidly transfer samples to a medium with excess unlabeled (¹²C) bicarbonate at specified time intervals (e.g., 5s, 15s, 30s, 60s, 5min).
- Quenching & Extraction: Rapidly freeze samples in liquid N₂. Homogenize and extract metabolites in acidic methanol/water.
- Analysis:
- (¹⁴C): Use radio-HPLC or 2D TLC autoradiography to identify labeled compounds. A rapid early label in malate/aspartate before 3-PGA is a C4 signature.
- (¹³C): Use GC-MS or LC-IRMS. Calculate ¹³C enrichment over time in key metabolites. Modeling of isotopic flux is required.
Protocol: Diurnal Metabolite Flux Analysis (For CAM Screening)
Objective: To measure diurnal changes in titratable acidity and malate pool size, diagnosing CAM-like dynamics. Methodology:
- Sampling: Collect algal tissue in triplicate at 4-hour intervals over a 24-48 hour period under controlled light/dark cycles.
- Titratable Acidity:
- Boil samples in distilled water for 10 min, homogenize, and centrifuge.
- Titrate the supernatant with 0.01N NaOH to pH 7.0. Acidity (µeq H⁺ g⁻¹ FW) = (NaOH vol * normality) / fresh weight.
- Malate Quantification: Use a commercial enzymatic assay kit (e.g., via malate dehydrogenase) or quantify via HPLC on the same extracts.
- Interpretation: A clear nocturnal increase in acidity/malate (>2-fold) followed by a daytime decrease indicates CAM-idling or full CAM.
Visualizing Diagnostic Pathways and Workflows
Title: Diagnostic Decision Workflow for CCM Differentiation
Title: Core Pathways of Biophysical CCM, C4, and CAM
The Scientist's Toolkit: Key Research Reagent Solutions
Table 2: Essential Reagents for Differentiating CCMs in Macroalgae
| Reagent / Material | Primary Function | Application in Differentiation |
|---|---|---|
| Anti-PEPC, Anti-PPDK Antibodies | High-specificity polyclonal/monoclonal antibodies for immuno-localization. | Visualizes spatial separation of C4 enzymes from RuBisCO (C4 diagnosis). |
| ¹³C- or ¹⁴C-Labeled Sodium Bicarbonate | Stable (¹³C) or radioactive (¹⁴C) isotopic tracer. | Core substrate for pulse-chase experiments to determine carbon fixation kinetics. |
| Carbonic Anhydrase Inhibitors (e.g., Acetazolamide) | Specific inhibition of CA activity. | Probing the role of external CA in biophysical CCMs; inhibition reduces Ci uptake if CA-critical. |
| PEPC Inhibitors (e.g., 3,3-Dichloro-2-dihydroxyphosphinoylmethyl-2-propenoate) | Specific inhibition of PEP carboxylase. | Testing biochemical CCM dependency. In C4/CAM, inhibits initial fixation. |
| LC-MS/MS & GC-MS Systems | High-sensitivity identification and quantification of metabolites and isotopic enrichment. | Diurnal metabolite profiling, subcellular fraction analysis, and ¹³C-flux analysis. |
| Non-aqueous Density Gradient Media (e.g., Percoll in non-aqueous solvents) | Separation of intact chloroplasts from cytosol without water. | Critical for compartment-specific metabolite measurements to prove spatial biochemistry. |
| Enzymatic Malate/Aspartate Assay Kits | Colorimetric/fluorometric quantification of specific C4 acids. | Rapid, high-throughput screening of diurnal fluctuations (CAM) or pool sizes. |
This technical guide is framed within a broader thesis investigating the induction and regulation of C4-like carbon concentrating mechanisms (CCMs) in marine macroalgae. The central hypothesis posits that specific environmental stressors can trigger biochemical and anatomical adaptations analogous to terrestrial C4 photosynthesis in select algal species, potentially enhancing productivity and secondary metabolite synthesis. To test this, precise manipulation of cultivation parameters is paramount to elicit clear, interpretable physiological and molecular signals. This whitepaper details optimized protocols for controlling light, carbon, and nutrients to deconvolute complex stress-response pathways and identify bona fide C4 biomarkers.
Core Condition Optimization
Light Regime Manipulation
Light is the primary energy source and a key signaling factor. Optimization seeks to balance photosynthetic saturation with stress induction.
Key Parameters:
- Photosynthetically Active Radiation (PAR): 80-200 µmol photons m⁻² s⁻¹ for most temperate macroalgae. Higher ranges (up to 400) may be used for short-term high-light stress.
- Photoperiod: 12:12 or 14:10 (Light:Dark) for baseline growth. Continuous light or altered cycles used for metabolic stress.
- Spectral Quality: Blue (450nm) and red (660nm) LEDs are critical for photomorphogenesis. Enhanced blue light can upregulate carbonic anhydrase and PEPC activity, key C4 enzymes.
Experimental Protocol: Light Stress Induction for Enzyme Activity Assay
- Acclimation: Cultivate algae under stable, growth-permissive light (100 µmol m⁻² s⁻¹, 12:12) for 7 days.
- Treatment: Divide biomass into three tanks.
- Control: Maintain acclimation conditions.
- High-Light Stress: Expose to 350 µmol m⁻² s⁻¹ for 48 hours.
- Spectral Shift: Expose to 150 µmol m⁻² s⁻¹ with a 70:30 Blue:Red ratio for 7 days.
- Sampling: Harvest thallus segments at mid-photoperiod, flash-freeze in liquid N₂, and store at -80°C for subsequent PEP carboxylase (PEPC) and RuBisCO activity assays.
Carbon Chemistry Modulation
Dissolved inorganic carbon (DIC) speciation and concentration are levers for probing CCM activity.
Key Parameters:
- pH: Controls the DIC equilibrium (CO₂ vs. HCO₃⁻). Constant pH is maintained using buffered media or pH-stat systems.
- DIC Concentration: Total available inorganic carbon.
- CO₂ vs. HCO₃⁻ Availability: Manipulated via pH or direct chemical addition (e.g., NaHCO₃).
Experimental Protocol: Carbon Limitation and Enzyme Localization
- Setup: Use pH-controlled chemostats or closed systems.
- Treatments:
- High-CO₂ / Low pH: Bubbling with 1% CO₂-enriched air (pH ~7.6).
- CO₂-Limitation / High pH: Bubbling with CO₂-stripped air (pH ~8.8, HCO₃⁻ as main DIC source).
- DIC Depletion: Very low DIC media with atmospheric air.
- Analysis: After 5-10 days, measure:
- Carbon Isotope Discrimination (δ¹³C): More negative values suggest greater RuBisCO leakage (less CCM activity); less negative values suggest efficient CCMs or C4-like biochemistry.
- Immunofluorescence Microscopy: Fix tissue to localize PEPC and RuBisCO spatially, searching for compartmentalization.
Nutrient Manipulation
Nitrogen (N) and Phosphorus (P) availability directly impact photosynthetic enzyme synthesis and energy budgets.
- Key Strategy: Create defined N:P stoichiometry imbalances to induce nutrient-specific stress signaling.
- Experimental Protocol: Nitrate Starvation and Transcriptomic Response
- Baseline: Grow algae in replete f/2 medium (440 µM NO₃⁻, 36 µM PO₄³⁻).
- Depletion: Transfer to nitrate-free (-N) and phosphate-free (-P) media.
- Time-Course Sampling: Harvest tissue at 0, 6, 12, 24, 48, and 72 hours post-transfer.
- Downstream Analysis: Perform RNA-seq to identify upregulated genes under -N vs. -P stress, focusing on PEPC, PPDK, and NADP-ME (key C4 cycle genes).
Table 1: Optimal Ranges for Core Cultivation Parameters in Macroalgal C4 Research
| Parameter | Baseline Growth Range | Stress Induction Range | Key Measurement Tools |
|---|---|---|---|
| Light Intensity (PAR) | 80-150 µmol m⁻² s⁻¹ | 300-500 µmol m⁻² s⁻¹ (acute) | Quantum PAR Sensor |
| Light Cycle (L:D) | 12:12 to 14:10 | 24:0 or 8:16 | Programmable LED Array |
| Temperature | Species-specific ±2°C of habitat | ±5°C of baseline | Submersible Probe |
| pH (seawater) | 8.0 - 8.2 | 7.5 (high CO₂) or 8.8 (low CO₂) | pH Stat / Glass Electrode |
| DIC (Total) | ~2.0 mM | 0.1 mM (low) to 5.0 mM (high) | TCO₂ Analyzer |
| Nitrate (NO₃⁻) | 100-440 µM | 0-10 µM (limitation) | Autoanalyzer / HPLC |
| Phosphate (PO₄³⁻) | 20-36 µM | 0-2 µM (limitation) | Autoanalyzer / Spectrophotometry |
Table 2: Expected Physiological Signals Under Optimized Stress Conditions
| Inducing Condition | Target C4-Like Signal | Analytical Method | Expected Result vs. Control |
|---|---|---|---|
| High Light / Blue Shift | ↑ PEPC Activity | Enzyme Activity Assay | 2-5 fold increase in specific activity |
| Low CO₂ / High pH | ↑ δ¹³C (less negative) | IRMS | Shift of 3-8‰ towards less negative values |
| Nitrate Limitation | ↑ PEPC Gene Expression | qRT-PCR / RNA-seq | 10-50 fold upregulation |
| Spatial Compartmentalization | Separation of PEPC & RuBisCO | Immunofluorescence | Distinct cell-layer staining patterns |
Visualization of Pathways and Workflows
The Scientist's Toolkit: Key Research Reagent Solutions
Table 3: Essential Reagents and Materials for C4 Macroalgal Research
| Item / Reagent | Function / Application in Protocol | Key Consideration |
|---|---|---|
| Artificial Seawater Salts (e.g., Tropic Marin Pro Reef) | Provides consistent ionic background free of organic carbon/nitrogen. | Use 32-35 ppt; chelate trace metals to avoid precipitation at high pH. |
| LED Grow Light System (Tunable Spectrum) | Precise control of PAR, photoperiod, and spectral quality for stress induction. | Must have calibrated output in µmol m⁻² s⁻¹ and adjustable blue:red ratios. |
| pH Stat System (e.g., METTLER TOLEDO) | Maintains constant pH by automated CO₂ bubbling or acid/base addition. | Critical for long-term carbon chemistry experiments; use sterile CO₂. |
| PEPC Activity Assay Kit (Plant, Sigma-MAK191) | Quantifies phosphoenolpyruvate carboxylase activity in tissue extracts. | Ensure assay pH (~8.0) and include protease inhibitors during extraction. |
| NaH¹³CO₃ (98+ atom % ¹³C) | Tracer for carbon fixation pathways via pulse-chase experiments. | Handle in fume hood; use in closed systems to track ¹³C into metabolites. |
| RNA Stabilization Reagent (e.g., RNAlater) | Preserves RNA integrity in tough algal tissue prior to homogenization. | Infiltrate into tissue under vacuum for effective preservation. |
| Anti-PEPC (Plant) Antibody, monoclonal | Immunodetection and localization of PEPC protein via Western blot or microscopy. | Check cross-reactivity with target algal species; may require validation. |
| PAM Fluorometer (e.g., Walz Imaging-PAM) | Measures photosynthetic efficiency (ΦPSII, NPQ) in real-time under stress. | Allows non-destructive monitoring of photophysiological responses. |
In the specialized field of C4 photosynthesis research in marine macroalgae, establishing robust, reproducible conclusions is paramount. The inherent biological complexity, coupled with environmental variability, demands a methodological framework that transcends single-experiment validation. Analytical cross-verification—the systematic use of multiple, independent lines of evidence to corroborate a single hypothesis—is non-negotiable for constructing a reliable knowledge base. This whitepaper details the technical rationale, methodologies, and practical toolkit essential for implementing this principle, specifically within the context of confirming C4 metabolic pathways in non-model marine algal species.
The Imperative for Cross-Verification in Marine Macroalgal C4 Research
The quest to identify and characterize C4 photosynthesis in marine macroalgae (e.g., Udotea, Halimeda, Penicillus) is fraught with interpretive challenges. Unlike terrestrial plants, these organisms exhibit biochemical and anatomical plasticity. A single line of evidence, such as the presence of a C4 pathway enzyme, is insufficient to confirm a fully operational, physiologically significant C4 cycle. Misidentification can arise from:
- Enzyme Multifunctionality: Enzymes like PEP carboxylase (PEPC) play roles in non-photosynthetic anaplerotic reactions.
- Spatial Compartmentalization Challenges: The traditional Kranz anatomy is often absent; subcellular compartmentalization via chloroplast positioning or cytoplasmic streaming must be proven.
- Environmental Modulation: Enzyme activity and carbon flux can shift dramatically with pH, light, and inorganic carbon availability.
Therefore, claims of C4 photosynthesis must be substantiated through convergent evidence from physiology, biochemistry, histochemistry, and genomics.
Core Lines of Evidence & Methodological Protocols
Confirmation requires integration across disciplinary boundaries. The following table summarizes the key investigative axes and their primary outputs.
Table 1: Essential Lines of Evidence for C4 Pathway Verification
| Evidence Axis | Primary Question | Key Quantitative Metrics | Critical Cross-Verification Function |
|---|---|---|---|
| Gas Exchange Physiology | Does the alga exhibit reduced photorespiration and enhanced CO₂ uptake efficiency? | CO₂ compensation point (Γ), O₂ inhibition of photosynthesis, stable carbon isotope ratio (δ¹³C) | Provides whole-organism functional evidence. A low Γ and δ¹³C values > -20‰ are indicative, but not conclusive, of C4 metabolism. |
| Enzyme Assay & Localization | Are C4 cycle enzymes present and active at sufficient levels? | Maximal activity of PEPC, PEP carboxykinase (PEPCK), NAD(P)-ME, PPDK (μmol mg⁻¹ Chl h⁻¹). | Biochemical evidence. High PEPC:Rubisco activity ratio (>1) is a hallmark. Must be paired with localization data. |
| Metabolite Tracking & Flux Analysis | Does ¹⁴C or ¹³C label rapidly incorporate into C4 acids prior to sugars? | % of ¹⁴C in malate/aspartate after <5 sec pulse, flux ratio through C4 vs. C3 pathway. | Provides dynamic, in vivo evidence of carbon flow, the definitive proof of a functional cycle. |
| Subcellular Localization | Are C4 acids decarboxylating enzymes spatially separated from initial carboxylation? | Immuno-gold particle density per μm² in chloroplast vs. cytoplasm via TEM. | Anatomical/ultrastructural evidence. Critical for demonstrating single-cell C4 metabolism (CCM). |
| Gene Expression & Proteomics | Are genes for C4-specific isoforms of enzymes upregulated under relevant conditions? | Transcripts per million (TPM) for PEPC1 vs. PEPC2, protein abundance fold-change. | Molecular genetic evidence supporting the biochemical data and indicating evolutionary adaptation. |
Detailed Experimental Protocols
1. Coupled Gas Exchange & Isotope Discrimination Protocol
- Objective: Simultaneously measure net CO₂ assimilation (A) and stable carbon isotope discrimination (Δ) under controlled [CO₂] and O₂.
- Method: Place thallus segment in a temperature-controlled cuvette of an IRGA system interfaced with a mass spectrometer. Maintain saturating PAR (≥ 500 μmol photons m⁻² s⁻¹) and seawater media. Measure A and Δ across a [CO₂] gradient (50 – 2000 μmol mol⁻¹). Calculate Γ and the Δ vs. A relationship.
- Cross-Verification Link: The measured Δ pattern (distinctly different from C3 or CAM) should align with predictions from enzyme-based models.
2. ¹⁴C-Pulse-Chase Metabolic Flux Analysis
- Objective: Trace the kinetics of carbon fixation into primary metabolites.
- Method: Incubate algal samples in filtered seawater with NaH¹⁴CO₃ (specific activity ~2 MBq μmol⁻¹) under growth light for precise pulses (3, 5, 10, 30, 60 sec). Chase with unlabeled medium for up to 300 sec. Immediately freeze in liquid N₂. Metabolites are extracted in hot ethanol:water:formic acid, separated via 2D TLC or HPLC, and quantified using a scintillation counter.
- Cross-Verification Link: A rapid label in C4 acids (malate, aspartate) within 3-5 sec, later transitioning to sugars, is direct evidence of C4 acid as a primary fixation product.
3. Immunofluorescence Localization of PEPC and Decarboxylases
- Objective: Visualize spatial separation of carboxylation and decarboxylation phases.
- Method: Fix algal tissue in 4% paraformaldehyde in PBS. Dehydrate, embed in resin (e.g., LR White). Section (1-2 μm). Incubate with primary antibodies (anti-PEPC, anti-NAD-ME) and species-specific fluorescent secondary antibodies (e.g., Alexa Fluor 488, 594). Counterstain with DAPI for nuclei. Image with confocal laser scanning microscopy.
- Cross-Verification Link: Complementary patterns (e.g., PEPC cytoplasmic, decarboxylase chloroplastic) provide visual proof of compartmentalization required for a functional C4 cycle.
Logical Workflow for C4 Pathway Validation
The following diagram outlines the sequential, cross-verifying logic required to establish a conclusive claim of C4 photosynthesis in a marine macroalga.
Title: Logical Workflow for Validating C4 Photosynthesis
The Scientist's Toolkit: Key Research Reagent Solutions
Table 2: Essential Reagents for Marine Macroalgal C4 Research
| Reagent / Material | Vendor Examples (Illustrative) | Critical Function in Cross-Verification |
|---|---|---|
| Anti-PEPC (Phosphoenolpyruvate Carboxylase) Antibody, monoclonal | Agrisera, PhytoAB | Specific detection of PEPC protein for western blot and immuno-localization. Isoform-specific antibodies are crucial. |
| ³H- or ¹⁴C-labeled NaHCO₃ | American Radiolabeled Chemicals, PerkinElmer | Radioactive tracer for in vivo carbon flux experiments (pulse-chase). Enables quantification of metabolite labeling kinetics. |
| ¹³C-labeled NaHCO₃ (99% atom) | Sigma-Aldrich, Cambridge Isotope Labs | Stable isotope tracer for GC-MS or LC-MS based metabolomic flux analysis, providing more detailed flux network maps. |
| PEP (Phosphoenolpyruvate), NADH, NADPH | Roche, Sigma-Aldrich | Essential substrates and cofactors for in vitro enzyme activity assays (e.g., for PEPC, MDH, NAD(P)-ME). |
| LR White Resin (Medium Grade) | Electron Microscopy Sciences, Agar Scientific | Hydrophilic acrylic resin for immunoelectron microscopy, allowing for fine ultrastructural localization of enzymes. |
| RNAlater Stabilization Solution | Thermo Fisher Scientific, Qiagen | Preserves RNA/DNA and protein integrity in field-collected algal samples for subsequent multi-omics analysis. |
| FastPrep-24 Homogenizer & Lysing Matrix D | MP Biomedicals | Efficient mechanical disruption of tough macroalgal cell walls for simultaneous extraction of metabolites, proteins, and RNA. |
In the pursuit of understanding C4 photosynthesis in marine macroalgae, the reliance on a singular methodological approach is a profound liability. The convergent application of physiological, biochemical, spatial, and molecular analyses creates an evidential network where the strengths of one method compensate for the inherent limitations of another. This whitepaper has detailed the protocols and logical framework necessary to execute this strategy. For researchers and drug development professionals exploring these organisms for novel bioactive compounds or bioengineering insights, the rigorous, cross-verified characterization of their foundational physiology is not merely best practice—it is the non-negotiable bedrock of credible science.
Common Methodological Artifacts and How to Avoid Them in Isotope and Enzyme Studies
Framed within a broader thesis on C4 photosynthesis in marine macroalgae research.
This technical guide addresses pervasive methodological artifacts encountered in stable isotope and enzyme activity studies, crucial for elucidating carbon concentrating mechanisms (CCMs) like C4 photosynthesis in marine macroalgae. Accurate measurement of δ¹³C values, phosphoenolpyruvate carboxylase (PEPC) and RuBisCO activities, and carbon flux are foundational to this field. Artifacts can lead to false positives for C4 metabolism, misallocation of carbon pathways, and erroneous kinetic data. This document provides a framework for identification and mitigation.
Section 1: Isotope Studies – Artifacts and Mitigation
Common Artifacts in Sample Preparation and Analysis
| Artifact | Cause | Consequence in Macroalgae Studies | Mitigation Protocol |
|---|---|---|---|
| Incomplete Drying | Residual water during acidification for carbonate removal. | Erroneous δ¹³C due to dissolution of labile organic compounds or incomplete reaction. | Lyophilize samples to constant weight. Use desiccated acid fumes (HCl, H₃PO₄) in a closed vessel (e.g., Acid Bath) for >72h. |
| Lipid Contamination | High lipid content in some macroalgal species (e.g., Ulva). | Lipids are ¹³C-depleted, skewing bulk δ¹³C values toward more negative values. | Extract lipids pre-analysis via Soxhlet (chloroform:methanol, 2:1 v/v). Report δ¹³C values for lipid-extracted and bulk material separately. |
| Isotopic Heterogeneity | Sub-sampling from different thallus regions (meristematic vs. apical). | Misrepresentation of whole-organism carbon signature, critical for C4 pathway inference. | Homogenize entire sample using cryogenic mill with liquid N₂. Composite sample from multiple individuals. |
| Memory Effect in IRMS | Carryover from previous sample in the combustion tube or GC column. | Smearing of δ¹³C values between consecutive samples. | Run multiple standards (e.g., USGS40, USGS41) of known δ¹³C. Use adequate sample weight to maximize signal-to-background. Implement robust linearity corrections. |
| Physiological State Artifact | Measuring isotope composition without controlling for growth irradiance, [CO₂(aq)], and nutrient status. | Misinterpretation of intrinsic carbon isotope discrimination (Δ). | Culture algae under controlled conditions for >10 generations. Measure δ¹³C of source DIC simultaneously. |
Protocol: Controlled-Culture Isotope Incubation for Macroalgae
Objective: To obtain accurate Δ values for inferring CCM activity.
- Pre-culture: Maintain macroalgal specimen in sterile, aerated seawater medium (e.g., Provasoli’s Enriched Seawater) under defined PAR (150 µmol photons m⁻² s⁻¹), temperature, and 12:12 L:D cycle for 10 days.
- Inoculation: Transfer a known biomass (e.g., 0.5 g FW) to a sealed, temperature-controlled photobioreactor containing medium with known DIC concentration and δ¹³Cₜᵢc.
- Incubation: Bubble with air of known δ¹³Cₜᵢc at a constant rate. Incubate under experimental PAR for 6 hours.
- Harvest: Rapidly rinse sample in 0.01 M HCl (to remove surface adsorbed DIC), then in DI water. Flash freeze in liquid N₂.
- Analysis: Lyophilize, homogenize, and analyze via EA-IRMS alongside certified standards bracketing every 5 samples.
Section 2: Enzyme Studies – Artifacts and Mitigation
Artifacts in Enzyme Extraction and Assay
| Artifact | Cause | Consequence | Mitigation Protocol |
|---|---|---|---|
| Proteolytic Degradation | Endogenous protease activity during extraction. | Underestimation of enzyme activity (esp. PEPC). | Include protease inhibitors (e.g., 1 mM PMSF, 5 mM ε-aminocaproic acid) in ice-cold extraction buffer. Work at 4°C. |
| Inefficient Extraction | Poor cell wall disruption in tough macroalgal tissue. | Low and variable activity yields. | Use a pre-chilled mortar/pestle with abrasive (polyvinylpolypyrrolidone) and liquid N₂. Consider bead-beating for filamentous species. |
| Substrate Limitation/Contamination | Endogenous pools of metabolites (PEP, OAA, RuBP) in crude extract. | Non-linear initial rates, inaccurate Vmax/Km. | Desalt extracts immediately using spin columns (e.g., Sephadex G-25). Run no-enzyme and no-substrate controls. |
| Cofactor Instability | Oxidation of NADH/NADPH in assay buffer. | Decreasing reaction rate not due to substrate depletion. | Prepare NAD(P)H fresh daily. Include an NADH oxidation control (all components minus substrate). |
| pH Artifact | Use of suboptimal or non-physiological assay pH. | Misleadingly low activity; incorrect inference of enzyme isoform. | Determine pH optimum for macroalgal enzyme. Use physiological pH (cytosol: ~7.4, chloroplast: ~8.0) for in vivo relevance. |
| Coupling Enzyme Failure | Low activity or latency in auxiliary enzymes (e.g., MDH, LDH). | Rate-limiting step is not the target enzyme. | Use high, validated units of coupling enzymes. Verify coupling system separately. |
Protocol: Desalted Crude Extract Preparation for PEPC/RuBisCO Assay
Objective: To obtain a representative, contaminant-free protein extract for kinetic assays.
- Grinding: Combine 1 g FW frozen tissue with 4 mL ice-cold extraction buffer (100 mM HEPES-KOH pH 7.8, 10 mM MgCl₂, 5 mM DTT, 1% (w/v) PVP-40, 0.1% (v/v) Triton X-100, protease inhibitors). Grind under liquid N₂ to fine powder.
- Thawing & Clarification: Allow slurry to thaw on ice. Centrifuge at 16,000 x g for 15 min at 4°C. Retain supernatant.
- Desalting: Load supernatant onto a 5 mL Sephadex G-25 column pre-equilibrated with desalting buffer (50 mM HEPES-KOH pH 7.8, 5 mM MgCl₂, 2 mM DTT). Elute via centrifugation at 1,000 x g for 2 min.
- Immediate Use: Use desalted extract immediately for spectrophotometric assays. Determine protein concentration via Bradford assay.
Diagrams
The Scientist's Toolkit: Research Reagent Solutions
| Item | Function in Isotope/Enzyme Studies (Marine Macroalgae Context) |
|---|---|
| Polyvinylpolypyrrolidone (PVP-40) | Binds polyphenols and tannins during tissue homogenization, preventing enzyme inhibition and protein complexation. |
| Dithiothreitol (DTT) | A reducing agent that maintains enzyme sulfhydryl groups in a reduced state, preserving activity (critical for RuBisCO). |
| Protease Inhibitor Cocktail (e.g., PMSF) | Serine protease inhibitor that halts endogenous proteolytic degradation of target enzymes like PEPC during extraction. |
| Sephadex G-25 (PD-10) Desalting Columns | Rapidly removes low-MW contaminants (salts, endogenous substrates, inhibitors) from crude protein extracts for clean kinetic assays. |
| Certified Isotope Standards (USGS40, USGS41) | Calibrates the IRMS, corrects for scale drift, and validates the accuracy and precision of δ¹³C measurements. |
| Lithium Corr Carbonate Removal System | A standardized acid fumigation system for the safe, complete removal of inorganic carbon without hydrolyzing organic compounds. |
| NADPH/NADH (Tetrasodium Salts) | Cofactors for spectrophotometric enzyme assays (e.g., PEPC coupled with MDH). Must be fresh to avoid oxidation artifacts. |
| Phosphoenolpyruvate (PEP) | The primary substrate for PEPC assays. Use highly pure, lithium or cyclohexylammonium salt to avoid cation interference. |
Standardizing Protocols for Reproducible Research Across Diverse Algal Species
The investigation of C4 and C4-like carbon concentrating mechanisms (CCMs) in marine macroalgae represents a frontier in phycology and marine botany, with profound implications for understanding carbon sequestration, primary productivity, and bioresource development. Research in this domain, however, is hampered by extreme methodological heterogeneity. Studies on diverse algal species—from Ulva to Sargassum—employ disparate growth conditions, measurement techniques, and data reporting standards, rendering cross-species comparisons and meta-analyses unreliable. This technical guide advocates for and details a suite of standardized protocols to ensure reproducible, comparable, and robust research on algal physiology, with a specific focus on elucidating C4 pathways.
Core Standardized Protocols for Algal Research
Cultivation and Acclimation Standard (CAS-2024)
Rationale: Inconsistent pre-experimental culture conditions are a primary source of irreproducibility, significantly impacting the expression of CCM-related enzymes like phosphoenolpyruvate carboxylase (PEPC).
Detailed Protocol:
- Inoculum: Start from axenic cultures or thoroughly document the associated microbiome. Use a standardized initial biomass (e.g., 0.2 g FW L⁻¹).
- Medium: Use a defined artificial seawater medium (e.g., Provasoli’s Enriched Seawater, PES). Document full ionic composition, pH (8.1 ± 0.1), and total alkalinity.
- Growth Conditions:
- Light: 100 ± 5 μmol photons m⁻² s⁻¹ (PAR), 12:12h light:dark cycle. Use calibrated PAR sensors.
- Temperature: 20 ± 0.5°C for temperate species; 28 ± 0.5°C for tropical species.
- Aeration/Circulation: Constant, filtered air (0.2 μm) at 0.1 L min⁻¹ L⁻¹ culture.
- Carbonate System: Maintain total dissolved inorganic carbon (DIC) at 2000 ± 50 μmol kg⁻¹. pCO₂ levels should be manipulated and verified via direct measurement (see Table 1).
- Acclimation Period: A minimum of 14 days under experimental conditions prior to any assay. Three full culture volumes should be replaced during this period.
Carbonate Chemistry Verification Protocol (CCVP)
Rationale: Precise manipulation and verification of the CO₂ system is non-negotiable for C4 pathway research. Calculations alone are insufficient.
Detailed Protocol:
- Sample Collection: Collect culture medium samples anaerobically in glass vials, preserve with 10 μL of saturated HgCl₂.
- Measurement Triad: Directly measure two of the following four parameters:
- pH: Using a spectrophotometric method with m-cresol purple dye (accuracy ±0.005).
- Total Alkalinity (A_T): By open-cell Gran titration with 0.01M HCl (precision ±2 μmol kg⁻¹).
- Dissolved Inorganic Carbon (DIC): By acidification and coulometric detection.
- pCO₂: By equilibrator headspace analysis with a calibrated NDIR sensor.
- Calculation: Use the CO2SYS or PyCO2SYS software with appropriate constants (e.g., Mehrbach et al., refit by Dickson and Millero) to compute all other carbonate parameters from the two measured ones.
Enzyme Activity Assay for C4-Related Enzymes (EAA-C4)
Rationale: Standardized extraction and assay buffers are critical for comparing activities of PEPC, RuBisCO, pyruvate orthophosphate dikinase (PPDK), and malic enzyme across species.
Detailed Protocol for PEPC (Extractable Activity):
- Rapid Harvest: Vacuum-filter biomass (1.0 g FW) and immediately plunge into liquid N₂.
- Homogenization: Grind under liquid N₂ to a fine powder. Transfer to 4 mL of ice-cold extraction buffer: 100 mM HEPES-KOH (pH 8.0), 5 mM MgCl₂, 1 mM EDTA, 10% (v/v) glycerol, 0.1% (v/v) Triton X-100, 10 mM DTT, 2% (w/v) insoluble PVP, and 1 mM PMSF.
- Clarification: Centrifuge at 16,000 x g for 15 min at 4°C. Desalt supernatant immediately using a PD-10 column equilibrated in desalting buffer (extraction buffer without PVP, PMSF, and Triton).
- Spectrophotometric Assay: Monitor NADH oxidation at 340 nm (ε = 6220 M⁻¹ cm⁻¹). Reaction mixture: 50 mM HEPES-KOH (pH 8.0), 5 mM MgCl₂, 10 mM NaHCO₃, 0.2 mM NADH, 5 U mL⁻¹ malate dehydrogenase, 2.5 mM phosphoenolpyruvate (PEP). Start reaction with 50 μL of desalted extract. Run controls without PEP. Activity is expressed as μmol NADH oxidized min⁻¹ mg⁻¹ protein.
Quantitative Data Synthesis
Table 1: Recommended Standardized Conditions for Key Algal Groups in CCM Research
| Algal Group (Example Genus) | Standard Temp. (°C) | Standard Light (μmol m⁻² s⁻¹) | Standard pCO₂ Levels for Experiments (μatm) | Target DIC (μmol kg⁻¹) | Recommended Medium |
|---|---|---|---|---|---|
| Green Macroalgae (Ulva, Codium) | 20 ± 0.5 | 100 ± 5 | 200, 400, 800, 1500 | 2000 ± 50 | PES, ASP-12F |
| Brown Macroalgae (Sargassum, Ectocarpus) | 18 ± 0.5 (Temp) / 28 ± 0.5 (Trop) | 80 ± 5 | 200, 400, 800, 1200 | 2100 ± 50 | PES, f/2 + Si |
| Red Macroalgae (Gracilaria, Pyropia) | 15 ± 0.5 | 60 ± 5 | 150, 400, 1000, 2000 | 2200 ± 50 | PES |
| Diatoms (Phaeodactylum) | 20 ± 0.5 | 150 ± 5 | 150, 400, 800 | 2000 ± 50 | f/2 |
Table 2: Key Enzymatic Targets and Typical Activity Ranges in Algal C4/CCM Research
| Enzyme (EC Number) | Primary Function in C4/CCM Context | Typical Assay pH | Reported Activity Range in Algae (μmol min⁻¹ mg⁻¹ protein)* | Critical Cofactors/Substrates |
|---|---|---|---|---|
| Phosphoenolpyruvate Carboxylase (PEPC) (4.1.1.31) | Primary CO₂ fixation into oxaloacetate | 8.0 | 0.05 - 2.1 (Macroalgae) | Mg²⁺, PEP, HCO₃⁻ |
| RuBisCO (4.1.1.39) | Primary (Calvin) or secondary CO₂ fixation | 8.0-8.2 | 0.1 - 3.5 | Mg²⁺, RuBP, CO₂/O₂ |
| Pyruvate Phosphate Dikinase (PPDK) (2.7.9.1) | Regenerates PEP from pyruvate | 8.3 | 0.01 - 0.8 (in select species) | Mg²⁺, ATP, Pi, pyruvate |
| NAD(P)-Malic Enzyme (1.1.1.38/39) | Decarboxylation of malate to pyruvate & CO₂ | 7.5 (NAD), 8.0 (NADP) | 0.02 - 1.5 | Mn²⁺ or Mg²⁺, malate |
*Note: Ranges are illustrative from literature; standardization will reduce variability.
Visualizing Core Concepts and Workflows
Diagram Title: Biochemical Flux in an Algal C4-like Pathway
Diagram Title: Standardized Experimental Workflow for Algal CCM Research
The Scientist's Toolkit: Essential Research Reagent Solutions
Table 3: Key Research Reagents for Standardized Algal C4/CCM Studies
| Reagent / Material | Function & Rationale | Key Specifications / Notes |
|---|---|---|
| Provastoli’s Enriched Seawater (PES) | Defined culture medium for macroalgae. Eliminates variability from undefined natural seawater. | Must be prepared with analytical grade salts and ultrapure water (≥18.2 MΩ·cm). Trace metal mix should be chelated (e.g., with EDTA). |
| m-Cresol Purple (Purified) | Spectrophotometric pH indicator for precise seawater pH measurement (CCVP). | Dye must be purified for marine use (absence of sulfonephthalein impurities). λ₁ = 434 nm, λ₂ = 578 nm. |
| Certified Reference Material (CRM) for Seawater Alkalinity/DIC | Calibrates titrators and instruments for CCVP, ensuring data accuracy and inter-lab comparability. | From accredited bodies (e.g., A. Dickson Lab, Scripps). Batch number must be documented. |
| Phosphoenolpyruvate (PEP) Trisodium Salt | Key substrate for PEPC activity assays (EAA-C4). Purity is critical for kinetic measurements. | ≥99% purity (HPLC). Store desiccated at -20°C. Prepare fresh solutions in ice-cold buffer, pH adjusted. |
| Malate Dehydrogenase (MDH) from Porcine Heart | Coupling enzyme for PEPC assay, converts OAA to malate while oxidizing NADH. | High specific activity (>1000 U mg⁻¹). Use glycerol-free stock for minimal interference in UV assay. |
| Insoluble Polyvinylpolypyrrolidone (PVPP) | Additive in extraction buffer to bind phenolics and tannins common in brown/red algae, protecting enzyme integrity. | Pre-wash with extraction buffer before use. Use at 2-5% (w/v) of fresh weight. |
| DNase I & RNase A (Molecular Grade) | For RNA/DNA-free protein extraction prior to enzymatic assays or proteomics, preventing viscosity and assay interference. | Use during homogenization if subsequent analysis is purely enzymatic/proteomic. |
Validating the Model: How Algal C4 Stacks Up Against Terrestrial Plants and Other Marine Strategies
This whitepaper examines the comparative biochemistry of carbon concentrating mechanisms (CCMs), with a focus on efficiency and energetic cost, framed within emerging research on C4-like pathways in marine macroalgae. The discovery of biochemical CCMs, including C4 metabolism, in select macroalgae (e.g., Udotea flabellum, Thalassia testudinum) challenges the long-held paradigm of C4 photosynthesis as an exclusively terrestrial adaptation. This analysis compares the core biochemical machinery, energetic demands, and ecological trade-offs between terrestrial C3/C4 plants and marine macroalgal CCMs, providing a foundational context for ongoing thesis research into the evolution and engineering of photosynthetic systems.
Core Biochemical Pathways & Energetics
Terrestrial C3 Photosynthesis
The Calvin-Benson cycle (C3) fixes CO2 via Rubisco into 3-phosphoglycerate (3-PGA). Photorespiration, initiated by Rubisco's oxygenase activity under low CO2:O2 ratios, results in significant carbon and energy loss, reducing net efficiency in warm, arid, or high-light environments.
Terrestrial C4 Photosynthesis
C4 plants spatially separate initial CO2 fixation by PEP carboxylase in mesophyll cells from the Calvin cycle in bundle-sheath cells. This biochemical pump concentrates CO2 at the site of Rubisco, suppressing photorespiration. Subtypes (NADP-ME, NAD-ME, PEP-CK) differ in decarboxylation enzymes and metabolite shuttles.
Marine Macroalgal Carbon Concentrating Mechanisms (CCMs)
Macroalgae employ diverse CCMs, including:
- Biophysical CCMs: Active transport of inorganic carbon (CO2, HCO3-) across membranes.
- Biochemical CCMs (C4-like): Use of PEPCK or PEPC for initial carbon fixation, potentially followed by decarboxylation and refixation via Rubisco, though often lacking strict Kranz-type spatial compartmentalization. Pathways can be temporally separated or occur within single cells.
Quantitative Comparison: Efficiency & Cost
Table 1: Comparative Biochemical Energetics of Carbon Fixation Pathways
| Parameter | Terrestrial C3 Plant | Terrestrial C4 Plant | Marine Macroalga (C4-like) | Notes / Measurement Conditions |
|---|---|---|---|---|
| Theoretical ATP cost per fixed CO2 | 3 ATP, 2 NADPH | ~5 ATP, 2 NADPH | Variable; estimated 4.5 - 6+ ATP, 2 NADPH | C4 cost includes overhead for pump. Macroalgal cost depends on CCM type & leakage. |
| Quantum Yield (mol CO2 / mol photons) | ~0.08-0.09 (high CO2, low O2) | ~0.05-0.06 (ambient cond.) | 0.04 - 0.07 (highly variable) | Max photochemical efficiency; C4 yield lower due to ATP cost, but often outperforms C3 in vivo due to photoresp. suppression. |
| Carboxylation Efficiency (Vmax of PEPC vs Rubisco) | Rubisco only: 10-100 µmol mg⁻¹ prot min⁻¹ | PEPC: 200-600 µmol mg⁻¹ prot min⁻¹ | PEPC/PEPCK: 50-200 µmol mg⁻¹ prot min⁻¹ | PEPC kinetics (higher Km for HCO3-/CO2) favor diffusion-limited environments. |
| CO2 Compensation Point (Γ, ppm or µM) | ~40-100 ppm | ~2-10 ppm | <10 µM external CO2 (equiv. to <~1 ppm) | Reflects photorespiration; macroalgae achieve very low external [CO2] via active uptake. |
| Water Use Efficiency (WUE) | Low | Very High | Not Applicable (submerged) | A key terrestrial driver; replaced by Inorganic Carbon Use Efficiency in algae. |
| Typical Growth Rate (relative) | Baseline | ~1.3x - 2x C3 (in optimal hot/dry) | Highly species-dependent; CCM species often dominate in low-CO2, high-pH habitats. | Macroalgal growth influenced by light, nutrients, tidal exposure, not just CCM. |
Table 2: Key Enzyme Expression & Localization Comparison
| Enzyme | Terrestrial C3 Plant | Terrestrial C4 Plant (NADP-ME subtype) | Marine Macroalga (e.g., Udotea) |
|---|---|---|---|
| Rubisco | Mesophyll chloroplasts (all cells) | Bundle-sheath chloroplasts (agranal) | Chloroplasts; may show spatial or subcellular patterning. |
| PEP Carboxylase (PEPC) | Low activity (anaplerotic) | High activity, Mesophyll cytosol | Moderate to high activity; cytosolic. |
| NADP-Malic Enzyme (NADP-ME) | Chloroplast, low level | High activity, Bundle-sheath chloroplasts | Activity detected; localization under investigation. |
| PEP Carboxykinase (PEPCK) | Low activity | Alternative decarboxylase (PEP-CK subtype) | Often high activity; proposed decarboxylase in some species. |
| Carbon Anhydrase (CA) | Moderate (various) | Essential for hydration/dehydration | Very High activity (external & internal); critical for HCO3- use. |
Experimental Protocols for Comparative Analysis
Protocol: Measuring Quantum Yield of Photosystem II (ΦPSII) as a Proxy for Efficiency
Objective: Compare photochemical efficiency under varying CO2 conditions.
- Material: Dual-PAM-100 or similar fluorometer, CO2-controlled cuvette, C3 plant leaf disc, C4 plant leaf disc, macroalgal thallus segment.
- Method:
- Acclimate samples to low light for 30 min.
- Mount sample in cuvette. Set actinic light to growth light intensity.
- Flush cuvette with N2:O2 (80:20) to induce low CO2 (photorespiratory) conditions.
- Measure steady-state ΦPSII = (Fm' - Fs)/Fm'.
- Repeat measurement flushing with ~400 ppm CO2 in air (terrestrial) or air-equilibrated seawater (macroalgae).
- For macroalgae, repeat with seawater buffered to high pH (>9) to deplete CO2, or add AZA (acetazolamide, membrane-permeable CA inhibitor).
- Analysis: Plot ΦPSII vs. condition. Larger drop in ΦPSII in C3 vs. C4/macroalga under low CO2 indicates higher photorespiratory cost.
Protocol: Enzyme Activity Assay (PEPC & Rubisco)
Objective: Quantify and localize key carboxylase activities.
- Extraction: Homogenize fresh tissue in extraction buffer (100 mM Tris-HCl pH 8.0, 10 mM MgCl2, 1 mM EDTA, 10% glycerol, 5 mM DTT, 1% PVP). Centrifuge at 15,000g for 15 min at 4°C.
- PEPC Activity (Spectrophotometric):
- Reaction mix: 50 mM HEPES-KOH pH 8.0, 10 mM MgCl2, 10 mM NaHCO3, 2 mM PEP, 0.2 mM NADH, 5 U malate dehydrogenase.
- Start reaction with extract, monitor NADH oxidation at 340 nm for 2 min.
- Rubisco Activity (Initial & Total):
- Initial Activity: Add extract to mix (100 mM Bicine pH 8.2, 20 mM MgCl2, 10 mM NaHCO3, 0.5 mM RuBP, 4 mM ATP, 2 mM PEP, 5 U PK/LDH, 0.2 mM NADH). Monitor at 340 nm.
- Total Activity: Pre-incubate extract with 20 mM NaHCO3 and 20 mM MgCl2 for 10 min to carbamylate, then assay as above.
- Localization: For macroalgae, use immunolocalization with species-specific or cross-reactive antibodies (e.g., anti-PEPC, anti-Rubisco LSU) coupled with confocal microscopy.
Protocol: Isotopic (δ13C) Discrimination Analysis
Objective: Assess contribution of C4-like vs. C3 fixation.
- Sample Prep: Dry tissue, grind to fine powder.
- Analysis: Use Isotope Ratio Mass Spectrometry (IRMS).
- Interpretation: C3 plants: δ13C ≈ -22 to -35‰. C4 plants: δ13C ≈ -10 to -14‰. Macroalgae with active HCO3- uptake or C4-like metabolism: δ13C often -8 to -20‰ (less negative).
Diagrams
Comparative Carbon Fixation Pathways
Experimental Workflow for Pathway Analysis
The Scientist's Toolkit: Key Research Reagents & Materials
Table 3: Essential Reagents for Comparative C3/C4/Macroalgal Biochemistry
| Reagent / Material | Function & Application | Key Consideration for Macroalgae |
|---|---|---|
| PEP (Phosphoenolpyruvate) | Substrate for PEPC/PEPCK activity assays. | Use Na+ or K+ salt; ensure purity for kinetic studies. |
| RuBP (Ribulose-1,5-bisphosphate) | Substrate for Rubisco activity assays (initial/total). | Highly unstable; prepare fresh aliquots in acidic stock. |
| Acetazolamide (AZA) | Membrane-permeable carbonic anhydrase inhibitor. | Used to probe role of internal CA in macroalgal CCMs. |
| DIDS (4,4'-Diisothiocyano-2,2'-stilbenedisulfonate) | Inhibitor of anion exchangers (e.g., HCO3- transporters). | Tests active HCO3- uptake in macroalgae (external application). |
| NADH / NADPH | Cofactors for enzymatic coupled assays (PEPC, MDH, etc.). | Distinguish between NAD-ME and NADP-ME decarboxylation types. |
| Cross-reactive Antibodies (e.g., anti-PEPC, anti-Rubisco LSU) | Immunolocalization of key enzymes in novel species. | Requires validation via Western blot for target macroalga. |
| 13C-Labelled Bicarbonate (NaH13CO3) | Pulse-chase experiments to track carbon flow. | Use in closed systems for macroalgae; monitor pH shifts. |
| LI-6800 Portable Photosynthesis System (with aquatic chamber) | Simultaneous gas exchange & chlorophyll fluorescence. | Requires specialized macroalgal chambers; correct for boundary layer. |
| Seawater pH/CO2 Control System (e.g., CO2 bubbling, pH stat) | Manipulate inorganic carbon chemistry for ecophysiological assays. | Critical for mimicking natural fluctuations or future ocean conditions. |
Within the broader research on C4 photosynthesis in marine macroalgae, a critical question arises: how do different carbon-concentrating mechanisms (CCMs) compare in efficiency and evolutionary adaptation? This whitepaper provides a technical contrast between the spatial "pump" of algal C4 systems and the predominantly biochemical "pumps" employed by diatoms (e.g., biophysical CCMs) and cyanobacteria (e.g., carboxysome-based systems). Understanding these fundamental differences is crucial for advancing marine primary productivity models and for biotechnological applications in drug development (e.g., targeting carbon metabolism in harmful algal blooms).
Spatial Pumping: C4 in Marine Macroalgae (e.g.,Udotea,Hydrolithon)
True C4 metabolism, involving the spatial separation of phosphoenolpyruvate (PEP) carboxylation (mesophyll analogs) and decarboxylation/Carbon fixation (bundle sheath analogs) is rare but documented in some advanced marine macroalgae. It represents a spatial pump where inorganic carbon (Ci) is fixed into a 4-carbon compound in one cell region and shuttled to another for release to Rubisco.
Biochemical Pumping: Diatom and Cyanobacterial CCMs
- Diatoms: Primarily utilize a biophysical CCM involving active transport of bicarbonate (HCO₃⁻) across the chloroplast membrane, followed by its likely dehydration to CO₂ near the site of Rubisco by carbonic anhydrase (CA) within the pyrenoid. This is a biochemical pump concentrating Ci intracellularly.
- Cyanobacteria: Employ a highly specialized biochemical pump. Bicarbonate is actively transported into the cell and diffuses into proteinaceous microcompartments called carboxysomes. Here, CA converts HCO₃⁻ to CO₂, which is fixed by Rubisco, minimizing photorespiration.
Quantitative Comparison of Key Parameters
Data synthesized from recent literature (2020-2024).
Table 1: Comparative Metrics of Marine Carbon Concentrating Mechanisms
| Parameter | Algal C4 (e.g., Hydrolithon) | Diatom Biophysical CCM | Cyanobacterial CCM |
|---|---|---|---|
| Primary Ci Substrate | CO₂ and HCO₃⁻ (via CA externally) | Predominantly HCO₃⁻ | Predominantly HCO₃⁻ |
| K₀.₅(CO₂) (µM) | ~10-30 (estimated) | 1-10 | 5-20 (for whole cell; <10 in carboxysome) |
| Max Photosynthetic Rate (µmol O₂ mg Chl⁻¹ h⁻¹) | 50-150 | 100-300 | 150-400 |
| Key Anatomical Structure | Subcellular compartmentalization | Pyrenoid (starch-coated) | Carboxysome (protein shell) |
| Energy Cost (ATP per CO₂ fixed) | ≥2 (theoretical minimum for C4) | ~1-2 (for Ci transport) | ~2-3 (for transport + carboxysome maintenance) |
| Dominant Decarboxylase | PEP carboxykinase (PEPCK), NADP-ME | Not applicable (direct supply) | Not applicable (direct supply) |
| Response to High O₂ | Highly resistant to photorespiration | Moderately resistant | Highly resistant (carboxysome barrier) |
Experimental Protocols for Key Analyses
Protocol: Measuring K₀.₅(CO₂) Using a Membrane Inlet Mass Spectrometer (MIMS)
Objective: Determine the affinity of the photosynthetic apparatus for CO₂. Reagents: Artificial seawater (ASW) medium, 20 mM HEPES buffer (pH 8.0), NaH¹³CO₃ (99% ¹³C). Procedure:
- Cultivate algal/diatom/cyanobacterial cells to mid-log phase. Harvest and resuspend in Ci-free ASW-HEPES.
- Place sample in a temperature-controlled, illuminated MIMS cuvette.
- Inject aliquots of NaH¹³CO₃ stock to achieve increasing Ci concentrations.
- Monitor the initial rate of ¹⁸O₂ evolution or ¹³C uptake as a function of external ¹³Ci concentration.
- Fit data to a Michaelis-Menten model to derive K₀.₅(CO₂).
Protocol: Immunolocalization of Key Enzymes (PEPC, Rubisco)
Objective: Visualize spatial separation in putative C4 algae or compartmentalization in CCMs. Reagents: Paraformaldehyde (4% in PBS), Triton X-100 (0.1%), blocking serum (e.g., goat serum), primary antibodies (anti-PEPC, anti-RbcL), fluorophore-conjugated secondary antibodies. Procedure:
- Fix algal thallus/cells in paraformaldehyde for 2h at 4°C. Wash with PBS.
- Permeabilize with Triton X-100 for 15 min.
- Block with 5% serum for 1h.
- Incubate with primary antibody overnight at 4°C. Wash.
- Incubate with secondary antibody for 2h in darkness. Wash.
- Mount and image using confocal laser scanning microscopy.
Protocol: Inhibitor Studies to Decipher CCM Pathways
Objective: Distinguish between C4 and direct HCO₃⁻ use. Reagents: Acetazolamide (AZA, membrane-permeable CA inhibitor), EZ inhibitor (specific for external CA), 3,3-dichloro-2-dihydroxyphosphinoylmethyl-2-propenoate (DCDP, PEPC inhibitor). Procedure:
- Measure photosynthetic O₂ evolution rate at limiting Ci (pH 8.0, 50 µM Ci) as a baseline.
- Pre-incubate cells with AZA (100 µM) or EZ (200 µM) for 10 min, then measure rate.
- In a separate experiment, pre-incubate with DCDP (500 µM) for 30 min and measure rate.
- A strong inhibition by DCDP suggests reliance on PEPC (C4-like), while inhibition by EZ/AZA suggests reliance on external/periplasmic CA for HCO₃⁻ conversion.
Diagrammatic Representations
Title: Spatial C4 Pumping in Marine Algae
Title: Biochemical Pumping in Diatoms and Cyanobacteria
The Scientist's Toolkit: Key Research Reagent Solutions
Table 2: Essential Reagents for Marine CCM/C4 Research
| Reagent / Material | Function / Application | Example Vendor/Catalog |
|---|---|---|
| NaH¹³CO₃ (98-99% ¹³C) | Tracer for photosynthetic carbon fixation and Ci uptake studies using MIMS or IRMS. | Sigma-Aldrich, 372382 |
| Acetazolamide (AZA) | Membrane-permeable carbonic anhydrase inhibitor; used to probe internal CA involvement. | Tocris, 0680 |
| EZ Inhibitor (Ethoxyzolamide) | Potent, broadly effective CA inhibitor; used to inhibit both external and internal CA. | Sigma-Aldrich, E9636 |
| DCDP | Specific inhibitor of phosphoenolpyruvate carboxylase (PEPC); diagnostic for C4 metabolism. | Cayman Chemical, 16240 |
| Anti-RbcL (Rubisco large subunit) Antibody | Immunodetection and localization of Rubisco in cells/tissues. | Agrisera, AS03 037 |
| Anti-PEPC Antibody | Immunodetection and localization of PEP carboxylase, key for identifying C4 biochemistry. | Agrisera, AS09 458 |
| SI Trace Metal Solution | For preparing artificial seawater media with defined trace metals, critical for phytoplankton culturing. | Custom or ATCC recipe |
| Membrane Inlet Mass Spectrometer (MIMS) | Instrument for precise, real-time measurement of dissolved gases (O₂, CO₂, N₂) and isotopic fluxes. | Hiden Analytical, HPR-40 |
| PAM Fluorometer (Pulse-Amplitude Modulated) | Measures chlorophyll fluorescence parameters (ΦPSII, NPQ) to assess photosynthetic efficiency under varying Ci. | Walz, DIVING-PAM |
Within the broader thesis investigating the convergent evolution and operation of C4-like carbon concentrating mechanisms (CCMs) in marine macroalgae, this whitepaper examines the potential growth advantage under projected future ocean conditions characterized by higher pH and lower dissolved CO₂. As anthropogenic CO₂ emissions drive ocean acidification, the concomitant decrease in surface water CO₂ concentration and increase in pH present a unique selective pressure. This analysis posits that macroalgal species with efficient CCMs, particularly those exhibiting biochemical traits analogous to C4 photosynthesis, may exhibit superior ecological performance and competitive dominance in such environments.
Marine macroalgae face the challenge of acquiring inorganic carbon (Ci) from seawater, where CO₂ is present at low concentrations (~10-30 µM) and diffusion is slow. Most species utilize biophysical or biochemical CCMs to actively concentrate CO₂ at the site of Rubisco. The thesis context proposes that certain macroalgae, including select brown (Phaeophyceae) and green (Ulvophyceae) species, have evolved C4-like biochemical pathways as part of a sophisticated CCM. Under future high pH / low CO₂ conditions, the energy cost of carbon acquisition is predicted to increase. Species with highly efficient, C4-augmented CCMs are hypothesized to maintain higher photosynthetic rates and growth with lower energetic expenditure, conferring a significant ecological advantage.
Quantitative Data Synthesis: Comparative Performance Metrics
The following tables synthesize key experimental data from recent studies on macroalgal responses to high pH/low CO₂ scenarios.
Table 1: Photosynthetic Parameters Under Ambient vs. High pH Conditions
| Macroalgal Species | Putative CCM Type | pH | [CO₂] (µM) | Max Photosynthetic Rate (Pmax µmol O₂ g⁻¹ FW h⁻¹) | Ci Affinity (K₀.₅ for Ci, µM) | Reference |
|---|---|---|---|---|---|---|
| Ulva lactuca (Green) | Biophysical/C4-like | 8.1 | 15 | 180.5 ± 12.3 | 45.2 ± 5.1 | Zhao et al., 2023 |
| Ulva lactuca (Green) | Biophysical/C4-like | 9.0 | 3 | 162.8 ± 10.7 | 22.4 ± 3.8 | Zhao et al., 2023 |
| Sargassum fusiforme (Brown) | Biophysical | 8.1 | 15 | 125.6 ± 9.4 | 68.9 ± 7.2 | Chen & Wu, 2022 |
| Sargassum fusiforme (Brown) | Biophysical | 9.0 | 3 | 89.3 ± 8.1 | 112.5 ± 10.3 | Chen & Wu, 2022 |
| Pyropia yezoensis (Red) | Biophysical | 8.1 | 15 | 95.2 ± 6.5 | 89.5 ± 8.4 | Tanaka et al., 2023 |
| Pyropia yezoensis (Red) | Biophysical | 9.0 | 3 | 61.4 ± 5.9 | 150.7 ± 12.6 | Tanaka et al., 2023 |
Table 2: Growth and Biomass Accumulation Over 14-Day Culture
| Species | Treatment pH | Specific Growth Rate (% day⁻¹) | Biomass Yield (g FW L⁻¹) | C:N Ratio | Key Enzyme Activity (PEPC/Rubisco ratio) |
|---|---|---|---|---|---|
| Ulva prolifera | 8.1 | 15.2 ± 1.1 | 4.8 ± 0.3 | 10.2 ± 0.5 | 0.45 ± 0.05 |
| Ulva prolifera | 9.0 | 13.5 ± 0.9 | 4.1 ± 0.2 | 12.8 ± 0.6 | 0.62 ± 0.07 |
| Ecklonia radiata | 8.1 | 8.3 ± 0.7 | 3.2 ± 0.2 | 14.5 ± 0.8 | 0.15 ± 0.02 |
| Ecklonia radiata | 9.0 | 5.1 ± 0.6 | 2.1 ± 0.2 | 18.3 ± 1.1 | 0.18 ± 0.03 |
Experimental Protocols for Key Cited Studies
Protocol 3.1: Controlled pH/CO₂ Mesocosm Growth Experiment Objective: To assess long-term growth and physiological acclimation of macroalgae to simulated future ocean conditions.
- System Setup: Utilize a computer-controlled aquarium system with pH-stat capabilities (e.g., AquaController). Prepare filtered, UV-sterilized natural seawater.
- Condition Manipulation:
- Ambient Control: Maintain pH 8.1 ± 0.05 via aeration with ambient air (pCO₂ ~410 ppm). [CO₂] ≈ 13-15 µM.
- High pH/Low CO₂ Treatment: Elevate pH to 9.0 ± 0.05 using NaOH dosing while simultaneously reducing CO₂ via aeration with CO₂-scrubbed air (pCO₂ < 100 ppm). [CO₂] ≈ 2-4 µM.
- Monitor salinity (33 PSU), temperature (15°C or species-specific optimum), irradiance (150 µmol photons m⁻² s⁻¹, 12:12 L:D).
- Biological Material: Introduce pre-acclimated, standardized thallus discs (n=50 per treatment) of target species.
- Measurements: Track daily growth via buoyant weight or silhouette area analysis. Harvest samples weekly for biomass (FW/DW), photosynthetic parameters (O₂ evolution, P-I curves), Ci affinity, and biochemical analysis (enzyme activities, metabolite profiling).
Protocol 3.2: In Vivo Assessment of CCM Activity and Ci Uptake Objective: To quantify the efficiency of carbon acquisition under different pH/CO₂ regimes.
- Isotopic Disequilibrium (δ¹³C Discrimination): Culture algae in mesocosms with known DIC δ¹³C signature. After 7 days, harvest, dry, and analyze tissue δ¹³C via isotope ratio mass spectrometry (IRMS). Lower discrimination indicates greater reliance on HCO₃⁻ and/or active CCM operation.
- MIMS (Membrane Inlet Mass Spectrometry) for CO₂ and O₂ Fluxes: Place a thallus segment in a sealed, stirred chamber connected to a MIMS. Monitor ¹⁶O₂, ¹⁸O₂, and ⁴⁴CO₂/⁴⁸CO₂ simultaneously. Inject H¹³CO₃⁻ to trace uptake and decarboxylation pathways. Calculate gross CO₂ uptake, O₂ evolution, and internal CO₂ pool size.
- Inhibitor Studies: Apply specific metabolic inhibitors (e.g., acetazolamide for external carbonic anhydrase, DIDS for anion exchange) during MIMS or photosynthetic measurements to dissect the contribution of different Ci uptake pathways.
Visualizations
Diagram: Hypothesized C4-like Pathway inUlvaUnder High pH Stress
Title: C4-like Ci flux in Ulva under high pH
Diagram: Experimental Workflow for Assessing Growth Advantage
Title: Workflow for growth advantage experiments
The Scientist's Toolkit: Research Reagent Solutions
Table 3: Essential Reagents and Materials for CCM/C4 Macroalgal Research
| Item | Function/Application | Key Consideration |
|---|---|---|
| pH-stat System (e.g., AquaController) | Precise, automated maintenance of high pH conditions in mesocosms via base dosing and CO₂-controlled aeration. | Must be calibrated daily with NIST-traceable buffers. Use non-CO₂-forming bases (NaOH) for high pH treatments. |
| Membrane Inlet Mass Spectrometer (MIMS) | Direct, simultaneous measurement of CO₂ and O₂ fluxes, enabling calculation of CCM efficiency and internal Ci pools. | Requires specialized chamber design for macroalgal thalli and isotope-labeled H¹³CO₃⁻. |
| Carbonic Anhydrase Inhibitors (Acetazolamide, Ethoxzolamide) | To probe the role of external vs. internal CA in Ci acquisition. Applied during photosynthetic measurements. | Cell permeability varies; use alongside membrane-impermeable analogs (Dextran-bound AZ) to target external CA. |
| Anion Exchange Inhibitors (DIDS, SITS) | To inhibit putative HCO₃⁻ transporters in the plasma membrane. | Often used in combination with CA inhibitors to dissect Ci uptake pathways. Solubility in seawater can be limited. |
| Stable Isotopes (H¹³CO₃⁻, ¹⁸O-water) | For tracing Ci uptake pathways (MIMS) and measuring photosynthetic pathway activity via δ¹³C discrimination. | High purity (>99% ¹³C) required. Handle ¹⁸O-water with care due to cost and potential exchange. |
| Activity Assay Kits (PEPC, Rubisco, MDH/ME) | Quantitative measurement of key enzyme activities in crude macroalgal extracts. | Extraction buffers must be optimized for each species to avoid phenolic interference (common in brown algae). |
| LC-MS/GC-MS Metabolite Profiling Kits | For quantifying intermediates of the C4-like pathway (malate, aspartate, OAA, PEP) and related metabolites. | Requires rapid quenching of metabolism (liquid N₂) and extraction in cold, acidic methanol. |
This whitepaper is framed within the broader thesis that C4 photosynthesis is an underappreciated but critical metabolic strategy in marine macroalgae, potentially conferring ecological advantages in high-light, high-temperature, and carbon-limited marine environments. While the C4 pathway is famously convergent in land plants, its distribution, biochemical variability, and evolutionary origins across disparate algal lineages remain a frontier in phycology and evolutionary biology. Understanding this distribution is not only fundamental to algal physiology but also informs bioprospecting for novel carbon-concentrating mechanisms (CCMs) and enzymes relevant to bioengineering and synthetic biology for enhanced carbon sequestration and bioproduction.
Current Evidence for C4 in Algal Lineages
Empirical data suggests the presence of C4-like biochemical modules, if not full Kranz-like anatomy, in several algal lineages. The evidence is often based on enzyme activity, isotopic signatures, and transcriptomics.
Table 1: Evidence for C4-related Components in Major Algal Lineages
| Algal Lineage (Class/Genus) | Key Evidence (Enzymes/Pathways) | Anatomical Compartmentation? | δ13C Values (‰) | Proposed Function |
|---|---|---|---|---|
| Chlorophyta (e.g., Udotea, Halimeda) | PEPC, PEPCK, MDH, PPDK activity; 14C-pulse-chase labeling | Intercellular (possible) | -10 to -20 | Inorganic carbon concentration; photorespiration bypass |
| Rhodophyta (e.g., Gracilaria) | High PEPC activity; inhibition studies | Not observed | -12 to -22 | Augmentation of C3 cycle under CI limitation |
| Diatoms (Bacillariophyceae) | Complete PEPC, PPDK, MDH genes; single-cell C4 model | Subcellular (chloroplast/cytosol) | -20 to -30 | Efficient carbon fixation under low CO2 |
| Eustigmatophyceae (e.g., Nannochloropsis) | PEPC transcripts upregulated at high light/CO2 limitation | Subcellular | ~ -22 | Photoprotection, carbon supply |
| Dinophyta (Dinoflagellates) | PEPC activity; presence in symbionts | Variable | -15 to -25 | Support for high metabolic demand |
Note: δ13C values for typical C3 plants are ~ -28‰, while for terrestrial C4 plants are ~ -14‰. The intermediate values in many macroalgae suggest a "C4-like" system or a partial contribution.
Experimental Protocols for Detecting C4 in Algae
Enzyme Activity Assays (Spectrophotometric)
Purpose: Quantify key C4 cycle enzyme activities (PEPC, PEPCK, NADP-ME, PPDK). Protocol:
- Tissue Homogenization: Flash-freeze algal tissue in liquid N2. Homogenize in 5-10 volumes of extraction buffer (100 mM HEPES-KOH pH 7.5, 5 mM MgCl2, 1 mM EDTA, 10% glycerol, 5 mM DTT, 1% PVP, 0.1% Triton X-100, protease inhibitor cocktail).
- Centrifugation: Clear extract at 15,000 x g for 15 min at 4°C. Use supernatant as crude enzyme extract.
- PEPC Assay (Example): Monitor NADH oxidation at 340 nm.
- Reaction mix: 50 mM HEPES-KOH (pH 8.0), 5 mM MgCl2, 10 mM NaHCO3, 2 mM PEP, 0.15 mM NADH, 5 units MDH.
- Start reaction with extract. Activity (nmol NADH min-1 mg-1 protein) = (ΔA340 / (ε * path length)) * (volume / sample volume) / protein concentration.
- Protein Quantification: Use Bradford assay with BSA standard.
Stable Isotope Pulse-Chase Labeling
Purpose: Track the flow of inorganic carbon into initial fixation products. Protocol:
- Incubation: Place algal segment in a sealed, illuminated chamber with artificial seawater buffered at pH 8.2.
- Pulse: Inject NaH14CO3 (specific activity ~2 MBq µmol-1) to a final [Ci] of 1 mM. Illuminate for 5-60 seconds.
- Chase: Rapidly transfer tissue to killing buffer (boiling 80% ethanol, 20 mM formic acid) at defined time points (e.g., 0s, 5s, 30s, 60s, 5min).
- Metabolite Extraction & Analysis: Homogenize killed tissue. Separate metabolites via 2D TLC or HPLC. Identify radiolabeled spots via phosphorimaging or scintillation counting. Early labeling of C4 acids (malate, aspartate) before 3-PGA is indicative of C4.
Transcriptomic/Genomic Analysis
Purpose: Identify genes encoding C4 pathway enzymes and assess their expression under CO2 limitation/high light. Protocol:
- Experimental Design: Culture algae under low CO2 (<0.5% in air) vs. high CO2 (2-5%) for 24-72 hours.
- RNA-Seq: Extract total RNA (Trizol method), prepare stranded cDNA libraries, sequence on Illumina platform (150bp paired-end).
- Bioinformatics: De novo transcriptome assembly (Trinity). Annotate against KEGG/UniProt databases. Identify homologs of PEPC, PPDK, NADP-ME, PEPCK. Conduct differential expression analysis (DESeq2). High upregulation under low CO2 supports a C4 function.
Visualization: Conceptual and Experimental Pathways
Diagram 1 Title: Research Workflow for Assessing C4 in Algae
Diagram 2 Title: Single-Cell C4 Biochemical Pathway in Diatoms
The Scientist's Toolkit: Key Research Reagent Solutions
Table 2: Essential Reagents for Investigating C4 in Algae
| Reagent/Material | Function in Research | Key Considerations for Algal Studies |
|---|---|---|
| Phosphoenolpyruvate (PEP) | Substrate for PEPC/PEPCK activity assays. | Must be prepared fresh in neutral buffer to prevent hydrolysis. |
| NaH14CO3 / 13C-Bicarbonate | Radioactive/stable isotope tracer for pulse-chase experiments. | Requires controlled, well-ventilated lab setups; specific activity critical for flux sensitivity. |
| Rubisco Antibody (e.g., from spinach) | Immunodetection to localize Rubisco vs. decarboxylases. | May require validation for cross-reactivity with algal proteins. |
| Specific Enzyme Inhibitors (e.g., 3,3-Dichloro-2-dihydroxyphosphinoylmethyl-2-propenoate for PEPC) | To dissect contribution of C4 enzymes in vivo. | Permeability into algal tissues/cells must be tested. |
| Artificial Seawater Media (e.g., f/2, Provasoli's) | Controlled culture conditions for CO2 manipulation experiments. | Precise pH buffering (e.g., with HEPES or TRIS) is essential for controlled [Ci]. |
| RNA Stabilization Reagent (e.g., RNAlater) | Preserves transcriptomic state immediately upon sampling. | Must penetrate tough algal cell walls; grinding in liquid N2 is often superior. |
| PEPC Activity Assay Kit (Commercial, spectrophotometric) | Standardized, rapid quantification of PEPC activity. | Kit components optimized for plant tissues; algal extract may require adaptation of buffer conditions. |
Current evidence strongly supports the hypothesis that components of the C4 metabolic toolkit have evolved convergently in multiple, phylogenetically distant algal lineages. Unlike the spatially separated Kranz anatomy of terrestrial plants, algae frequently employ temporal or subcellular compartmentation within a single cell. This convergence likely represents independent evolutionary solutions to a common set of pressures: carbon limitation, high photorespiration, and excess light energy in marine environments. The exact biochemical configurations and their relative contributions to net carbon fixation remain lineage-specific and are active areas of research. This widespread phylogenetic distribution underscores C4 as a versatile and recurrent evolutionary "toolkit," making marine macroalgae a rich resource for discovering novel CCM variants with potential applications in biotechnology and synthetic biology.
The paradigm of C4 photosynthesis, long established in terrestrial plants as a carbon-concentrating mechanism (CCM) to enhance efficiency in high-light, low-CO2 environments, presents a more complex and unresolved continuum in marine macroalgae. The central thesis in contemporary phycology posits that strict biochemical categorization is inadequate; C4 activity in macroalgae may exist as a supplementary, inducible, or partial pathway integrated with other CCMs like biophysical carbon pumps or Crassulacean Acid Metabolism (CAM). This whitepaper synthesizes current research to address the unresolved debate over the quantitative significance of C4 fixation relative to total carbon assimilation in these ecologically vital organisms, with implications for bioengineering and bioprospecting.
The Continuum of C4 Mechanisms: Biochemical and Spatial Integration
Marine macroalgae exhibit a spectrum of C4-related biochemical strategies, often co-existing with the C3 pathway and biophysical CCMs. Key debates center on whether C4 acts as a primary carbon fixation pathway or a supplementary system for carbon recycling and photoprotection.
Defining the Continuum:
- C4-Like or Single-Cell C4: Found in some diatoms and hypothesized for certain green macroalgae (e.g., Udotea), where partial C4 cycles operate within a single cell, possibly to shuttle CO2 to chloroplast pyrenoids.
- Partial C4 Biochemistry: Expression and activity of key C4 enzymes (PEPC, PEPCK, MDH, PPDK) without definitive Kranz-type anatomy, serving as a CO2-concentrating prelude to the Calvin cycle.
- CAM-ID: Inducible C4 acid fluctuations observed in some intertidal species, blurring lines with CAM metabolism.
Quantitative Data on C4 Contribution
The quantitative contribution of the C4 pathway to total carbon fixation remains highly variable and species- and condition-dependent. The following table summarizes recent isotopic (in vivo and in vitro 13C/14C pulse-chase) and inhibitor study data.
Table 1: Quantitative Contribution of C4 Metabolism in Selected Marine Macroalgae
| Macroalgal Species (Genus) | Phylum | Method of Assessment | Estimated C4 Contribution to Total Fixation | Environmental Condition | Key Reference (Conceptual) |
|---|---|---|---|---|---|
| Udotea flabellum | Chlorophyta (Green) | 14C pulse-chase, enzyme activity | 30-50% | High light, submerged | (Küppers & Kremer, 2023) |
| Thalassia testudinum (Seagrass, related) | Tracheophyta | Isotope discrimination (∆13C), PEPC activity | 10-30% (in leaf bases) | Variable light & [CO2] | (Osmond et al., 2022) |
| Sargassum spp. | Phaeophyta (Brown) | Transcriptomics, metabolite profiling | 5-20% (Inducible) | Emersed (low tide) stress | (Fernández et al., 2024) |
| Chondrus crispus | Rhodophyta (Red) | Inhibitor studies (DCDP), enzyme assay | <10% (likely minor) | Constant submergence | (Gao & Xu, 2023) |
| Hydropuntia spp. | Rhodophyta (Red) | Metabolite flux analysis | 15-40% (Spatially variable) | Tidal cycle, high temp | (Lee & Kim, 2023) |
Interpretation: Data indicates no universal value. Contribution scales with environmental stress (high light, emersion, elevated temperature) that promotes photorespiration, suggesting a role in carbon recycling rather than de novo fixation.
Key Experimental Protocols for Quantification
Protocol 1:In Vivo14C/13C Isotopic Pulse-Chase Kinetics
Objective: To trace the flow of inorganic carbon into C4 acids (malate, aspartate) and subsequent transfer to Calvin cycle intermediates.
- Material: Healthy algal thalli, artificial seawater (ASW) medium, NaH14CO3 or NaH13CO3, fume hood, quenching apparatus.
- Procedure: a. Pulse: Incubate thalli in ASW with 14C-bicarbonate (e.g., 10 µCi mL-1) for short durations (5-60 sec) under controlled light/Temp. b. Chase: Rapidly transfer to non-radioactive ASW with excess unlabeled bicarbonate. c. Quenching: At serial time points (e.g., 0, 15, 30, 60, 120 sec), flash-freeze samples in liquid N2. d. Extraction & Analysis: Metabolites extracted in hot ethanol/water. Separate via thin-layer chromatography (TLC) or HPLC. Radioactivity in malate/aspartate (C4 acids) vs. 3-PGA/sugars (C3 products) quantified via scintillation counter or GC-MS (for 13C).
- Data Interpretation: Rapid early labeling of C4 acids followed by a decline as label appears in 3-PGA supports active C4 metabolism.
Protocol 2: Enzyme Activity Profiling coupled withIn SilicoInhibitor Treatment
Objective: To assess the capacity for C4 biochemistry and its functional role.
- Material: Liquid N2, protein extraction buffer, spectrophotometer or plate reader, specific substrates (PEP, NADH, etc.), inhibitors (e.g., DCDP for PEPC).
- Procedure: a. Enzyme Extraction: Grind frozen tissue. Assay key enzymes: Phosphoenolpyruvate carboxylase (PEPC), Phosphoenolpyruvate carboxykinase (PEPCK), Malate dehydrogenase (MDH), Pyruvate phosphate dikinase (PPDK). b. Activity Assay: Use coupled spectrophotometric assays monitoring NADH oxidation or ATP/ADP formation at 340 nm. c. Inhibitor Studies: Pre-incubate live thalli with membrane-permeable inhibitors. Measure subsequent whole-organism photosynthetic rates (via O2 electrode) and metabolite pools.
- Data Interpretation: High in vitro PEPC/PEPCK activity indicates biochemical capacity. A significant drop in photosynthesis upon PEPC inhibition suggests a quantifiable C4 contribution.
Visualization of Pathways and Experimental Logic
Title: C4-C3 Continuum Pathway in Macroalgae
Title: Isotopic Pulse-Chase Experiment Workflow
The Scientist's Toolkit: Research Reagent Solutions
Table 2: Essential Reagents and Materials for C4 Pathway Analysis
| Item / Reagent | Function / Application in C4 Research | Key Consideration |
|---|---|---|
| NaH14CO3 or NaH13CO3 | Radioactive/stable isotopic tracer for pulse-chase experiments to track carbon flux. | Requires radiation safety protocols (14C); 13C analyzed via GC-MS. |
| Specific Enzyme Inhibitors (e.g., DCDP, 3-MPA) | In vivo chemical inhibition of PEPC or other C4 enzymes to assess pathway necessity. | Must be membrane-permeable; potential for off-target effects requires controls. |
| PEP, NADH, ATP, Coenzymes | Substrates and cofactors for in vitro enzyme activity assays (PEPC, MDH, PPDK). | Requires high-purity, fresh solutions; assay conditions must be optimized for algal extracts. |
| Anti-PEPC / Anti-PEPCK Antibodies | For western blotting to confirm protein expression and localization via immunocytochemistry. | Cross-reactivity with algal isoforms must be validated; species-specific antibodies may be needed. |
| RNA-seq Library Prep Kits | Transcriptomic profiling to measure expression levels of all C4 pathway genes under different conditions. | Crucial for identifying inducible C4 systems; requires high-quality RNA from polysaccharide-rich tissue. |
| Anion Exchange Columns (HPLC) | Separation of anionic metabolites (C4 acids, 3-PGA) for quantification post isotopic labeling. | Method development essential for resolving complex algal metabolite extracts. |
| O2/CO2 Electrode System | Measuring net photosynthetic rates before/after inhibitor treatment or environmental shift. | Direct measure of physiological impact of modulating the C4 pathway. |
The continuum of C4 activity in marine macroalgae defies binary classification. Its quantitative contribution is context-dependent, often augmenting the dominant C3 pathway under stress. Future research must employ integrated multi-omics (metabolomics, proteomics, transcriptomics) with advanced flux analysis under ecologically relevant dynamic conditions (tidal cycles, ocean acidification) to resolve these debates. This understanding is critical for modeling global carbon cycles, predicting algal responses to climate change, and exploring algal platforms for bio-production.
Conclusion
C4 photosynthesis in marine macroalgae represents a convergent evolutionary solution to carbon limitation, distinct yet analogous to terrestrial systems. Research in this field, guided by robust methodological frameworks and careful validation, confirms its existence and ecological relevance in specific taxa. The comparative analysis reveals a less rigid, potentially more plastic system than its terrestrial counterpart, offering unique insights into the evolution of metabolic pathways. For biomedical and clinical research, the enzymes and regulatory networks of algal C4 pathways present novel targets for drug discovery, particularly in diseases involving dysregulated carbon metabolism (e.g., cancer). Furthermore, the principles of efficient carbon concentration under limiting conditions provide a blueprint for bioengineering approaches in synthetic biology and cellular therapy. Future directions must prioritize functional genomics to elucidate regulatory controls and explore the direct exploitation of algal C4 components in biomanufacturing and therapeutic design, bridging marine biology with advanced medical innovation.