Unveiling the Microbial Architects: How Marinomonas Biogeochemical Cycling Drives Ocean Health and Drug Discovery
This article provides a comprehensive analysis of the ecological role and metabolic versatility of the marine gammaproteobacterium *Marinomonas* in global biogeochemical cycles.
Unveiling the Microbial Architects: How Marinomonas Biogeochemical Cycling Drives Ocean Health and Drug Discovery
Abstract
This article provides a comprehensive analysis of the ecological role and metabolic versatility of the marine gammaproteobacterium *Marinomonas* in global biogeochemical cycles. Targeting researchers and drug development professionals, we first establish the taxonomic and genomic foundations of the genus, detailing its unique adaptations to diverse marine niches. We then explore methodological approaches for studying its carbon, nitrogen, and sulfur cycling capabilities, highlighting its production of bioactive compounds like hydrolytic enzymes and biosurfactants. The discussion addresses key challenges in culturing, genomic analysis, and metabolic pathway elucidation, offering optimization strategies. Finally, we validate *Marinomonas*'s significance through comparative genomics and ecological impact studies, positioning it as a crucial model for understanding ocean biochemistry and a promising source of novel pharmaceutical leads.
Marinomonas Uncovered: Taxonomy, Genomics, and Niche Adaptation in Marine Ecosystems
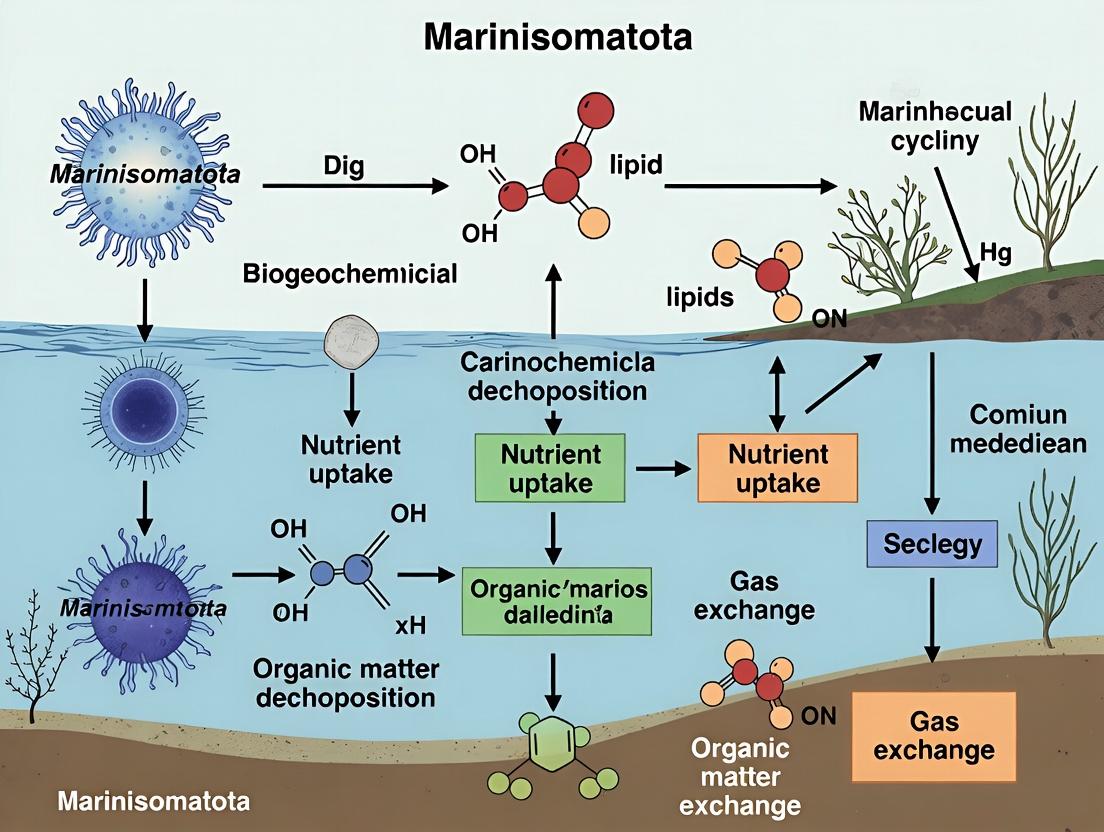
1. Introduction and Thesis Context Within the broader phylum Marinisomatota (formerly Bacteroidota), the genus Marinomonas stands out as a globally distributed, obligately marine gammaproteobacterium. Research into its ecological role and contribution to biogeochemical cycling is intrinsically linked to a robust and phylogenetically coherent taxonomic framework. This guide details the historical and current phylogenetic delineation of Marinomonas, providing the necessary taxonomic precision for ecological studies, such as those investigating its role in carbon polymer degradation, dimethylsulfoniopropionate (DMSP) metabolism, and biofilm formation in marine environments.
2. Phylogenetic History and Evolution of the Genus The genus Marinomonas was established by Van Landschoot and De Ley in 1984 with Marinomonas vaga as the type species. Early classification relied heavily on phenotypic and chemotaxonomic traits. The advent of 16S rRNA gene sequencing revolutionized its phylogenetic placement, confirming it within the Oceanospirillales order, family Oceanospirillaceae.
Key phylogenetic redefinitions occurred as sequencing capabilities advanced:
- Initial Broad Genus: Early classifications included a wide range of phenotypically similar marine, polar-flagellated, aerobic rods.
- Genus Splitting: Polyphasic taxonomy, combining 16S rRNA phylogeny, DNA-DNA hybridization (DDH), and later, whole-genome metrics (Average Nucleotide Identity - ANI), led to the delineation of several distinct genera. Notably, species were transferred to Marinobacterium, Marinospirillum, Neptunomonas, and Oleomonas.
- Core Marinomonas: The genus was refined to include species primarily sharing >97% 16S rRNA gene similarity and distinct phenotypic clusters, though 16S alone proved insufficient for definitive species discrimination.
3. Current Taxonomic Classification: Genomic Standards The current classification of Marinomonas is governed by genomic criteria, moving beyond the historical 70% DDH threshold for species demarcation.
- Genus-Level Delineation: Monophyly in genome-based phylogenomic trees (using concatenated conserved protein sequences) is the primary criterion.
- Species Demarcation: The universally accepted standard is an Average Nucleotide Identity (ANI) value of <95-96%, corresponding to the traditional 70% DDH. In silico DDH (isDDH) values of <70% are also used.
- Type Material: Description of novel species requires deposition of both a type strain in two international culture collections and the whole-genome sequence in a public database.
Table 1: Genomic Thresholds for Taxonomic Classification of Prokaryotes (including Marinomonas)
| Taxonomic Rank | Key Genomic Criterion | Recommended Threshold | Supporting Metrics |
|---|---|---|---|
| Genus | Phylogenomic tree monophyly | Consistent branching in core-genome tree | AAI < ~65-70% |
| Species | Average Nucleotide Identity (ANI) | < 95-96% | isDDH < 70% |
| Subspecies | ANI within species | ≥ 99.9% | isDDH ≥ 79% |
Table 2: Selected Validly Published Marinomonas Species (as of 2024)
| Species Name | Type Strain | Isolation Source | Genome Size (Mb) ~ | GC Content % ~ | Notable Metabolic Trait |
|---|---|---|---|---|---|
| M. communis | LMG 2864^T | Seawater, oyster | 5.2 | 46.5 | Agar degradation |
| M. posidonica | IVIA-Po-181^T | Seagrass (Posidonia oceanica) | 5.8 | 44.8 | Associated with seagrass health |
| M. mediterranea | MMB-1^T | Seawater | 5.4 | 45.7 | Laccase production, polyphenol metabolism |
| M. primoryensis | KMM 3633^T | Coastal sea ice | 4.3 | 40.6 | Antifreeze protein activity |
| M. aquimarina | GSD1-18^T | Seawater | 5.0 | 45.0 | Common in coastal waters |
4. Experimental Protocols for Taxonomic Delineation
Protocol 4.1: Genome-Based Phylogenomic Analysis
- Data Retrieval: Download whole-genome sequences of target Marinomonas strains and related outgroup taxa from NCBI GenBank.
- Core Genome Identification: Use orthology-finding software (e.g., OrthoFinder, Roary) to identify single-copy core genes present in ≥95% of genomes.
- Alignment and Concatenation: Align each core gene sequence (using MAFFT or MUSCLE). Concatenate alignments into a supermatrix.
- Phylogenetic Inference: Construct a maximum-likelihood tree (using IQ-TREE or RAxML) with appropriate model selection (ModelFinder) and 1000 bootstrap replicates.
- Visualization: Root the tree with the outgroup and visualize (FigTree, iTOL).
Protocol 4.2: Calculation of Average Nucleotide Identity (ANI)
- Prepare Genomes: Assemble draft genomes to contig level. Annotate or use raw contigs.
- Software Selection: Use the OrthoANIu algorithm (OAT software) or the BLAST-based ANIb (in JSpeciesWS or PYANI).
- Run Analysis: Input genome files in FASTA format. The software fragments sequences, performs all-vs-all BLASTN, and calculates mean identity.
- Interpretation: Generate a matrix of ANI values. Values ≥95-96% indicate the same species; values <95% indicate different species.
5. Visualization of Taxonomic Workflow and Phylogenetic Relationships
Title: Polyphasic Taxonomy Workflow for Marinomonas
Title: Phylogenetic Position of Marinomonas among Relatives
6. The Scientist's Toolkit: Key Research Reagent Solutions
Table 3: Essential Reagents and Materials for Marinomonas Research
| Item Name | Function / Application | Example/Note |
|---|---|---|
| Marine Agar/Broth 2216 | Standard isolation and cultivation medium. | Formulated with seawater salts, peptone, and yeast extract. |
| Artificial Seawater Base | For defined medium preparation and physiological studies. | Allows controlled manipulation of ionic composition. |
| Dimethylsulfoniopropionate (DMSP) | Substrate for studying sulfur cycling pathways. | Key to investigating DMSP lyase/cleavage genes in Marinomonas. |
| Alginate/Agarose Polymers | Substrates for studying carbon cycling and enzyme activity. | Used to screen for and quantify extracellular hydrolytic enzymes. |
| DNA Extraction Kit (Marine Biofilm) | High-quality genomic DNA extraction from complex samples. | Must include steps for polysaccharide and salt removal. |
| Taq Polymerase for GC-Rich Templates | PCR amplification of high GC-content Marinomonas DNA. | Often requires additives like DMSO or betaine for optimal yield. |
| ANI Calculation Software (OAT/PYANI) | Standardized genomic species demarcation. | OrthoANIu algorithm is currently the gold standard. |
| Phylogenomic Pipeline (OrthoFinder) | Identifies core genes for robust phylogenetic trees. | From genomes to a concatenated alignment for tree building. |
Thesis Context: This analysis is framed within a broader thesis investigating the ecological role of the phylum Marinisomatota (formerly PVC group candidate phylum) in marine biogeochemical cycling, with Marinomonas as a model genus for understanding genomic adaptations to niche specialization.
Marinomonas species are gammaproteobacteria inhabiting diverse marine environments, from coastal waters to deep-sea sediments. Their genomes reflect adaptations to specific ecological niches, particularly in carbon cycling and oxidative stress response.
Table 1: Core Genomic Features of Select Marinomonas Species
| Species Name | Genome Size (Mb) | GC Content (%) | Total CDSs | Key Genomic Islands/Adaptations | Primary Habitat |
|---|---|---|---|---|---|
| M. mediterranea MMB-1 | 5.3 | 44.2 | 4,512 | Melanin biosynthesis, laccase clusters | Seagrass rhizosphere |
| M. pollencensis IVIA-Po-185 | 4.8 | 45.1 | 4,101 | Agar degradation, carrageenan catabolism | Phycosphere (algae) |
| M. dokdonensis DSW10-10 | 4.5 | 46.8 | 3,987 | Cold-shock proteins, EPS biosynthesis | Deep seawater |
| M. communis | 5.1 | 43.9 | 4,345 | Siderophore biosynthesis, TonB systems | Coastal sediment |
Key Functional Modules and Pathways
Central Carbon Metabolism & Biogeochemical Cycling
Genomes encode diverse pathways for polysaccharide degradation (e.g., agar, alginate, cellulose), positioning them as key remineralizers of marine organic matter. A conserved denitrification cluster (nar, nir, nor) is present in sediment-dwelling species, implicating them in nitrogen cycling.
Stress Response and Environmental Sensing
A hallmark is the expansion of reactive oxygen species (ROS) detoxification systems (catalases, peroxidases, superoxide dismutases), crucial for survival in oxygenated surface waters and in association with photosynthetic hosts. Heavy metal resistance (e.g., copper, zinc) clusters are common in coastal isolates.
Diagram 1: Key Stress Response Pathway in Marinomonas
Experimental Protocols for Genomic Analysis
Protocol 3.1: Comparative Genomic Analysis of Biogeochemical Gene Clusters
Objective: Identify and compare gene clusters involved in carbon and nitrogen cycling across Marinomonas isolates.
- Genome Retrieval: Download complete/annotated genomes from NCBI GenBank for target species.
- Functional Annotation: Use Prokka for uniform re-annotation. Perform ortholog clustering with OrthoFinder (v2.5.4).
- HMM Search: Use curated HMM profiles (e.g., from Pfam, dbCAN2, and FunGene) to identify key enzymatic markers (e.g., polyketide synthases, laccases, nitrite reductases).
- Synteny Visualization: Extract regions of interest and visualize synteny using the Clinker tool with a 70% identity threshold.
- Phylogenetic Reconciliation: Construct a maximum-likelihood phylogeny (IQ-TREE, model TEST) of single-copy core genes. Map presence/absence of target clusters onto the tree using ggtree.
Protocol 3.2: Functional Validation of Polysaccharide Utilization Loci (PULs)
Objective: Experimentally confirm the activity of predicted algal polysaccharide degradation clusters.
- Growth Profiling: Inoculate Marinomonas strains into minimal marine medium (2216) with 0.5% (w/v) sole carbon source (agar, alginate, carrageenan). Monitor OD600 for 120h at 25°C.
- Enzyme Assay: Harvest cells at mid-log phase. Prepare cell-free lysates. Measure agarase/alginase activity via DNS assay for reducing sugars released from substrate.
- RNA-seq Validation: Grow triplicate cultures on target polysaccharide vs. glucose control. Extract total RNA, construct libraries, sequence (Illumina). Map reads to reference genome, calculate TPM. Validate upregulation of genes within predicted PUL.
Diagram 2: PUL Functional Validation Workflow
The Scientist's Toolkit: Research Reagent Solutions
Table 2: Essential Materials for Genomic and Functional Analysis of Marinomonas
| Item | Function/Application | Example Product/Kit |
|---|---|---|
| Marine 2216 Medium | Standard cultivation medium for marine heterotrophs. | Difco Marine Broth 2216 |
| Polysaccharide Substrates | Carbon sources for PUL activity assays. | Sigma-Aldrich: Agar (A1296), Sodium Alginate (W201502) |
| DNase/RNase-Free Water | Critical for molecular biology steps to prevent degradation. | Invitrogen UltraPure DNase/RNase-Free Water |
| Nucleic Acid Extraction Kit | High-yield, pure genomic DNA/RNA from high-GC marine bacteria. | Qiagen DNeasy PowerBiofilm Kit; RNeasy PowerMicrobiome Kit |
| HMM Profile Database | Identification of conserved protein domains in biogeochemical cycles. | Pfam (pfam.xfam.org); dbCAN2 for CAZymes |
| PCR Reagents for GC-rich DNA | Optimized polymerases for amplifying high-GC regions. | Takara PrimeSTAR GXL DNA Polymerase |
| Transcriptome Library Prep Kit | Stranded RNA-seq library construction for bacterial mRNA. | Illumina Stranded Total RNA Prep Ligation with Ribo-Zero Plus |
| Reducing Sugar Assay Kit | Colorimetric quantification of polysaccharide degradation. | MilliporeSigma DNS Assay Kit (MAK267) |
This whitepaper frames the exploration of three distinct marine biomes—polar seas, hydrothermal vents, and coral reefs—within the broader thesis of elucidating the ecological role of the bacterial phylum Marinisomatota (formerly known as SAR406 or Marine Group A). The central hypothesis posits that Marinisomatota are pivotal, yet understudied, participants in global biogeochemical cycles, with niche adaptations across these habitats enabling specialized carbon, sulfur, and nitrogen transformations. Understanding their metabolic pathways is not only critical for oceanographic models but also for bioprospecting novel enzymatic machineries relevant to drug development, including extremophile-derived bioactive compounds and novel antimicrobials.
Comparative Biome Analysis &MarinisomatotaPrevalence
Quantitative data from recent genomic and biogeochemical studies are summarized in Table 1.
Table 1: Comparative Analysis of Three Marine Habitats and Marinisomatota Metrics
| Parameter | Polar Seas (Arctic/Antarctic) | Deep-Sea Hydrothermal Vents | Shallow-Water Coral Reefs |
|---|---|---|---|
| Key Physical-Chemical Gradient | Temperature (-1.8 to 5°C), Seasonal Light/Ice | Extreme Temp. Gradient (2 to >400°C), High Pressure, Chemical Flux | High Light, Temperature (24-30°C), Oligotrophic, Diurnal pH/O₂ Cycles |
| Dominant Energy Source | Photosynthesis (seasonal), Chemoautotrophy (dark period) | Chemosynthesis (H₂S, H₂, CH₄, Fe²⁺ oxidation) | Photosynthesis (Symbiotic dinoflagellates), Heterotrophy |
| Critical Biogeochemical Process | Carbon Export (Biological Pump), Silica Cycling | Sulfur Cycling, Methanogenesis/Methanotrophy, Mineral Deposition | Calcium Carbonate Accretion, Nitrogen Fixation, Organic Matter Recycling |
| Marinisomatota Relative Abundance | 1-5% of microbial community (increased in mesopelagic) | Up to 15% in diffuse, cooler vent fluids & plumes | 2-8% in reef waters & subsurface layers of carbonate sand |
| Postulated Marinisomatota Role | Degradation of complex, high-molecular-weight dissolved organic matter (HMW-DOM). Potential aerobic anoxygenic phototroph? | Sulfur oxidation (via sox gene clusters), hydrogen metabolism, adaptation to low-oxygen, sulfidic niches. | Glycoside hydrolase-mediated cycling of algal & coral exudates (e.g., sulfated polysaccharides). |
| Relevant Drug Discovery Link | Cold-adapted enzymes (psychrophiles), antifreeze proteins, novel antimicrobials from competition in nutrient-poor env. | Thermostable enzymes, metalloenzymes, antioxidants, novel chemical scaffolds from unique metabolisms. | Quorum-sensing inhibitors (from microbial competition), anti-fouling compounds, UV-protectants. |
Experimental Protocols for InvestigatingMarinisomatotaFunction
Protocol 3.1: Stable Isotope Probing (SIP) Coupled with Metagenomics for Carbon Substrate Utilization Objective: To identify active Marinisomatota populations and their substrate preferences in habitat-specific samples. Methodology:
- Sample Incubation: Collect seawater or sediment slurry. Amend with ¹³C-labeled substrate (e.g., ¹³C-algal polysaccharides for reef/polar samples; ¹³C-bicarbonate or ¹³C-methane for vent samples). Run parallel ¹²C-controls.
- Incubation Conditions: Maintain in situ temperature and pressure (using pressurized reactors for vent samples) for 48-72 hours.
- Nucleic Acid Extraction: Preserve samples, extract total environmental DNA and RNA.
- Density Gradient Centrifugation: Subject DNA to ultracentrifugation in cesium chloride density gradient. Fractionate to separate ¹³C-heavy (active) from ¹²C-light (inactive) DNA.
- Sequencing & Analysis: Perform shotgun metagenomic sequencing on heavy fractions. Assemble reads, bin genomes. Identify Marinisomatota-affiliated genomes via phylogenetic markers (16S rRNA, ribosomal proteins). Annotate for carbohydrate-active enzymes (CAZymes), sulfur oxidation (sox), and hydrogenase genes.
Protocol 3.2: Fluorescence In Situ Hybridization - NanoSIMS (FISH-NanoSIMS) for Single-Cell Activity Objective: To quantify element (e.g., C, N, S) assimilation rates by individual Marinisomatota cells within complex communities. Methodology:
- FISH Probe Design: Design oligonucleotide probes targeting the 16S rRNA of specific Marinisomatota clades (e.g., CL500-11 for polar mesopelagic).
- Sample Fixation & Hybridization: Fix samples with paraformaldehyde. Perform CARD-FISH (Catalyzed Reporter Deposition) with HRP-labeled probes and fluorescent tyramides for signal amplification.
- NanoSIMS Preparation: Mount FISH-stained samples on silicon wafhers. Coat with a conductive layer (gold or carbon).
- Isotopic Incubation: Prior to fixation, incubate samples with a rare isotope (e.g., ¹⁵N-ammonium, ³⁴S-sulfide, or ¹³C-bicarbonate).
- Imaging & Analysis: Use NanoSIMS to image the same cells located via FISH. Map isotopic ratios (e.g., ¹³C/¹²C). Co-localize high isotopic enrichment with probe-positive cells to confirm activity and measure incorporation rates at the single-cell level.
Visualization:MarinisomatotaMetabolic Pathways & Research Workflow
Diagram Title: Marinisomatota Metabolic Niche Adaptation Across Biomes (76 chars)
Diagram Title: Marinisomatota Functional Analysis Experimental Workflow (75 chars)
The Scientist's Toolkit: Key Research Reagent Solutions
Table 2: Essential Reagents and Materials for Marinisomatota Research
| Item | Function & Application | Example/Note |
|---|---|---|
| ¹³C/¹⁵N/³⁴S-Labeled Substrates | Tracer for SIP and NanoSIMS experiments to track element flow into biomass. | ¹³C-sodium alginate (reef studies); ¹³C-bicarbonate (vent/polar); ³⁴S-thiosulfate (vent studies). |
| CARD-FISH Probe Set | High-sensitivity detection of Marinisomatota 16S rRNA in environmental samples for enumeration and cell sorting. | HRP-labeled probes targeting clade-specific sequences (e.g., CL500-11, vent-associated MG-A). |
| Metagenomic Library Preparation Kit | Preparation of high-molecular-weight DNA for Illumina/PacBio sequencing from low-biomass, complex samples. | Kits with enhanced removal of humic acids (common in marine samples) are critical. |
| Anaerobic/Methanogenic Medium | Enrichment and cultivation attempts of putative anaerobic Marinisomatota from vents and sediments. | Contains reducing agents (Na₂S, Cysteine-HCl), bicarbonate buffer, and specific electron donors. |
| High-Pressure Reactor (HPRI) | Maintain in situ pressure conditions during incubations of deep-sea vent or pelagic samples to prevent physiological shock. | Essential for accurate activity measurements from piezophilic populations. |
| Size-Fractionated DOM | Physiologically relevant substrate for growth assays and enzyme kinetics studies. | HMW-DOM (>1kDa) isolated via tangential flow filtration from source habitat seawater. |
| CRISPR/Cas9 Gene Editing System (for model bacteria) | Functional validation of putative Marinisomatota genes heterologously expressed in tractable hosts. | Used to knock-in/knock-out genes of interest (e.g., specific sulfatases) to confirm substrate utilization pathways. |
This whitepaper provides a technical foundation for understanding the core metabolic pathways governing biogeochemical cycles, framed within a broader research thesis investigating the ecological role of the candidate phylum Marinisomatota. Recent genomic and metagenomic studies position Marinisomatota as a putative key player in marine sedimentary ecosystems, with predicted genomic capabilities for the anaerobic degradation of complex organic matter and participation in sulfur and nitrogen transformations. Elucidating the specific enzymes and pathways employed by this phylum is critical for modeling their contribution to global carbon sequestration, nitrogen availability, and sulfur redox balance. This guide details the central pathways, quantitative benchmarks, and experimental methodologies relevant to this line of inquiry.
Core Cycling Pathways: Mechanisms and Key Enzymes
Carbon Cycling: Anaerobic Decomposition and Fermentation
In anoxic sediments, Marinisomatota are predicted to utilize a fermentative metabolism. The central pathway involves the breakdown of polysaccharides (e.g., cellulose, chitin) to monosaccharides, followed by glycolysis (Embden-Meyerhof-Parnas pathway) to pyruvate. Pyruvate is then a key branch point.
Key Terminal Reactions:
- Acetogenesis: Pyruvate → Acetate + CO₂ (via PFOR and acetyl-CoA intermediates).
- Propionogenesis: Pyruvate → Propionate (via succinate pathway or acrylate pathway).
- Butyrogenesis: Two acetyl-CoA → Butyrate.
Diagram: Anaerobic Carbon Fermentation Pathways
Nitrogen Cycling: Dissimilatory Nitrate Reduction and Assimilation
Genomic analyses suggest Marinisomatota may perform dissimilatory nitrate reduction to ammonium (DNRA), competing with denitrifiers for nitrate in sediments.
Key Pathway (DNRA):
- Nitrate (NO₃⁻) → Nitrite (NO₂⁻) via Periplasmic Nitrate Reductase (Nap).
- Nitrite (NO₂⁻) → Ammonium (NH₄⁺) via Cytochrome c Nitrite Reductase (NrfA).
Assimilatory nitrogen incorporation occurs via the glutamine synthetase (GS) / glutamate synthase (GOGAT) pathway.
Diagram: Predicted Nitrogen Pathways in Marinisomatota
Sulfur Cycling: Sulfite Reduction and Organic Sulfur Metabolism
Marinisomatota genomes frequently encode complexes for the reduction of sulfite (SO₃²⁻) to sulfide (H₂S), likely as an electron sink during fermentation.
Key Pathway (Assimilatory Sulfite Reduction):
- Sulfate (SO₄²⁻) → Adenosine 5'-phosphosulfate (APS) via ATP sulfurylase (Sat).
- APS → Sulfite (SO₃²⁻) via APS reductase (Apr).
- Sulfite (SO₃²⁻) → Sulfide (H₂S) via Dissimilatory sulfite reductase (DsrAB).
Diagram: Sulfite Reduction as an Electron Sink
Table 1: Key Enzymatic Rate Constants in Sedimentary Biogeochemistry
| Enzyme (EC Number) | Pathway | Typical Substrate | Reported Vmax Range (nmol·min⁻¹·mg protein⁻¹) | Reference Environment |
|---|---|---|---|---|
| Nitrate Reductase, NapA (1.7.99.4) | DNRA | Nitrate | 50 - 200 | Coastal Sediment |
| Cytochrome c Nitrite Reductase, NrfA (1.7.2.2) | DNRA | Nitrite | 80 - 500 | Anoxic Marine Sediment |
| Dissimilatory Sulfite Reductase, DsrAB (1.8.99.5) | Sulfur Reduction | Sulfite | 20 - 150 | Sulfidic Mud Flat |
| Pyruvate:Ferredoxin Oxidoreductase, PFOR (1.2.7.1) | Carbon Fermentation | Pyruvate | 500 - 2000 | Fermentative Bacterium |
| Formyltetrahydrofolate Synthetase, Fhs (6.3.4.3) | Wood-Ljungdahl (Acetogenesis) | Formate | 100 - 600 | Anaerobic Digester |
Table 2: Representative Geochemical Porewater Concentration Ranges
| Analytic | Typical Concentration Range (μM) in Anoxic Marine Sediments | Significance for Marinisomatota Metabolism |
|---|---|---|
| Dissolved Organic Carbon (DOC) | 100 - 500 | Primary carbon/energy source for fermentation. |
| Sulfate (SO₄²⁻) | 5,000 - 28,000 (Seawater) to 0-100 (Deep Anoxic) | Terminal electron acceptor for sulfate reducers; competitor for electron donors. |
| Sulfite (SO₃²⁻) | < 1 - 10 (transient) | Key intermediate; electron acceptor for sulfite reductases. |
| Nitrate (NO₃⁻) | 0 - 50 | Electron acceptor for DNRA or denitrification. |
| Ammonium (NH₄⁺) | 10 - 500 | Product of DNRA; assimilatory nitrogen source. |
Experimental Protocols for Pathway Validation
Protocol: Measuring Dissimilatory Nitrate Reduction to Ammonium (DNRA) Activity in Sediment Slurries
Objective: Quantify potential DNRA rates and differentiate from denitrification. Principle: Use ¹⁵N-labeled nitrate tracer and track the production of ²⁹N₂ (denitrification) vs. ¹⁵NH₄⁺ (DNRA) via GC-MS or isotope ratio MS.
Procedure:
- Slurry Preparation: Under N₂ atmosphere, homogenize sediment with anoxic, artificial seawater (1:2 w/v).
- Labeling: Add ¹⁵NO₃⁻ (98 atm%, final conc. 100 μM) to slurry batches.
- Incubation: Incubate in sealed, N₂-flushed vials in the dark at in situ temperature. Sacrifice replicates over a time series (e.g., 0, 2, 4, 8, 24 h).
- Termination & Analysis:
- For ¹⁵NH₄⁺ (DNRA): Terminate with 2M KCl. Extract ammonium via diffusion onto acidified filter disks. Analyze ¹⁵N/¹⁴N ratio via IRMS.
- For ²⁹N₂/³⁰N₂ (Denitrification): Inject headspace sample to GC-MS for N₂ isotopologue analysis.
- Calculation: Calculate DNRA rate from linear increase in ¹⁵NH₄⁺ pool size over time.
Protocol: Targeted Metaproteomics for Enzyme Detection
Objective: Confirm expression of key pathway enzymes (e.g., DsrAB, NrfA, PFOR) in Marinisomatota-enriched samples. Principle: LC-MS/MS analysis of trypsin-digested proteins, matched to a database containing Marinisomatota genomes.
Procedure:
- Protein Extraction: Lyse cells in sediment/community pellet using bead-beating in SDS buffer. Precipitate proteins with acetone/TCA.
- Digestion: Redissolve, reduce, alkylate, and digest with trypsin.
- LC-MS/MS: Separate peptides on a C18 nano-column; analyze by tandem MS (high-resolution).
- Database Search: Search MS/MS spectra against a custom database of predicted Marinisomatota proteins.
- Validation: Require ≥2 unique peptides per protein, FDR <1%. Quantify by label-free intensity.
The Scientist's Toolkit: Research Reagent Solutions
Table 3: Essential Reagents for Pathway Analysis in Sediment Microbiology
| Item | Function/Application | Example Product/Catalog |
|---|---|---|
| Sodium ¹⁵N-Nitrate (98%+) | Stable isotope tracer for quantifying DNRA and denitrification pathways. | Sigma-Aldrich, ³⁶⁷⁶⁸⁶ |
| Anoxic Serum Vials (Butyl Rubber Septa) | Maintain strict anoxia for incubations of sensitive anaerobic processes. | Chemglass, CG-4900 series |
| Artificial Seawater Base (Anoxic) | Provides consistent ionic background for slurry experiments without carbon/nitrogen. | ATCC Marine Artifical Sea Water |
| cOmplete, EDTA-free Protease Inhibitor | Preserves native protein integrity during extraction for metaproteomics. | Roche, ⁰⁵⁰⁶⁸⁹⁸⁹⁰⁰¹ |
| Pierce Trypsin Protease, MS-grade | Highly specific digestion of extracted proteins for LC-MS/MS peptide analysis. | Thermo Scientific, ⁹⁰⁰⁵⁸ |
| DsrAB-targeted qPCR Primers | Quantify gene abundance of dissimilatory sulfite reductase in community DNA. | Primer sets from Lueders et al., ²⁰⁰⁴, FEMS Microbiol Ecol. |
| Anti-NrfA Polyclonal Antibody | Detect and localize the cytochrome c nitrite reductase via immunofluorescence (FISH-MIC). | Custom order based on conserved regions. |
| Sodium Molybdate (Na₂MoO₄) | Specific inhibitor of sulfate reduction; used to check metabolic coupling. | Sigma-Aldrich, ³³¹⁰⁸⁸ |
This whitepaper provides an in-depth technical analysis of microbial stress adaptation mechanisms, specifically addressing osmotic pressure, low temperature, and oligotrophic conditions. The findings are framed within the context of advancing the broader thesis on the ecological role of the candidate phylum Marinisomatota in global biogeochemical cycling. Understanding these physiological adaptations is crucial for modeling Marinisomatota's contribution to carbon, nitrogen, and sulfur fluxes in marine environments, and for identifying novel bioactive compounds with biotechnological and pharmaceutical potential.
Mechanisms of Adaptation
Osmotic Pressure (Salinity Stress)
Microbes regulate intracellular osmotic potential through the synthesis or uptake of compatible solutes (osmolytes). Key pathways involve transcriptional control of transporters and biosynthesis enzymes.
Table 1: Major Compatible Solutes and Their Functions
| Compatible Solute | Class | Key Function | Example Producing Organism |
|---|---|---|---|
| Glycine betaine | Quaternary amine | Osmoprotectant, enzyme stabilizer | E. coli (uptake), Actinobacteria |
| Ectoine | Cyclic amino acid | Hydrotrope, protects macromolecules | Halomonas elongata |
| Proline | Amino acid | Osmolyte, reactive oxygen species scavenger | Bacillus subtilis |
| Trehalose | Disaccharide | Membrane and protein stabilization | Sinorhizobium meliloti |
Detailed Experimental Protocol: Quantifying Osmolyte Accumulation via HPLC
- Culture & Stress: Grow bacterial culture to mid-log phase. Induce stress by adding concentrated NaCl to desired final concentration (e.g., 0.5M). Incubate for a defined period (e.g., 2 hours).
- Extraction: Harvest cells by centrifugation (10,000 x g, 10 min, 4°C). Rapidly wash pellet with isotonic, cold buffer. Extract osmolytes by resuspending in 80% (v/v) ethanol and incubating at 80°C for 30 min. Centrifuge to remove debris.
- Analysis: Dry supernatant under nitrogen gas. Reconstitute in HPLC-grade water. Analyze using a Rezex ROA-Organic Acid H+ column with isocratic elution (5 mM H2SO4). Detect via refractive index detector.
- Quantification: Compare peak areas to standard curves of pure osmolyte standards.
Diagram 1: Osmotic stress signal transduction
Low Temperature (Psychrophily)
Adaptations include modifications to membrane lipid composition, synthesis of cold shock proteins (Csps), and expression of cold-active enzymes with high catalytic efficiency at low temperatures.
Table 2: Key Low-Temperature Adaptive Traits
| Trait | Molecular Manifestation | Physiological Outcome |
|---|---|---|
| Membrane Fluidity | Increased unsaturated/short-chain fatty acids; Incorporation of polyunsaturated fatty acids (PUFAs) | Maintains membrane fluidity and transport |
| Protein Flexibility | Reduced proline/arginine content; Increased glycine; Fewer ionic bonds; Surface loop modifications | Sustains enzyme activity at low temperatures |
| Cold Shock Response | Induction of RNA chaperones (e.g., CspA family), DEAD-box RNA helicases | Prevents RNA secondary structure stabilization, ensures translation |
| Antifreeze Proteins | Production of ice-binding proteins (IBPs) | Inhibits ice crystal growth, prevents membrane damage |
Detailed Experimental Protocol: Membrane Fatty Acid Analysis (GC-MS)
- Lipid Extraction: Harvest cold-acclimated cells (4°C growth). Pellet and lyophilize. Weigh dry biomass. Perform Bligh-Dyer extraction using chloroform:methanol:PBS (1:2:0.8 v/v).
- Transesterification: Add internal standard (e.g., C17:0 methyl ester). Saponify lipids with NaOH in methanol. Methylate fatty acids using BF3 in methanol.
- Analysis: Extract Fatty Acid Methyl Esters (FAMEs) with hexane. Analyze by Gas Chromatography-Mass Spectrometry (GC-MS) using a polar column (e.g., DB-WAX). Temperature gradient: 50°C to 230°C at 4°C/min.
- Identification: Identify peaks by comparison to retention times and mass spectra of commercial FAME standards. Quantify relative to internal standard.
Oligotrophic (Nutrient-Limited) Conditions
Strategies include high-affinity uptake systems, substrate scavenging via exoenzymes, ultramicrobacterial cell size, and metabolic dormancy.
Table 3: Oligotrophic Adaptation Strategies
| Strategy | Key Genes/Proteins | Functional Role |
|---|---|---|
| High-Affinity Transport | phnD, pstS (P-binding), amtB (ammonium) | Scavenges substrates at nanomolar concentrations |
| Exoenzyme Production | Alkaline phosphatase (phoA), Proteases, Lipases | Liberates P, C, N from organic polymers |
| Cell Size Reduction | Genes regulating cell division (e.g., ftsZ) | Increases surface-area-to-volume ratio |
| Starvation Response | RpoS (σ factor), (p)ppGpp alarmone | Induces general stress resistance and dormancy |
Diagram 2: Oligotrophic stress response network
The Scientist's Toolkit: Research Reagent Solutions
Table 4: Essential Research Reagents for Stress Adaptation Studies
| Reagent/Material | Function in Research | Example Use Case |
|---|---|---|
| Artificial Seawater (ASW) Media | Provides controlled ionic matrix for marine microbes; allows precise manipulation of salinity. | Culturing Marinisomatota relatives; osmotic shock experiments. |
| Compatible Solute Standards (Ectoine, Glycine Betaine, Trehalose) | HPLC quantification standards for intracellular osmolyte pools. | Measuring osmolyte accumulation in response to salinity. |
| Fatty Acid Methyl Ester (FAME) Mix | GC-MS reference standard for identifying and quantifying membrane lipids. | Profiling membrane fluidity adaptations in psychrophiles. |
| p-Nitrophenyl Phosphate (pNPP) | Chromogenic substrate for alkaline phosphatase activity assay. | Measuring phosphate-scavenging capability in oligotrophic conditions. |
| SYPRO Ruby Protein Gel Stain | Fluorescent stain for detecting low-abundance proteins in cold-adapted enzyme purification. | Visualizing protein bands after PAGE of psychrophilic cell lysates. |
| RNAlater Stabilization Solution | Preserves RNA integrity immediately upon sampling for transcriptomics. | Studying cold-shock or starvation-induced gene expression changes in field samples. |
| HPLC-Grade Solvents (Methanol, Acetonitrile, Water) | Essential for high-sensitivity analytical separations (HPLC, LC-MS). | Metabolite profiling of stress responses. |
| Defined Minimal Oligotrophic Medium | Low-nutrient medium for simulating oligotrophic conditions in the lab. | Enriching and studying ultramicrobacterial adaptations. |
Implications forMarinisomatotaResearch & Drug Development
The elucidated mechanisms provide a framework for investigating Marinisomatota's survival in the marine water column and sediments. Their likely possession of high-affinity transporters and novel osmolytes directly impacts models of carbon sequestration and nitrogen cycling. For drug development, the unique enzymes (e.g., cold-active, salt-tolerant) and bioactive osmolytes (e.g., novel ectoine analogs) from Marinisomatota represent promising leads for stabilizers, cryoprotectants, and treatments for protein-aggregation diseases.
Decoding Marinomonas Metabolism: Analytical Techniques and Biotechnological Applications
Within the phylum Marinisomatota, organisms play critical but understudied roles in marine and host-associated biogeochemical cycles. These bacteria are implicated in sulfur metabolism, carbon turnover, and symbiotic interactions, making them targets for both ecological research and biodiscovery. Successful cultivation is the primary bottleneck. This guide provides a technical framework for formulating media and optimizing growth conditions to isolate and maintain diverse Marinisomatota strains, thereby enabling downstream research into their ecological functions and bioactive compound potential.
Foundational Media Formulation Principles
Cultivation must replicate the native physicochemical niche. Marinisomatota are primarily marine, requiring specific ion balances.
Table 1: Base Artificial Seawater (ASW) Formulation
| Component | Concentration (g/L) | Function & Notes |
|---|---|---|
| NaCl | 23.5 | Maintains osmotic balance. |
| MgCl₂·6H₂O | 10.6 | Essential cofactor for enzymes. |
| Na₂SO₄ | 3.9 | Sulfur source for sulfur-oxidizing lineages. |
| CaCl₂·2H₂O | 2.9 | Cell signaling and structural roles. |
| KCl | 0.66 | Ionic balance and membrane potential. |
| NaHCO₃ | 0.2 | Carbon source/buffer for autotrophs. |
| KBr | 0.1 | Trace element, mimics seawater. |
| SrCl₂·6H₂O | 0.04 | Trace element, mimics seawater. |
| H₃BO₃ | 0.03 | Trace element, mimics seawater. |
| NaF | 0.003 | Trace element, mimics seawater. |
| TRIS or PIPES Buffer | 1-10 mM | Maintains pH 7.0-7.8. Adjust based on target isolate habitat. |
Carbon, Nitrogen, and Energy Source Optimization
Nutritional strategies within Marinisomatota are diverse, spanning chemolithoautotrophy to organotrophy.
Table 2: Nutritional Amendment Strategies for Different Trophic Modes
| Trophic Mode | Energy Source | Carbon Source | Representative Amendment (Final Concentration) | Target Marinisomatota Clade |
|---|---|---|---|---|
| Chemolithoautotrophic | Reduced sulfur (S²⁻, S⁰) | CO₂/HCO₃⁻ | Na₂S·9H₂O (0.5-2 mM), Na₂S₂O₃ (1-5 mM) | Sulfur-oxidizing symbionts. |
| Chemoheterotrophic | Organic carbon | Organic carbon | Pyruvate, Acetate, Yeast Extract (0.1-0.5%) | Free-living marine isolates. |
| Mixotrophic | Both organic & inorganic | Both CO₂ & organic | Thiosulfate (2 mM) + Acetate (0.05%) | Versatile free-living groups. |
| Oligotrophic | Trace organics | Trace organics | Diluted R2A base (1/10 strength) in ASW | Previously uncultivated lineages. |
Critical Growth Parameter Optimization
Systematic manipulation of physical parameters is essential.
Table 3: Optimized Growth Condition Ranges
| Parameter | Typical Optimal Range | Special Considerations | Protocol for Testing |
|---|---|---|---|
| Temperature | 4°C - 25°C (Psychro-/Mesophilic) | Deep-sea strains require low T. Use gradient PCR block. | Inoculate triplicate broth tubes; incubate across gradient (4°, 10°, 15°, 20°, 25°C) for 4 weeks. |
| pH | 6.5 - 8.0 | Use biological buffers (PIPES, TRIS, HEPES). | Prepare media buffered at 0.5 pH unit intervals. Monitor with sterile pH probe post-incubation. |
| Oxygen Tension | Microaerobic to Anoxic | Many are microaerophilic symbionts. Use gas jars. | Use AnaeroGen sachets or establish a N₂:CO₂ (99:1) atmosphere in sealed tubes. |
| Pressure | 0.1 - 20 MPa | For piezophiles; requires specialized equipment. | Use pressurized bioreactors or serial dilution in anaerobic pressure tubes (Balch tubes). |
| Salinity | 20 - 40 ppt (seawater) | Some host-associated strains require reduced salinity. | Adjust NaCl concentration in ASW base; test from 10-50 ppt. |
Detailed Experimental Protocols
Protocol 1: High-Throughput Condition Screening in 96-Well Plates
- Objective: To efficiently test multiple carbon/nitrogen source combinations.
- Materials: Sterile 96-well plates, ASW base, filter-sterilized carbon/nitrogen stocks, anaerobic chamber (if required), plate reader.
- Method:
- Dispense 180 µL of sterile, reduced (if needed) ASW base into each well.
- Add 20 µL of different filter-sterilized carbon/nitrogen sources from stock solutions to create desired final concentrations (e.g., 0.05% w/v).
- Inoculate each well with 10 µL of a standardized, washed cell suspension from a pre-culture or environmental sample.
- Seal plate with a breathable membrane or within an anaerobic bag.
- Incubate under target conditions (e.g., 15°C, microaerobic).
- Measure optical density at 600 nm (OD₆₀₀) twice weekly for 4-8 weeks.
Protocol 2: Dilution-to-Extinction Cultivation for Fastidious Isolates
- Objective: To isolate slow-growing strains without competition.
- Materials: Sterile 48-well plates or cryotubes, rich but dilute medium (e.g., ASW + 0.001% yeast extract), environmental sample.
- Method:
- Filter and serially dilute (10⁻¹ to 10⁻⁶) a environmental sample (seawater, tissue homogenate) in sterile ASW.
- Dispense the dilutions into multiple wells or tubes containing 1-2 mL of low-nutrient medium.
- Incubate for 3-6 months without disturbance.
- Screen for growth visually or via sensitive OD measurements. Positive wells at the highest dilution are likely clonal.
Signaling and Metabolic Pathways in Cultivation Response
Understanding key pathways informs media design. A common challenge is overcoming dormancy triggered by poor nutrient conditions.
Title: Overcoming Dormancy in Marinisomatota
The Scientist's Toolkit: Research Reagent Solutions
Table 4: Essential Reagents for Cultivation of Marinisomatota
| Item | Function & Rationale | Example Product/Specification |
|---|---|---|
| Artificial Seawater Salts | Provides essential ions and osmotic stability. Must be reagent grade. | Sigma Sea Salts or individual salts (NaCl, MgCl₂, etc.) for custom formulation. |
| Biological Buffers (PIPES/TRIS) | Maintains pH in seawater medium without complexing essential metals. | 1M PIPES, pH 6.8, sterile-filtered. |
| Reducing Agents (Cysteine-HCl, Na₂S) | Creates low-Eh conditions for microaerophilic/anaerobic strains. | Prepare 0.2 M Cysteine-HCl·H₂O stock, anaerobically, pH adjusted. |
| Trace Element Solution SL-10 | Supplies vitamins and metals (Fe, Co, Ni, Zn, etc.) for enzyme function. | Filter-sterilized anoxic stock. Contains EDTA-metal complexes. |
| Vitamin Solution (e.g., DSMZ 141) | Supplies B-vitamins and other cofactors auxotrophic strains require. | Filter-sterilized stock, store at -20°C, add post-autoclave. |
| Gellan Gum | Solidifying agent superior to agar for marine bacteria; less inhibitory. | Gelrite or Phytagel, use with cation supplement (Mg²⁺/Ca²⁺). |
| Anaerobic Indicator (Resazurin) | Visual redox indicator (pink=oxidized, colorless=reduced). | 0.1% (w/v) aqueous stock solution, add 1 mL/L medium. |
| Cyclic AMP (cAMP) | Potential signaling molecule to stimulate exit from dormancy. | Prepare 10 mM stock in buffer, filter sterilize. Test at 1-100 µM. |
The systematic formulation of media and optimization of growth conditions outlined here are not merely microbiological exercises but are fundamental to elucidating the ecological roles of Marinisomatota. Successful cultivation enables direct experimentation on nutrient flux, metabolite production, and symbiotic interactions, providing ground-truth data for 'omics-based predictions. This approach is indispensable for linking genetic potential to biogeochemical function and unlocking their potential in drug discovery.
This technical guide is framed within a broader thesis investigating the ecological role of the candidate phylum Marinisomatota in marine biogeochemical cycling. Recent research suggests this phylum, prevalent in deep-sea sediments and oxygen minimum zones, may play a significant, yet uncharacterized, role in carbon and sulfur transformations. A multi-omics approach is essential to move from genomic potential to validated functional activity, enabling the discovery of novel metabolic pathways pertinent to global nutrient fluxes and potential biotechnological applications.
The sequential integration of metagenomics, metatranscriptomics, and metaproteomics provides a layered understanding of microbial community function, from genetic potential to expressed activity and translated protein machinery.
Table 1: Core Multi-Omics Approaches for Microbial Pathway Discovery
| Omics Layer | Target Molecule | Primary Output | Key Strength | Limitation | Application in Marinisomatota Research |
|---|---|---|---|---|---|
| Metagenomics | Community DNA | Catalog of genes/pathways (potential function) | Unbiased discovery of genetic potential; identifies novel taxa | Does not indicate active expression | Reconstruct Marinisomatota genomes from complex sediment; predict C/S cycling genes |
| Metatranscriptomics | Community RNA (mRNA) | Profile of expressed genes (active function) | Snapshot of community response & active pathways | mRNA turnover rapid; may not correlate with protein abundance | Identify genes expressed by Marinisomatota in situ under varying O₂ conditions |
| Metaproteomics | Community Proteins | Identification & quantification of proteins (enacted function) | Direct evidence of catalytic machinery; post-translational modifications | Technically challenging; database-dependent | Confirm active enzymes in C/S pathways; quantify their abundance |
Detailed Experimental Protocols
Integrated Multi-Omics Workflow for Sediment Samples
Sample Collection & Preservation:
- Collection: Deep-sea sediment cores are obtained via rosette sampler or box corer. Subsamples for omics are taken anaerobically using cut-off syringes.
- Preservation:
- Metagenomics/DNA: Preserve in DNA/RNA Shield or snap-freeze in liquid N₂.
- Metatranscriptomics/RNA: Immediately immerse in RNAlater or flash-freeze in liquid N₂.
- Metaproteomics/Proteins: Snap-freeze directly or preserve in specific protein stabilization buffers (e.g., with protease inhibitors).
Protocol 3.1.1: Metagenomic Sequencing (Illumina Platform)
- Nucleic Acid Co-extraction: Use a commercial kit (e.g., Qiagen DNeasy PowerSoil Pro Kit) optimized for humic substance-rich sediments.
- DNA Quality Check: Assess purity (A260/A280 ~1.8) via Nanodrop, fragment size via agarose gel, and quantity via Qubit dsDNA HS Assay.
- Library Preparation: Utilize Illumina DNA Prep kit with 350 bp insert size. Include negative extraction controls.
- Sequencing: Perform paired-end sequencing (2x150 bp) on an Illumina NovaSeq 6000 to a target depth of 20-40 Gbp per sample.
- Bioinformatics: Process reads with FastQC and Trimmomatic. Assemble using MEGAHIT or metaSPAdes. Binning is performed with MetaBAT2, yielding Metagenome-Assembled Genomes (MAGs). Marinisomatota MAGs are identified using GTDB-Tk. Genes are predicted with Prodigal and annotated via KEGG, EggNOG, and dbCAN2 databases.
Protocol 3.1.2: Metatranscriptomic Analysis
- RNA Extraction & Enrichment: Use the RNeasy PowerSoil Total RNA Kit. Enrich mRNA from total RNA using the MICROBExpress Bacterial mRNA Enrichment Kit to deplete rRNA.
- Library Preparation & Sequencing: Construct libraries with the ScriptSeq v2 RNA-Seq Library Prep Kit. Sequence on Illumina platform (2x150 bp, ~50-100 M read pairs).
- Bioinformatics: Trim adapters and filter rRNA reads with SortMeRNA. Map reads to the Marinisomatota MAGs using Bowtie2 or directly assemble with Trinity. Quantify expression as transcripts per million (TPM) using Salmon.
Protocol 3.1.3: Metaproteomic Profiling (LC-MS/MS)
- Protein Extraction: Lyse cells via bead-beating in SDS-based lysis buffer. Precipitate proteins using the methanol/chloroform method.
- Digestion & Clean-up: Reductively alkylate and digest with trypsin/Lys-C overnight. Desalt peptides using C18 StageTips.
- LC-MS/MS Analysis: Separate peptides on a 50 cm C18 column with a 90-min gradient on a nanoflow UHPLC. Analyze eluents on a Q-Exactive HF or Orbitrap Eclipse mass spectrometer in data-dependent acquisition mode.
- Database Search & Quantification: Search MS/MS spectra against a database of predicted proteins from Marinisomatota MAGs and related taxa using MaxQuant or Proteome Discoverer with a 1% FDR. Use label-free quantification (LFQ) intensities for relative protein abundance.
Table 2: Representative Quantitative Data from a Simulated Marinisomatota Study
| Omics Data Type | Metric | Sample A (Oxic Zone) | Sample B (Anoxic Zone) | Interpretation |
|---|---|---|---|---|
| Metagenomics | Relative Abundance of Marinisomatota | 2.1% | 8.7% | Phylum thrives in anoxic conditions |
| Metagenomics | Completeness/Contamination of key MAG (MAG-001) | 92% / 1.5% | 89% / 2.1% | High-quality draft genome obtained |
| Metatranscriptomics | TPM of dsrA gene (sulfite reduction) in MAG-001 | 15 | 1,250 | Strong transcriptional upregulation of sulfate reduction in anoxia |
| Metaproteomics | LFQ Intensity of DsrA protein | Not Detected | 4.2 x 10⁵ | Protein is only produced and detected in anoxic zone |
| Metaproteomics | Enzyme Coverage for predicted Glycolysis pathway | 45% | 68% | Higher pathway completion at protein level in anoxia |
Visualization of Workflows and Pathways
Title: Integrated Multi-Omics Workflow for Pathway Discovery
Title: Hypothesized Sulfate Reduction Pathway in Marinisomatota with Omics Evidence
The Scientist's Toolkit: Key Research Reagent Solutions
Table 3: Essential Reagents and Materials for Multi-Omics Studies of Uncultured Phyla
| Item (Supplier Example) | Category | Function in Workflow |
|---|---|---|
| DNA/RNA Shield (Zymo Research) | Sample Preservation | Stabilizes nucleic acids in situ, preventing degradation during transport/storage; critical for accurate metatranscriptomics. |
| RNeasy PowerSoil Total RNA Kit (Qiagen) | Nucleic Acid Extraction | Simultaneously co-extracts DNA and RNA from difficult, inhibitor-rich samples like marine sediment. |
| MICROBExpress Kit (Thermo Fisher) | mRNA Enrichment | Depletes abundant rRNA from total RNA samples, dramatically increasing coverage of mRNA for transcriptomics. |
| Nextera XT DNA Library Prep Kit (Illumina) | Library Preparation | Prepares sequence-ready, indexed libraries from low-input DNA for metagenomic sequencing. |
| Trypsin/Lys-C, Mass Spec Grade (Promega) | Protein Digestion | Highly purified protease for specific, reproducible digestion of protein extracts into peptides for LC-MS/MS. |
| S-Trap Micro Spin Columns (Protifi) | Protein Clean-up/Digestion | Efficiently captures proteins, removes detergents (SDS), and enables efficient on-column digestion for metaproteomics. |
| Pierce Quantitative Colorimetric Peptide Assay (Thermo Fisher) | Peptide Quantification | Accurate pre-MS quantification of peptide yield, essential for loading equal amounts in LC-MS/MS. |
| MetaGeneMark | Bioinformatics Tool | Gene prediction algorithm trained for prokaryotic genomes, crucial for annotating novel MAGs from uncultured phyla. |
| MaxQuant | Bioinformatics Software | Integrates MS/MS search (via Andromeda) and label-free quantification for high-throughput metaproteomic data analysis. |
This technical guide details advanced methodologies for tracing microbial activity within elemental cycles, framed explicitly within the broader thesis context of Marinisomatota ecological role biogeochemical cycling research. Marinisomatota (formerly SAR406) is a phylogenetically distinct, globally distributed bacterial clade prevalent in oceanic oxygen minimum zones and mesopelagic regions. Their metabolic repertoire, inferred from metagenomic-assembled genomes, suggests significant potential in sulfur, nitrogen, and carbon cycling, particularly through dissimilatory nitrate reduction to ammonium (DNRA) and sulfur oxidation. However, in situ activity and quantitative contribution to biogeochemical fluxes remain poorly constrained. This whitepaper provides a framework for employing Stable Isotope Probing (SIP) to link Marinisomatota phylogeny to specific metabolic functions, coupled with microsensor measurements to quantify the resulting chemical gradients at relevant spatial scales.
Core Methodologies & Protocols
Stable Isotope Probing (SIP) forMarinisomatota
SIP enables the identification of active microorganisms that assimilate specific isotope-labeled substrates into their biomass (e.g., DNA, RNA, lipids).
Protocol 2.1.1: DNA-SIP with ¹³C- or ¹⁵N-Labeled Substrates for Water Column Studies
- Sample Collection & Incubation: Collect seawater via Niskin bottles from target depths (e.g., oxycline). For Marinisomatota, likely substrates include:
¹³C-Bicarbonate (for autotrophic carbon fixation)¹³C/¹⁵N-Amino acids (for osmotrophic assimilation)¹⁵N-Nitrate (¹⁵NO₃⁻) (to trace DNRA pathway)
- In-situ Mimic Incubation: Dispense samples into gas-tight, acid-washed bottles. Add labeled substrate to a final concentration typical of the environment (e.g., 10-100 µM for nitrate). Include
¹²C/¹⁴Ncontrols. Incubate in the dark at in situ temperature for 2-14 days. - Biomass Harvesting & DNA Extraction: Filter incubation water onto 0.22 µm polyethersulfone filters. Extract total community DNA using a protocol optimized for marine bacteria (e.g., phenol-chloroform with enzymatic lysis).
- Density Gradient Ultracentrifugation: Mix DNA with gradient medium (e.g., cesium chloride, CsCl) to a final density of ~1.725 g/mL. Centrifuge in a ultracentrifuge (e.g., Beckman Coulter Optima XE) with a vertical rotor at 177,000 x g, 20°C for 40-48 hours.
- Fractionation & Quantification: Fractionate the gradient by density displacement. Measure density of each fraction (e.g., refractometrically) and quantify DNA (e.g., fluorometrically).
- Molecular Analysis: Perform 16S rRNA gene amplicon sequencing (using primers covering Marinisomatota, e.g., 515F/806R) and/or metagenomic sequencing on "heavy" (
¹³C/¹⁵N-enriched) and "light" (control) fractions. Identify taxa with elevated relative abundance in heavy fractions.
Protocol 2.1.2: NanoSIMS-coupled FISH (FISH-SIMS) for Single-Cell Activity
- Sample Fixation & Hybridization: Fix samples with paraformaldehyde. Apply Catalyzed Reporter Deposition Fluorescence In Situ Hybridization (CARD-FISH) using a Marinisomatota-specific oligonucleotide probe (e.g., designed using ARB software).
- Isotope Incubation: Prior to fixation, incubate with a labeled substrate (e.g.,
¹³C-bicarbonate for 6-24 hours). - NanoSIMS Analysis: Transfer hybridized cells to gold-coated slides. Analyze with a Nano Secondary Ion Mass Spectrometer (NanoSIMS). Measure ions (e.g.,
¹²C⁻,¹³C⁻,¹²C¹⁴N⁻,¹²C¹⁵N⁻) to calculate isotope enrichment (¹³C/(¹²C+¹³C)) at the single-cell level on probe-identified Marinisomatota cells.
Microsensor Measurements forIn SituGradients
Microsensors measure chemical concentrations at high spatial resolution (µm to mm), critical for defining microenvironments.
Protocol 2.2.1: Profiling Oxygen, Nitrate, and Sulfide Gradients
- Sensor Calibration:
- O₂ (Clark-type): Calibrate at 0% (anoxic sodium ascorbate) and 100% (air-saturated seawater) saturation.
- NO₃⁻ (LIX): Calibrate in a logarithmic series of standard solutions (e.g., 1, 10, 100, 1000 µM) in artificial seawater.
- H₂S (Amperometric): Calibrate in standard sulfide solutions (e.g., 0, 10, 50, 100 µM) stabilized with antioxidant buffer.
- Sample Setup: Use intact sediment cores or simulated oxygen minimum zone (OMZ) water column setups in a temperature-controlled laboratory.
- Profiling: Mount sensors on a motorized micromanipulator. Advance sensor tip in 50-200 µm steps, allowing signal stabilization at each point. Record voltage output.
- Data Conversion & Flux Calculation: Convert voltage to concentration using calibration curves. Calculate diffusive fluxes (F) across interfaces using Fick's first law:
F = -ϕ * D₀ * (dC/dx), where ϕ is porosity, D₀ is the diffusion coefficient, anddC/dxis the measured gradient.
Data Presentation: Quantitative Comparisons
Table 1: Key SIP-Derived Metrics for Marinisomatota Activity Assessment
| Metric | Measurement Method | Typical Value/Outcome for Marinisomatota | Interpretation |
|---|---|---|---|
| Atom Percent Excess (APE) | Isotope Ratio Mass Spectrometry (IRMS) of heavy DNA | >1 APE ¹³C or ¹⁵N in heavy fraction |
Significant assimilation of labeled substrate. |
| Enrichment Factor (EF) | (¹³C/¹²C)sample / (¹³C/¹²C)control |
>2.0 indicates active incorporation. | Degree of isotope enrichment relative to background. |
| Relative Abundance Shift | 16S rRNA seq. of Heavy vs. Light DNA fractions | Increase in Marinisomatota sequences in heavy fraction. | Phylogenetic identification of active assimilators. |
Single-Cell ¹³C Fraction |
NanoSIMS on FISH-identified cells | 0.5-5% above natural abundance (1.1%). | Direct measure of anabolic activity in target phylum. |
Table 2: Characteristic Microsensor Gradients in Marinisomatota-Relevant Niches
| Niche | Sensor Type | Typical Gradient (Approx.) | Inferred Process & Marinisomatota Potential Role |
|---|---|---|---|
| OMZ Upper Boundary | O₂, NO₃⁻ | O₂: 100 → 0 µM over 1-10 m; NO₃⁻: peak at anoxia. | Chemolithoautotrophy coupling NO₂⁻/S⁰ oxidation to NO₃⁻ reduction. |
| Sediment-Water Interface (OMZ) | O₂, H₂S | O₂: 0 → 100 µM over 0.5-2 mm; H₂S: 0 → 50 µM over 1-5 mm. | Sulfide oxidation coupled to DNRA or denitrification. |
| Marine Snow Particle | O₂, pH | O₂: Anoxic core; pH: acidic inside. | Anaerobic metabolism (fermentation, DNRA) within particles. |
Visualizations: Pathways & Workflows
Diagram 1: DNA-SIP Experimental Workflow (78 chars)
Diagram 2: Proposed Marinisomatota DNRA & S Oxidation (86 chars)
The Scientist's Toolkit: Research Reagent Solutions
Table 3: Essential Materials for SIP & Microsensor Studies on Marinisomatota
| Item | Function/Application | Key Considerations for Marinisomatota Research |
|---|---|---|
¹³C-Sodium Bicarbonate |
Substrate for tracing autotrophic carbon fixation. | Use low concentration (µM) to mimic natural DIC levels; essential for testing chemoautotrophy. |
¹⁵N-Sodium Nitrate (¹⁵NO₃⁻) |
Substrate for tracing dissimilatory nitrate reduction pathways (e.g., DNRA). | Critical for elucidating Marinisomatota's role in nitrogen retention vs. loss. |
| CsCl (Ultra Pure Grade) | Density medium for SIP ultracentrifugation. | Purity is essential for gradient stability and preventing DNA inhibition. |
| Marinisomatota-specific FISH Probe | Phylogenetic identification of cells for NanoSIMS or CARD-FISH. | Must be designed against current 16S rRNA database; requires CARD-FISH for signal amplification. |
| Clark-type O₂ Microsensor | High-resolution measurement of oxygen gradients. | Tip diameter <20 µm for fine-scale OMZ boundary profiling; fast response time needed. |
| LIX NO₃⁻ Microsensor | In situ nitrate measurement at µM sensitivity. | Calibration in ionic strength matching sample; subject to anion interference (e.g., Cl⁻). |
| Amperometric H₂S Microsensor | Detection of hydrogen sulfide at sub-µM levels. | Required for studying sulfur cycling in sediments or sulfidic OMZ interfaces. |
| Polyethersulfone (PES) Filters, 0.22 µm | Biomass collection for DNA-SIP. | Low DNA binding; compatible with enzymatic lysis steps. |
| PCR Inhibitor Removal Kit | Clean-up of environmental DNA extracts prior to SIP centrifugation. | Humic substances in marine samples can inhibit CsCl gradient formation and PCR. |
| Artificial Seawater Base (Salt Mix) | For consistent calibration of chemical microsensors. | Must match the ionic strength and major ion composition of the study site. |
Within the intricate framework of global biogeochemical cycles, the candidate phylum Marinisomatota (formerly SAR406) has emerged as a critical, yet underexplored, player. Ubiquitous in the deep ocean’s dark, oxygen-deficient zones, these bacteria are hypothesized to be metabolic specialists in the breakdown of complex organic matter and the cycling of nitrogen. This whitepaper posits that targeted screening for hydrolytic, oxidoreductase, and denitrification enzymes from Marinisomatota metagenomes is not merely an exercise in enzyme discovery but a direct probe into their ecological function. The novel enzymes uncovered promise not only to elucidate carbon sequestration and nitrogen loss pathways in the marine biosphere but also to provide unprecedented biocatalysts for industrial applications and drug discovery pipelines, where extremophilic properties such as high-pressure and low-temperature activity are paramount.
Core Screening Methodologies
Functional Metagenomic Screening
This primary, sequence-agnostic approach directly links genetic potential to observable activity.
Protocol: Construction and Screening of Fosmid/Escherichia coli Libraries
- DNA Extraction: Collect marine particulate matter from omics-defined Marinisomatota-enriched depths (e.g., 500-1000m, oxygen minimum zones). Use gentle lysis (e.g., via enzymatic and detergent-based methods) to preserve high-molecular-weight DNA.
- Vector Preparation: Prepare and dephosphorylate fosmid vectors (e.g., pCC2FOS).
- End-Repair & Size Selection: End-repair the extracted DNA and perform gel electrophoresis to size-select fragments of 30-45 kb.
- Ligation & Packaging: Ligate size-selected DNA into the fosmid vector. Package the ligation product using high-efficiency phage packaging extracts.
- Transduction & Arraying: Transduce E. coli EPI300 cells with the packaged fosmid library. Plate on LB agar containing chloramphenicol (for fosmid selection) and array individual colonies into 384-well microplates containing growth medium with 15% glycerol for long-term storage.
- Activity-Based Screening:
- Hydrolytic Enzymes: Overlay colonies with substrate-impregnated agar: 1% tributyrin for lipases/esterases, 0.5% carboxymethyl cellulose (CMC) for cellulases (stained with Congo red), or 1% chitin azure for chitinases. Halos indicate positive activity.
- Oxidoreductases: Spray colonies with ABTS (2,2'-azino-bis(3-ethylbenzothiazoline-6-sulfonic acid)) or guaiacol solutions. Oxidative activity (e.g., laccases, peroxidases) produces a green or brown precipitate, respectively.
- Denitrification Enzymes (Nitrate Reductase): Grow clones anaerobically in medium with nitrate as the sole terminal electron acceptor. Screen for gas production (N₂) or the accumulation of nitrite (detected via colorimetric Griess assay).
Functional Metagenomic Screening Workflow
Sequence-Centric Homology Screening
This targeted approach leverages conserved sequence motifs to identify putative enzymes from Marinisomatota genomes assembled from metagenomes (MAGs).
Protocol: In silico Identification and Phylogenetic Analysis
- Database Curation: Compile high-quality, non-redundant reference sequences for target enzyme families (e.g., CAZy for hydrolases, PFAM for nitrite reductase
NirK/NirS). - HMMER Search: Build profile Hidden Markov Models (HMMs) from curated multiple sequence alignments. Search against a database of predicted proteins from Marinisomatota MAGs using
hmmsearch(e-value cutoff < 1e-10). - Sequence Retrieval & Alignment: Extract candidate sequences and align them with reference sequences using MAFFT or MUSCLE.
- Phylogenetic Tree Construction: Construct maximum-likelihood trees (e.g., using IQ-TREE) to determine evolutionary relationships and identify novel clades.
- Gene Synthesis & Heterologous Expression: Codon-optimize and synthesize top candidate genes for expression in a suitable host (e.g., E. coli BL21(DE3) for cytosolic enzymes, Pichia pastoris for secreted or glycosylated enzymes). Purify via His-tag affinity chromatography.
High-Throughput Microfluidics & Droplet-Based Screening
For ultra-high-throughput screening of complex metagenomic expression libraries.
Protocol: Single-Cell Encapsulation and Activity Sorting
- Cell Preparation: Induce protein expression in the metagenomic library culture.
- Droplet Generation: Co-encapsulate single E. coli cells, a fluorescent substrate (e.g., fluorescein diphosphate for phosphatases, resorufin acetate for esterases), and growth medium within picoliter-scale water-in-oil droplets using a microfluidic chip.
- Incubation: Incubate the emulsion to allow enzyme expression and substrate conversion.
- FACS Sorting: Flow droplets through a fluorescence-activated cell sorter (FACS). Droplets containing a fluorescent product (signaling enzymatic activity) are deflected and collected.
- Recovery & Identification: Break the collected droplets, recover the single, active clone, and sequence the insert DNA.
Table 1: Representative Yield from Various Screening Strategies
| Screening Method | Target Enzyme Class | Avg. Hit Rate (%) | Avg. Novelty (% Identity to Nearest DB Match) | Key Advantage |
|---|---|---|---|---|
| Functional Metagenomics (Fosmid) | Esterase/Lipase | 0.05 - 0.1 | 45-60% | Uncovers completely novel folds, no sequence bias |
| Sequence-Based (HMM) | Nitrite Reductase (Nir) | 100 (of queried MAGs) | 55-70% | High specificity, fast, covers uncultivable diversity |
| Droplet Microfluidics (FACS) | Phosphatase | 0.5 - 1.0 | 40-55% | Ultra-high throughput (>10⁷ clones/day), minimal resource use |
| Combined Approach | Multiple | N/A | >70% | Maximizes novelty and functional validation |
Table 2: Biochemical Characterization of a NovelMarinisomatota-Derived Esterase (Example)
| Parameter | Value | Conditions/Notes |
|---|---|---|
| Optimal pH | 7.5 - 8.5 | Broad alkaline activity, consistent with deep-sea pelagic zone |
| Optimal Temperature | 15°C | Psychrophilic adaptation (kcat at 4°C is 30% of optimum) |
| Thermostability | T₅₀ = 45°C (30 min) | Rapid inactivation above 50°C |
| Kinetic Constants (p-NP C₄) | Kₘ = 0.8 mM, kcat = 450 s⁻¹ | High catalytic efficiency (kcat/Kₘ = 562.5 mM⁻¹s⁻¹) |
| Inhibitors | PMSF (serine modifier) | Confirms serine hydrolase mechanism |
| Salt Tolerance | >1.5 M NaCl | Retains >80% activity, halotolerant property |
The Scientist's Toolkit: Key Research Reagent Solutions
| Reagent/Material | Function & Rationale |
|---|---|
| CopyControl Fosmid Library Kit | Enables stable maintenance of large (30-45 kb) DNA inserts with inducible copy number control for enhanced yield during sequencing. |
| EPI300-T1R E. coli Strain | Optimized for fosmid propagation; deficient in nucleases and recombination systems to ensure insert stability. |
| Chitin Azure / AZCL-HE-Cellulose | Chromogenic/fluorogenic substrates enabling direct, in-gel or plate-based detection of specific hydrolytic activities. |
| Griess Reagent Kit (Nitrite Detection) | Essential, sensitive colorimetric assay for detecting nitrite produced by nitrate reductase activity in denitrification screens. |
| ABTS (2,2'-Azinobis(3-ethylbenzothiazoline-6-sulfonate)) | Universal chromogenic substrate for oxidoreductases (laccases, peroxidases), producing a soluble green product measurable at 420 nm. |
| Bio-Rad QX200 Droplet Generation Oil | Specialized oil for generating stable, monodisperse water-in-oil emulsions essential for droplet-based microfluidic screening. |
| HMMER Software Suite | Foundational tool for building and searching profile hidden Markov models against custom protein databases. |
| Ni-NTA Superflow Resin | Standard for rapid immobilised-metal affinity chromatography (IMAC) purification of His-tagged recombinant enzymes for characterization. |
Pathway Integration: Linking Enzyme Function to Biogeochemical Models
The discovery of these enzymes allows for the reconstruction of metabolic pathways central to Marinisomatota's ecological role. For instance, the co-occurrence of specific hydrolytic enzymes (e.g., chitinases) with denitrification modules (NapA, NirS, NorB) in a single MAG suggests a coupled metabolic strategy: breaking down complex organic nitrogen to fuel respiratory nitrate reduction.
Hypothesized Marinisomatota C-N Coupling Pathway
Systematic screening for hydrolytic, oxidoreductase, and denitrification enzymes within the Marinisomatota phylum serves as a powerful functional genomics strategy. It directly tests hypotheses regarding their contribution to carbon remineralization and nitrogen loss in the deep ocean. The novel biocatalysts discovered, often exhibiting extremotolerant properties, hold significant potential for applications in green chemistry, bioremediation, and as tools in synthetic biology. Future research must integrate single-cell omics, advanced activity-based protein profiling, and robotic high-throughput screening to fully exploit the enzymatic dark matter encoded by this ecologically vital yet enigmatic phylum.
The phylum Marinisomatota (formerly candidate phylum MARINISOMATOTA) comprises uncultivated, filamentous bacteria predominantly found in marine sediments. Recent metagenomic and biogeochemical cycling research positions them as keystone organisms in benthic nitrogen and sulfur cycling, particularly in the anaerobic oxidation of ammonium (anammox) coupled with sulfur reduction. This unique metabolic repertoire, evolved in competitive benthic niches, is a putative reservoir for novel bioactive secondary metabolites. The ecological pressure to inhibit competitors, communicate, and survive in extreme conditions makes Marinisomatota and similar complex environmental consortia prime targets for bioprospecting. This guide outlines the technical pipeline for translating ecological hypothesis into pharmaceutically relevant compound discovery.
Core Screening Pipeline: From Sample to Lead Compound
The integrated workflow for bioactive compound discovery from environmental samples like those containing Marinisomatota involves sequential filtration steps to identify hits with specific therapeutic potential.
Diagram Title: Bioactive Compound Discovery Workflow
Detailed Experimental Protocols
Culturing & Library Construction for Uncultivated Phyla
Objective: To access the biosynthetic potential of Marinisomatota and associated community members.
Protocol:
- Dilution-to-Extinction Culturing: Prepare anaerobic marine mineral medium mimicking in situ conditions (e.g., with NH₄⁺, S₂O₃²⁻, low organic carbon). Serially dilute sediment slurry to 10⁻⁵–10⁻⁷ in 96-well plates. Incubate in the dark at in situ temperature for 3-6 months. Monitor growth via epifluorescence microscopy.
- Metagenomic Library Construction: Extract total environmental DNA directly from sediment or enrichment cultures using a kit optimized for complex samples (e.g., FastDNA SPIN Kit for Soil). Clone large-insert fragments (30-200 kb) into a fosmid or BAC vector. Transform into E. coli. Screen libraries for phylogenetic markers (16S rRNA) or biosynthetic gene clusters (BGCs) via PCR.
Primary Bioactivity Screening Assays
A. Antimicrobial Screening: Broth Microdilution Assay
- Principle: Determine the Minimum Inhibitory Concentration (MIC) against ESKAPE pathogens and fungal candidates.
- Procedure:
- Prepare Muller-Hinton broth (for bacteria) or RPMI-1640 (for fungi) in a 96-well plate.
- Serially dilute the crude extract or fraction (typically from 256 µg/mL to 1 µg/mL) across the plate rows.
- Inoculate each well with 5 × 10⁵ CFU/mL of standardized microbial inoculum.
- Incubate at 37°C for 16-20 hours. Include growth (microbe only) and sterility (medium only) controls.
- Visual MIC: The lowest concentration that inhibits visible growth. Confirm with resazurin dye (0.015%): blue = no growth, pink/colorless = growth.
B. Anticancer Screening: MTT Cell Viability Assay
- Principle: Measure the reduction of yellow MTT (3-(4,5-dimethylthiazol-2-yl)-2,5-diphenyltetrazolium bromide) to purple formazan by metabolically active cells.
- Procedure:
- Seed adherent cancer cell lines (e.g., HeLa, MCF-7, A549) in a 96-well plate at 5-10 × 10³ cells/well. Incubate for 24 h.
- Treat cells with serially diluted test compounds (e.g., 100 µM to 0.1 µM). Include DMSO vehicle control.
- After 48-72 h, add MTT reagent (0.5 mg/mL final concentration) and incubate for 4 h.
- Carefully aspirate medium, dissolve formed formazan crystals in DMSO (100 µL/well).
- Measure absorbance at 570 nm (reference 630-650 nm). Calculate % viability and IC₅₀.
C. Biosurfactant Screening: Oil Displacement and Surface Tension
- Principle: Assess surface activity by measuring the displacement of oil by an aqueous biosurfactant solution.
- Procedure:
- Oil Displacement Test: Add 40 µL of crude oil to the center of a petri dish filled with distilled water. Gently add 10 µL of cell-free culture supernatant or extract onto the oil slick. Measure the diameter of the clear zone after 1 min. A zone >1 cm indicates surfactant activity.
- Surface Tension Measurement: Use a tensiometer (Du Noüy ring or Wilhelmy plate method). Filter the sample. Measure surface tension of pure water (72.8 mN/m at 20°C) as control, then of the sample. A reduction >10 mN/m indicates strong surfactant activity.
Bioassay-Guided Fractionation (BGF)
- Procedure: Active crude extract is fractionated via preparative-scale normal-phase or reverse-phase HPLC. Each collected fraction is dried, reconstituted, and re-tested in the primary bioassay(s). The active fraction is subjected to further chromatographic steps (e.g., Sephadex LH-20 size exclusion, chiral HPLC) until pure, active compound is obtained. Structure elucidation follows via NMR and LC-HRMS.
Quantitative Data & Hit Criteria
Table 1: Standard Hit Criteria for Primary Bioactivity Screens
| Bioassay Type | Key Metric | Positive Hit Threshold | Reference Standard (Positive Control) |
|---|---|---|---|
| Antimicrobial | Minimum Inhibitory Concentration (MIC) | MIC ≤ 64 µg/mL (crude extract) | Ciprofloxacin (Bacteria): MIC ~0.03-0.5 µg/mL Amphotericin B (Fungi): MIC ~0.12-1 µg/mL |
| Anticancer | Half-Maximal Inhibitory Concentration (IC₅₀) | IC₅₀ ≤ 10 µM (pure compound) IC₅₀ ≤ 20 µg/mL (crude extract) | Doxorubicin: IC₅₀ ~0.01-0.1 µM (varies by cell line) |
| Biosurfactant | Surface Tension Reduction | Reduction ≥ 15 mN/m from water control | Sodium Dodecyl Sulfate (SDS): ~35 mN/m (50% reduction) |
Table 2: Example Screening Data from a Hypothetical Marinisomatota-Enriched Library
| Sample ID | Putative Source | Antimicrobial (vs S. aureus) MIC | Anticancer (vs HeLa) IC₅₀ | Surface Tension (mN/m) | Outcome |
|---|---|---|---|---|---|
| MARI-Enr-07 | Marinisomatota enrichment | 32 µg/mL | 45 µg/mL | 41.2 | Antimicrobial Hit |
| MARI-Fos-112 | Fosmid Clone (BAC) | >256 µg/mL | 12.5 µg/mL | 68.5 | Anticancer Hit |
| MARI-Cul-15 | Co-culture isolate | 128 µg/mL | >100 µg/mL | 29.8 | Biosurfactant Hit |
Signaling Pathways for Mechanism-of-Action Studies
For anticancer hits, preliminary mechanistic screening is crucial. A common early target is the intrinsic apoptosis pathway.
Diagram Title: Intrinsic Apoptosis Pathway for Anticancer MOA
The Scientist's Toolkit: Key Research Reagent Solutions
Table 3: Essential Materials and Reagents for Screening
| Item/Reagent | Function & Application | Example Product/Catalog |
|---|---|---|
| Anaerobic Chamber | Provides O₂-free atmosphere for culturing obligate anaerobes like Marinisomatota. | Coy Laboratory Products Vinyl Anaerobic Chamber |
| FastDNA SPIN Kit for Soil | Optimized for DNA extraction from complex, humic acid-rich environmental samples. | MP Biomedicals, 116560200 |
| CopyControl Fosmid Library Kit | For constructing large-insert metagenomic libraries with inducible copy number. | Lucigen, CCFOS110 |
| Resazurin Sodium Salt | Redox indicator for rapid, colorimetric MIC endpoint determination in antimicrobial assays. | Sigma-Aldrich, R7017 |
| MTT Reagent (Thiazolyl Blue) | Yellow tetrazolium dye reduced to purple formazan by living cells for viability assays. | Sigma-Aldrich, M2128 |
| C11-BODIPY⁵⁸¹/⁵⁹¹ | Fluorescent lipid peroxidation sensor for detecting ferroptosis, an anticancer mechanism. | Thermo Fisher, D3861 |
| Du Noüy Ring Tensiometer | Standard instrument for precise measurement of surface tension of biosurfactant solutions. | Krüss K6, or equivalent |
| Sephadex LH-20 | Size-exclusion chromatography medium for desalting and fractionating organic compounds. | Cytiva, 17003801 |
| C18 Reverse-Phase HPLC Column | Workhorse column for analytical and preparative separation of medium- to non-polar compounds. | Waters XBridge BEH C18, 5µm |
Overcoming Research Hurdles: Challenges in Studying Marinomonas Function and Activity
The phylum Marinisomatota (formerly SAR406) represents a pervasive, yet largely uncultivated, lineage of marine bacteria, playing a hypothesized but poorly constrained role in global biogeochemical cycles. Within this phylum, the genus Marinomonas stands out as a cultivable subgroup, offering a critical genomic and physiological Rosetta Stone for interpreting the metabolic potential of its vast, uncultured relatives. The "Great Plate Count Anomaly"—the chronic discrepancy between microscopic cell counts and colony-forming units—is starkly evident in marine systems, with an estimated >99% of marine prokaryotes, including most Marinisomatota, resisting standard cultivation. This guide details advanced methodologies to bridge this gap, specifically targeting the uncultivated diversity within and related to Marinomonas, thereby illuminating the ecological role of Marinisomatota in carbon, sulfur, and nitrogen cycling.
Table 1: The Cultivation Gap in Marine Bacteria and Marinisomatota
| Parameter | General Marine Bacterioplankton | Phylum Marinisomatota | Cultivated Marinomonas spp. |
|---|---|---|---|
| Estimated Global Abundance | ~10^29 cells | 1-15% of community (ocean basin dependent) | <0.1% of total community |
| Typical Culturability (%) | <1% (often ~0.001-0.1%) | <0.01% (largely uncultivated) | Variable; model species are 100% cultivable |
| Known Genomes (Public DBs) | >1,000,000 (Metagenome-Assembled) | ~5,000 (MAGs) | ~150 (Isolate Genomes) |
| Average Genome Size (Mbp) | 3.0 - 4.5 | 2.8 - 3.5 (streamlined) | 4.5 - 5.5 |
| Key Predicted Metabolisms | Heterotrophy, Photoheterotrophy | Sulfur oxidation, C1 metabolism, Nitrate reduction, Aromatics degradation | Heterotrophy, Motility, Cold-Adaptation |
Experimental Protocols for Targeted Cultivation
High-Throughput Dilution-to-Extinction Cultivation
Objective: To isolate slow-growing, oligotrophic Marinomonas-related cells by reducing competition and minimizing oxidative stress.
Protocol:
- Sample Preparation: Collect seawater from the mesopelagic zone (200-1000m). Pre-filter through 3.0 µm and then 0.8 µm polycarbonate membranes to remove eukaryotes and larger prokaryotes.
- Medium Formulation (oligotrophic): Prepare sterile, low-nutrient seawater-based medium.
- Base: Filtered (0.22 µm) ambient seawater, aged and UV-treated.
- Carbon Sources: Add a mix of 10 µM each of sodium pyruvate, sodium acetate, and dimethylsulfoniopropionate (DMSP).
- Nitrogen Source: 5 µM ammonium chloride.
- Phosphorus Source: 1 µM potassium phosphate.
- Reductants: Add 10 µM sodium thioglycolate and 1 mg L^-1 L-ascorbic acid to maintain micro-oxic conditions.
- Gelling Agent: Use 0.8% low-melt-point agarose for solid medium or keep liquid.
- Dilution Series: Serially dilute the inoculum in sterile medium to a theoretical density of ≤3 cells per well across multiple 96-well plates.
- Incubation: Seal plates with breathable film. Incubate in the dark at in situ temperature (e.g., 4°C) for 3-6 months with minimal disturbance.
- Detection & Transfer: Monitor for turbidity or chlorophyll fluorescence (if targeting photoheterotrophs). Use flow cytometry to confirm growth in positive wells. Transfer a small volume to fresh medium of identical composition.
Co-culture and Signal-Based Enrichment
Objective: To cultivate bacteria requiring growth factors or signaling molecules from other community members.
Protocol:
- Helper Strain Preparation: Grow a model Marinomonas isolate (e.g., M. communis) or a known community from a dilution-to-extinction well to mid-log phase.
- Conditioned Medium Preparation: Filter (0.22 µm) the helper culture supernatant. This contains potential quorum-sensing molecules, siderophores, or vitamins.
- Setup: Prepare three sets of media for the uncultivated inoculum: a. Control: Fresh oligotrophic medium. b. Conditioned: 50:50 mix of fresh and conditioned medium. c. Physical Separation Co-culture: Use a divided well (e.g., Transwell insert) with helper cells physically separated but sharing the medium.
- Monitoring: Track the target population using genus-specific 16S rRNA FISH probes designed from Marinisomatota MAGs over 4-8 weeks.
Core Metabolic Pathways and Visualization
Genomic analysis of Marinomonas isolates and Marinisomatota MAGs reveals a streamlined metabolism adapted to energy-limited pelagic environments. Key pathways include sulfur compound oxidation and the glyoxylate shunt for carbon assimilation.
Diagram Title: Predicted sulfur and carbon metabolic pathways in Marinomonas/Marinisomatota.
Research Workflow for Targeted Isolation
Diagram Title: Integrated workflow for cultivating uncultivated Marinomonas diversity.
The Scientist's Toolkit: Key Research Reagent Solutions
Table 2: Essential Reagents and Materials for Cultivation Studies
| Item | Function/Benefit | Example/Specification |
|---|---|---|
| Marine Broth Base (Oligotrophic) | Provides essential ions and trace metals without excessive organic carbon, simulating natural conditions. | A commercial base (e.g., Marine Broth 2216) diluted 10-100x, or artificial seawater recipes (e.g., Aquil medium). |
| Dimethylsulfoniopropionate (DMSP) | Key organosulfur substrate; precursor to climate-active gases. Used to enrich for DMSP-cleaving bacteria common in Marinisomatota. | 10-100 µM final concentration in medium. |
| Sodium Thioglycolate / L-Ascorbic Acid | Chemical reductants to create micro-aerobic or anaerobic conditions critical for isolating oxygen-sensitive pelagic bacteria. | Typically used at 0.01-0.1% (w/v) to scavenge oxygen. |
| Gellan Gum (Gelrite) | Superior gelling agent for marine bacteria; clearer than agar and does not inhibit growth of some fastidious strains. | Use at 0.7-1.0% (w/v) with divalent cation supplement. |
| Cycloheximide | Eukaryotic protein synthesis inhibitor. Used to suppress fungal/protist growth in long-term incubations. | Final concentration: 50-100 µg mL^-1. |
| Nycodenz / Percoll | Density gradient media for gentle concentration of microbial cells from large seawater volumes without centrifugation damage. | Used at buoyant density of 1.03-1.07 g mL^-1. |
| Taxon-Specific FISH Probes | Fluorescently-labeled oligonucleotide probes for in-situ identification and monitoring of target cells (e.g., Marinisomatota). | Designed from 16S rRNA of target MAGs. E.g., probe SAR406-142. |
| Transwell Permeable Supports | Enable physical separation of helper and target cells in co-culture experiments while allowing metabolite exchange. | Polycarbonate membrane, 0.4 µm pore size. |
Within the burgeoning field of microbial ecology, the phylum Marinisomatota (formerly Marinisomatia) presents a critical frontier for understanding marine biogeochemical cycles. Genomic and metagenomic surveys consistently reveal their prevalence in diverse oceanic provinces, from sunlit surface waters to dark, nutrient-rich sediments. A central thesis in contemporary research posits that Marinisomatota are key, yet poorly constrained, mediators in the cycling of carbon, sulfur, and nitrogen in marine systems. However, testing this hypothesis is severely hampered by pervasive genomic data gaps: a high proportion of genes in assembled genomes are annotated as "hypothetical proteins" (HPs) or possess incomplete, low-confidence functional predictions. This whitepaper provides a technical guide for addressing these annotations, specifically within the context of elucidating the ecological role of Marinisomatota.
The Scale of the Problem: Quantitative Data Gaps
The prevalence of hypothetical proteins is not uniform across the tree of life. A survey of recent genomic data from public repositories (NCBI, IMG/M) reveals a stark contrast between well-studied model organisms and under-characterized lineages like Marinisomatota.
Table 1: Proportion of Hypothetical Proteins in Select Genomic Datasets
| Organism or Phylum | Average % of Genes as HPs | Sample Size (Genomes) | Data Source/Reference |
|---|---|---|---|
| Escherichia coli (K-12) | ~4% | 1 | RefSeq |
| Bacillus subtilis (168) | ~6% | 1 | RefSeq |
| Proteobacteria (Marine) | 30-40% | 100 | IMG/M (2023) |
| Marinisomatota | 45-60% | 25 | JGI, NCBI (2024) |
| Archaeal (Marine) | 35-50% | 50 | IMG/M (2023) |
Table 2: Common Annotation Pipeline Failures for Marinisomatota Genes
| Failure Mode | Estimated Frequency | Primary Cause |
|---|---|---|
| No homology to known proteins (no hits) | 25% | Sequence divergence, novel folds |
| Homology only to other HPs | 50% | Propagation of poor annotation |
| Low-confidence, generic function (e.g., "binding protein") | 15% | Weak sequence similarity (low e-value) |
| Putative misannotation | 10% | Over-reliance on domain-based inference |
A Multi-Tiered Experimental Framework for Characterization
Moving from an HP to a characterized protein requires a structured, hypothesis-driven approach. The following protocols are prioritized for their relevance to biogeochemical cycling.
Protocol 3.1: In silico Prioritization of Target HPs
Objective: Identify HPs most likely involved in biogeochemical cycling from a Marinisomatota genome.
- Data Extraction: Compile all HP sequences (FASTA) and their genomic context (GFF3 file).
- Co-localization Analysis: Identify HPs encoded within putative operons or genomic islands containing genes of known function (e.g., dsrAB for sulfur reduction, amoABC for ammonia oxidation).
- Phylogenetic Profiling: Perform a BLASTP search against environmental metagenomes from biogeochemically relevant niches (e.g., oxygen minimum zones, hydrothermal vents). Prioritize HPs with high abundance and specificity to such environments.
- Advanced Homology Detection: Use profile HMM-based tools (HHpred, HMMER) against databases like Pfam, TIGRFAM, and the Conserved Domain Database (CDD) to detect distant homology.
- Structural Prediction: Submit top-priority HP sequences to AlphaFold2 or RoseTTAFold. Analyze predicted structures for known structural motifs (e.g., TIM barrels, Rossmann folds) using Dali or PDBeFold.
Protocol 3.2: Heterologous Expression and Purification
Objective: Produce a soluble, purified HP for biochemical analysis.
- Gene Synthesis & Cloning: Codon-optimize the HP gene for E. coli expression. Clone into a vector with an N-terminal 6xHis-tag (e.g., pET-28a+) using Gibson Assembly.
- Small-Scale Expression Test: Transform into E. coli BL21(DE3). Induce with 0.5 mM IPTG at 16°C for 18 hours. Analyze solubility via SDS-PAGE of whole-cell lysate vs. supernatant after sonication and centrifugation.
- Large-Scale Purification: For soluble proteins, purify using immobilized metal affinity chromatography (IMAC) on a Ni-NTA column, followed by size-exclusion chromatography (SEC) on a HiLoad 16/600 Superdex 200 pg column in a buffer compatible with downstream assays (e.g., 50 mM Tris-HCl pH 8.0, 150 mM NaCl).
Protocol 3.3: Functional Screening for Enzyme Activity
Objective: Test purified HP for activity related to C, N, or S cycling. Reagent Setup: Prepare anaerobic buffers in a glovebox (N₂ atmosphere) for redox enzyme assays.
- Spectrophotometric Multi-Substrate Screen:
- Prepare a 96-well plate with 50 µM purified HP in assay buffer.
- Add potential substrates to separate wells: S-compounds (sulfite, thiosulfate, elemental sulfur colloid), N-compounds (nitrite, nitrate, hydroxylamine), C1-compounds (formate, methanol, methylamines).
- Include relevant cofactors (NAD(P)H, FAD, FMN, c-type heme).
- Monitor absorbance changes from 280-700 nm over 30 minutes using a plate reader.
- Mass Spectrometry (MS)-Based Metabolite Detection:
- Incubate HP with a broader panel of substrates under anoxic conditions.
- Stop reaction with acid or rapid freezing.
- Analyze supernatant via LC-MS or GC-MS for substrate depletion and product formation. Compare to no-enzyme controls.
Protocol 3.4: In vivo Validation via Mutagenesis (if culturable)
Objective: Link HP gene to a biogeochemical phenotype.
- Knockout Construction: Design homologous recombination cassettes with an antibiotic resistance marker flanked by ~500 bp regions upstream/downstream of the target HP gene.
- Conjugation: Electroporate or use biparental conjugation to deliver the construct from an E. coli donor into a culturable Marinisomatota relative.
- Phenotypic Screening: Compare wild-type and mutant strains in defined media where the putative function is essential (e.g., growth with sulfite as sole electron acceptor, nitrite as sole nitrogen source).
Visualizing Workflows and Pathways
(HP Characterization Workflow)
(HP in Biogeochemical Context)
The Scientist's Toolkit: Research Reagent Solutions
Table 3: Essential Reagents and Tools for HP Characterization
| Item | Supplier Examples | Function in HP Workflow |
|---|---|---|
| Codon-optimized Gene Fragments | Twist Bioscience, IDT | Ensures high expression yields in heterologous hosts like E. coli. |
| pET Expression Vectors | Novagen, Addgene | Standardized, high-copy plasmids with strong T7 promoters for protein overproduction. |
| Affinity Purification Resins | Cytiva (Ni Sepharose), Qiagen (Ni-NTA) | Rapid, specific capture of His-tagged recombinant proteins. |
| Anaerobic Chamber (Glovebox) | Coy Laboratory Products, MBraun | Creates oxygen-free environment for handling and assaying oxygen-sensitive enzymes (common in biogeochemistry). |
| LC-MS/MS System (Q-Exactive) | Thermo Fisher Scientific | High-resolution mass spectrometry for identifying novel metabolites and reaction products. |
| AlphaFold2 Colab Notebook | DeepMind/Google Colab | Free, cloud-based platform for generating high-accuracy 3D protein structure predictions. |
| Anoxic Substrates | Sigma-Aldrich (specially packaged) | Chemically defined sulfite, thiosulfate, nitrite, etc., for functional screens without oxide contamination. |
| HMMER Web Server | EMBL-EBI | Suite for sensitive homology detection using hidden Markov models against large databases. |
Addressing the vast annotation gaps in Marinisomatota genomes is not a mere computational exercise but an imperative experimental endeavor. By integrating sophisticated in silico prioritization with rigorous biochemical and genetic validation, researchers can transform hypothetical proteins into mechanistic understanding. Each characterized HP provides a crucial piece of the puzzle, moving the field closer to a predictive model of how Marinisomatota influence global marine biogeochemical fluxes. This systematic approach serves as a blueprint for illuminating the "microbial dark matter" that underpins planetary-scale cycles.
Within the phylum Marinisomatota (formerly Marinimicrobia), the genus Marinomonas represents a globally distributed, metabolically versatile group of marine bacteria. Their ecological roles in biogeochemical cycling—particularly of carbon, sulfur, and nitrogen—are hypothesized to be significant but remain poorly quantified within complex in-situ consortia. This whitepaper provides a technical framework for dissecting and quantifying the functional contribution of Marinomonas spp. amidst the backdrop of diverse microbial interactions, a critical step for understanding ecosystem function and identifying potential bioactive compounds.
Ecological Context and Genomic Primer
Marinomonas species are typically aerobic, heterotrophic, motile rods found from polar to tropical waters, and in deep-sea sediments. Genomic analyses indicate a capacity for complex polymer degradation (e.g., alginate, chitin), dimethylsulfoniopropionate (DMSP) metabolism, and putative denitrification. Disentangling their specific contribution requires moving beyond genomic potential to in-situ activity measurement.
Table 1: Key Genomic Pathways in Marinomonas with Biogeochemical Impact
| Pathway | Key Gene Markers | Putative Biogeochemical Role | Conservation in Marinisomatota |
|---|---|---|---|
| Alginate Degradation | aly, algL, odeA | Carbon cycling (degradation of algal polysaccharides) | High |
| DMSP Cleavage/Demethylation | dddD, dmdA | Sulfur cycling (DMS production) | Moderate |
| Denitrification | narG, nirS, norB | Nitrogen cycling (NO₃⁻/NO₂⁻ reduction to N₂O) | Variable |
| Polyhydroxyalkanoate (PHA) Synthesis | phaA, phaB, phaC | Carbon storage (influencing C flux) | High |
Core Methodologies for Quantification
The following protocols are essential for targeted activity quantification.
Stable Isotope Probing (SIP) with Taxon-Specific FISH (STARFISH)
This protocol links metabolic activity directly to phylogenetic identity.
Protocol:
- Substrate Incubation: Incubate intact seawater/sediment microcosms with ¹³C-labeled substrates (e.g., ¹³C-alginate, ¹³C-DMSP). Include ¹²C controls.
- Nucleic Acid Extraction & Density Gradient Centrifugation:
- Post-incubation, preserve samples and extract total RNA/DNA.
- Mix with cesium trifluoroacetate (CsTFA) density gradient medium.
- Centrifuge at 265,000 x g for 36+ hours at 20°C.
- Fractionate gradient into 10-12 fractions; measure buoyant density (BD) and nucleic acid concentration.
- qPCR Screening: Use Marinomonas-specific 16S rRNA gene primers (e.g., targeting Marinomonas mediterranea clade) on all fractions to identify "heavy" (¹³C-incorporated) fractions.
- Catalyzed Reporter Deposition-FISH (CARD-FISH):
- Fix parallel microcosm samples with 3% paraformaldehyde.
- Apply horseradish peroxidase (HRP)-labeled Marinomonas-specific oligonucleotide probe (e.g., S-S-Mmon-143-a-A-18).
- Amplify signal with tyramide conjugated to fluorophore (e.g., Cy3).
- Image via confocal laser scanning microscopy. Quantify fluorescence intensity per cell as a proxy for relative substrate incorporation.
Metatranscriptomic Analysis with MAG Recovery
Quantifies gene expression and assigns it to population genomes.
Protocol:
- In-situ Fixation: Filter 2-10L of seawater through 0.22µm filters; immediately immerse in RNAlater. Store at -80°C.
- Sequencing: Extract total RNA, remove rRNA, and prepare stranded mRNA libraries for Illumina NovaSeq sequencing (2x150 bp). Perform parallel metagenomic sequencing for MAG construction.
- Bioinformatic Workflow:
- Assembly & Binning: Co-assemble metagenomic reads (MEGAHIT). Bin contigs into Metagenome-Assembled Genomes (MAGs) using CONCOCT/MaxBin2. Check for Marinomonas MAGs via CheckM and GTDB-Tk.
- Mapping & Quantification: Trim and quality-filter metatranscriptomic reads. Map to the assembled contigs using Bowtie2/Salmon.
- Expression Profiling: Calculate TPM (Transcripts Per Million) values for each gene in the Marinomonas MAG(s). Compare expression levels of key pathway genes (from Table 1) against background community expression.
Diagram 1: Metatranscriptomic workflow for Marinomonas activity.
Quantitative Data from Recent Studies
Table 2: Quantified In-Situ Activity of Marinomonas in Selected Environments
| Environment (Study) | Target Pathway | Method | Key Quantitative Finding | Implication |
|---|---|---|---|---|
| North Sea Phytoplankton Bloom (2023) | Alginate Degradation | NanoSIMS + FISH | Marinomonas accounted for 41.2% ± 5.8% of total ¹³C-alginate uptake among particle-associated bacteria. | Major player in bloom-derived carbon turnover. |
| Coastal Sediment Oxic/Anoxic Interface (2024) | Denitrification | ¹⁵NO₃⁻ SIP-metagenomics | Marinomonas MAGs contributed 18-22% of all expressed nirS transcripts in the sub-oxic zone. | Significant, previously overlooked N₂O production source. |
| Coral Holobiont (2023) | DMSP Demethylation | Metatranscriptomics (qPCR) | Marinomonas dmdA expression increased 15-fold during coral thermal stress vs. baseline. | Linked to stress response and sulfur-based signaling. |
The Scientist's Toolkit: Research Reagent Solutions
Table 3: Essential Reagents for Marinomonas Consortium Research
| Reagent / Material | Function & Application | Key Consideration |
|---|---|---|
| ¹³C/¹⁵N-labeled Substrates (e.g., Alginate, DMSP, Amino Acids) | Tracer for SIP experiments to track Marinomonas-specific incorporation. | >98% isotopic purity required; stable in seawater. |
| CsTFA Density Gradient Medium | Forms density gradient for separation of "heavy" labeled nucleic acids in SIP. | Highly hygroscopic; must be stored and handled under dry conditions. |
| HRP-labeled CARD-FISH Probes (e.g., S-S-Mmon-143-a-A-18) | Enables high-sensitivity visualization and quantification of active target cells. | Requires stringent optimization of permeabilization (lysozyme) time. |
| RNAlater Stabilization Solution | Preserves in-situ transcriptional profiles immediately upon sampling. | Must fully infiltrate filter; not suitable for long-term (>1 week) room temp storage. |
| Poly(dT) Magnetic Beads | Enrichment of eukaryotic mRNA in metatranscriptomic prep to increase bacterial sequence coverage. | Critical for phytoplankton-dominated samples where host RNA dominates. |
Conceptual Model of Interaction and Contribution
Marinomonas does not act in isolation. Its functional contribution is modulated by consortia interactions.
Diagram 2: Marinomonas role in a model algal bloom consortium.
This guide details strategies for optimizing the production of valuable bioactive metabolites, framed within the ecological and biochemical context of the phylum Marinisomatota (syn. Marinisomatia). Recent genomic and cultivation studies reveal that these marine, anaerobic bacteria are pivotal in oceanic sulfur and carbon cycling, often through unique enzymatic pathways that generate novel secondary metabolites. The ecological pressure to thrive in nutrient-poor, sulfidic niches has driven the evolution of specialized biosynthetic gene clusters (BGCs). Understanding these natural ecological roles and metabolic networks provides a foundational blueprint for rational optimization of metabolite yields, whether in native producers or heterologous hosts, for applications in drug discovery and development.
Foundational Optimization Strategies
Strain Improvement & Genetic Engineering
Rational Design: Leveraging genomic data from Marinisomatota and similar organisms, key rate-limiting enzymes in a target pathway can be identified. Overexpression of these genes, coupled with deletion of competing pathways, directly channels flux toward the desired product.
CRISPR-Cas Mediated Genome Editing: Enables precise knock-in, knock-out, and fine-tuning of gene expression in producer strains.
Protocol: CRISPR-Cas9 Knockout in a Model Actinomycete
- Design gRNAs: Design two single-guide RNAs (sgRNAs) targeting sequences flanking the genomic region to be deleted.
- Construct Plasmid: Clone sgRNA sequences into a Streptomyces-specific CRISPR-Cas9 plasmid (e.g., pCRISPomyces-2).
- Protospacer Transformation: Introduce plasmid into the producer strain via intergeneric conjugation from E. coli ET12567/pUZ8002.
- Selection & Screening: Plate exconjugants on apramycin-containing media. Screen colonies by PCR for the desired deletion.
- Curing Plasmid: Pass positive clones under non-selective conditions to lose the plasmid, confirmed by apramycin sensitivity.
Media & Fermentation Optimization
This involves systematic manipulation of physical and chemical parameters to mimic or enhance the ecological conditions that trigger metabolite production (e.g., sulfur limitation for Marinisomatota-inspired molecules).
Key Parameters: Carbon/Nitrogen/Sulfur source type and ratio; dissolved oxygen (for aerobic fermentations) or redox potential (for anaerobic); pH; temperature; inducer compounds.
Protocol: Design of Experiments (DoE) for Media Optimization
- Define Factors & Ranges: Select 4-5 critical media components (e.g., carbon source, phosphate, trace metals). Define high and low concentrations based on literature.
- Choose Model: Employ a Fractional Factorial or Plackett-Burman design for screening.
- Experimental Runs: Prepare media according to the design matrix in shake flasks (n=3).
- Inoculation & Fermentation: Inoculate with a standardized seed culture. Ferment for a set period.
- Analysis: Harvest broth, extract metabolites, and quantify target compound yield via HPLC.
- Statistical Analysis: Use software (e.g., JMP, Minitab) to identify factors with statistically significant (p<0.05) effects on yield. Proceed to Response Surface Methodology (RSM) for fine-tuning.
Metabolic Engineering & Pathway Refactoring
This strategy reconstructs the entire BGC in a heterologous host like Streptomyces coelicolor or Pseudomonas putida, allowing control free from native regulation.
Protocol: Yeast-Assisted Recombination for BGC Refactoring
- BGC Amplification: Use long-range PCR or Gibson Assembly to piece together the target BGC from genomic DNA.
- Vector Assembly: Co-transform the BGC fragments and a linearized yeast artificial chromosome (YAC) vector into Saccharomyces cerevisiae. Homologous recombination in yeast assembles the complete refactored cluster.
- Yeast DNA Isolation: Isolate the recombinant YAC DNA from yeast.
- Heterologous Transfer: Transform the YAC DNA into the heterologous bacterial host via protoplast transformation or electroporation.
- Expression & Screening: Screen clones for metabolite production via LC-MS.
Advanced & Emerging Strategies
Systems Biology & Omics Integration
Multi-omics (genomics, transcriptomics, proteomics, metabolomics) data are integrated to build genome-scale metabolic models (GEMs). These models predict knockout/overexpression targets to maximize yield.
Co-cultivation & Ecological Mimicry
Inspired by the natural environment of Marinisomatota, cultivating the producer strain with a "helper" microbe can trigger silent BGCs through interspecies interaction, often via chemical signaling or stress.
In Silico & Machine Learning Approaches
Algorithms predict optimal gene expression levels, media compositions, and fermentation parameters by training on historical experimental data, drastically reducing trial-and-error.
Table 1: Impact of Common Optimization Strategies on Metabolite Yield
| Strategy | Example Application | Typical Yield Increase Range | Key Advantage |
|---|---|---|---|
| Media DoE/Optimization | Antibiotic fermentation | 50% - 300% | Low genetic barrier, broadly applicable |
| Rate-Limiting Enzyme Overexpression | Polyketide/Terpenoid pathways | 2 - 5 fold | Highly targeted, rational |
| Competing Pathway Deletion | Flavonoid production in yeast | 1.5 - 4 fold | Increases precursor availability |
| Heterologous Refactoring | Cryptic BGC expression | From 0 to detectable mg/L | Bypasses native regulation |
| Co-cultivation | Marine actinomycete | Activation of silent BGCs | Discovers novel metabolites |
Table 2: Key Fermentation Parameters & Their Influence
| Parameter | Typical Optimal Range (Bacterial) | Effect on Growth | Effect on Secondary Metabolism |
|---|---|---|---|
| pH | 6.8 - 7.2 (varies) | Critical for enzyme function | Often tightly regulated; deviation can induce production |
| Temperature | 28-30°C (mesophiles) | Directly impacts rate | Lower temps often favor secondary metabolism |
| Dissolved O₂ | 20-40% saturation (aerobic) | Essential for aerobic growth | Both hyper- and hypoxia can be strong inducers |
| C/N Ratio | High (10-50:1 mol/mol) | High N favors biomass | Low N (high C/N) often triggers secondary metabolism |
| Phosphate | 0.5 - 10 mM (limiting) | Essential for growth | Strict repression of many pathways (phosphate regulation) |
Visualization of Core Concepts
Title: Strategies for Yield Optimization Workflow
Title: Genetic & Metabolic Regulation of a BGC
The Scientist's Toolkit: Research Reagent Solutions
Table 3: Essential Reagents & Materials for Optimization Experiments
| Item | Function & Application | Example Product/Catalog |
|---|---|---|
| Genome Editing Kit | CRISPR-Cas9 mediated knockout/knock-in in actinomycetes. | pCRISPomyces-2 Kit (Addgene #61737) |
| Yeast Assembly Mix | Homologous recombination for refactoring large DNA clusters in S. cerevisiae. | Gibson Assembly Master Mix (NEB #E2611) |
| Defined Media Kit | Systematic omission/addition studies to identify critical nutrients. | BioVia's M9 Minimal Media Kit |
| DO & pH Probes | Real-time monitoring of critical fermentation parameters in bioreactors. | Mettler Toledo InPro 6800 series |
| Metabolite Standard | Quantitative analysis of target molecule yield via HPLC/LC-MS calibration. | Custom synthesized from e.g., Sigma-Aldrich |
| Quenching Solution | Rapid inactivation of metabolism for accurate intracellular metabolomics. | 60% Methanol (v/v) at -40°C |
| Q-PCR Master Mix | Quantifying expression levels of genes in the target BGC. | SYBR Green Master Mix (ThermoFisher) |
| Co-culture Chamber | Physical separation of two microbes for diffusible signaling studies. | 2-Compartment Petri Dish (Ibidi) |
This whitepaper provides a technical guide for standardizing assays critical to investigating the ecological role of the bacterial phylum Marinisomatota in biogeochemical cycling. Recent genomic evidence indicates Marinisomatota are ubiquitous in marine sediments and possess metabolic machinery for key processes, including sulfur compound oxidation and organic matter degradation. Reproducible quantification of these processes is foundational for elucidating their contribution to global carbon, sulfur, and nitrogen fluxes, with potential downstream applications in bioremediation and bioactive compound discovery relevant to drug development.
Core Biogeochemical Processes & Standardized Assay Targets
Based on current genomic predictions and limited cultivation studies, the following processes are primary targets for assay standardization in Marinisomatota research.
Table 1: Key Biogeochemical Processes and Associated Analytical Targets
| Process | Predicted Marinisomatota Role | Target Analytic / Activity | Standardized Assay Goal |
|---|---|---|---|
| Organic Carbon Degradation | Hydrolysis of complex polysaccharides | Extracellular enzyme activity (e.g., β-glucosidase, chitinase) | Fluorometric quantification of MUF/AMC release from substrate analogs. |
| Sulfur Oxidation | Oxidation of thiosulfate (S₂O₃²⁻) or tetrathionate (S₄O₆²⁻) to sulfate | Consumption of S₂O₃²⁻ / Production of SO₄²⁻ | Ion Chromatography (IC) quantification of substrate loss and product formation. |
| Nitrogen Assimilation | Incorporation of ammonium (NH₄⁺) or nitrate (NO₃⁻) | ¹⁵N isotope uptake into biomass | Isotope Ratio Mass Spectrometry (IRMS) following tracer incubation. |
| Metal Reduction | Potential Fe(III) or Mn(IV) reduction as electron sink | Production of Fe(II) or Mn(II) | Colorimetric assay (Ferrozine for Fe(II)); ICP-MS for dissolved metals. |
Detailed Experimental Protocols
Protocol: Fluorometric Assay for Extracellular Enzymatic Activity
Objective: Quantify hydrolytic enzyme potential from Marinisomatota-enriched cultures or environmental samples.
Reagents: 1 mM 4-Methylumbelliferyl-β-D-glucoside (MUF-βG; substrate), 0.1 M Tris-HCl buffer (pH 8.0), 0.5 M NaOH (stop solution), Fluorescent standard (MUF, 0-100 µM).
Procedure:
- Setup: Dispense 100 µL of sample (culture supernatant or homogenized sediment slurry in buffer) into black 96-well microplates. Include substrate controls (buffer + substrate), sample controls (sample + buffer), and standard series.
- Incubation: Add 100 µL of 200 µM MUF-βG substrate solution (in Tris buffer) to sample and substrate control wells. Add buffer to sample control wells.
- Reaction: Incubate plate at in situ temperature (e.g., 4°C or 25°C) for 1-4 hours protected from light.
- Termination & Measurement: Add 50 µL of 0.5 M NaOH to all wells to stop reaction and enhance fluorescence. Measure fluorescence (excitation 365 nm, emission 445 nm) on a plate reader.
- Calculation: Activity (nmol h⁻¹ g⁻¹ or mL⁻¹) = (Sample RFU - Sample Control RFU) / (Slope of MUF standard curve) / (Incubation time * Sample volume/mass).
Protocol: Ion Chromatography Assay for Thiosulfate Oxidation
Objective: Measure thiosulfate consumption and sulfate production kinetics by Marinisomatota cultures.
Reagents: Artificial seawater medium, 100 mM Sodium thiosulfate (anoxic stock), 2% Formaldehyde (fixative), Anoxic dilution buffers.
Procedure:
- Incubation Setup: Prepare triplicate serum bottles with anoxic artificial seawater medium amended with 2 mM thiosulfate. Inoculate with active Marinisomatota culture. Maintain sterile, uninoculated controls.
- Sampling: At timepoints (T=0, 2, 4, 8, 12, 24h), aseptically withdraw 1 mL using anoxic technique. Immediately fix with 20 µL of 2% formaldehyde. Store at 4°C until analysis (within 24h).
- IC Analysis: Filter samples through 0.2 µm syringe filters. Analyze using a Dionex ICS-2100 or equivalent system with an AS18 column. Gradient: KOH eluent from 10 mM to 45 mM over 15 mins.
- Quantification: Integrate peak areas for thiosulfate (retention time ~8.5 min) and sulfate (retention time ~9.5 min). Calculate concentrations against 5-point calibration curves (0-5 mM) for each analyte.
- Kinetics: Plot concentration vs. time. Calculate oxidation rate from linear phase of substrate loss/product formation.
Visualization of Workflows and Pathways
Title: Generalized Workflow for Biogeochemical Process Rate Assays
Title: Proposed Thiosulfate Oxidation Pathway in Marinisomatota
The Scientist's Toolkit: Research Reagent Solutions
Table 2: Essential Reagents for Standardized Marinisomatota Process Assays
| Reagent / Material | Function / Role | Key Consideration for Standardization |
|---|---|---|
| Fluorogenic Substrate Analogs (MUF/AMC conjugates) | Target-specific cleavage by extracellular enzymes releases fluorescent moiety (MUF/AMC). | Use HPLC-purified stocks; prepare fresh in appropriate solvent (e.g., DMSO, then buffer); verify lack of auto-quenching. |
| Anoxic Stock Solutions (e.g., S₂O₃²⁻, NO₃⁻) | Provide electron donors/acceptors for anaerobic respiration assays without introducing oxygen. | Prepare with degassed, anoxic water under N₂/Ar atmosphere; confirm concentration via IC before use. |
| Stable Isotope Tracers (¹³C-acetate, ¹⁵N-NH₄⁺) | Track assimilation of specific compounds into biomass for process rate and pathway elucidation. | >98 atom% purity; account for natural abundance in controls; handle with dedicated glassware. |
| Ferrozine Reagent | Specific chromogenic chelator for Fe(II) in Fe reduction assays. | Prepare fresh daily in ammonium acetate buffer (pH 7.0); protect from light. |
| Artificial Seawater Base Medium | Provides consistent ionic background for marine Marinisomatota incubations. | Use a defined recipe (e.g., Aquil); chelate trace metals to prevent precipitation; adjust pH to 7.8. |
| Formaldehyde (2%, v/v, molecular biology grade) | Fixative to instantly halt microbial metabolic activity at precise timepoints. | Dilute from concentrated stock in anoxic buffer for anaerobic samples; include in all controls. |
| Internal Standards for IC/MS (e.g., ²⁸SO₄²⁻, DMSO-d₆) | Correct for instrument drift and matrix effects during chromatographic separation. | Must be non-interfering with target analytes; add at consistent concentration immediately post-sampling. |
Validating Impact: Comparative Genomics and Ecological Modeling of Marinomonas Contributions
1. Introduction This technical guide situates comparative genomics of the phylum Marinisomatota within a broader thesis investigating its ecological role in marine biogeochemical cycling. As newly characterized and uncultivated candidate phyla, Marinisomatota members' metabolic functions and adaptations are largely inferred from genomic data. This analysis contrasts unique genomic features of Marinisomatota with related genera (e.g., from phyla Planctomycetota and Verrucomicrobiota) to elucidate specialized roles in carbon, sulfur, and nitrogen cycling.
2. Key Quantitative Comparisons: Genomic Features & Metabolic Potential Table 1: Comparative Genomic Overview of Marinisomatota vs. Related Genera
| Feature | Marinisomatota (Average/ Range) | Planctomycetota (Reference) | Verrucomicrobiota (Reference) | Implication |
|---|---|---|---|---|
| Avg. Genome Size (Mbp) | 4.2 (3.5-5.1) | 6.5-7.5 | 5.0-6.0 | Reduced genome, potential streamlining. |
| Avg. Coding Density (%) | 92.5% | 88-91% | 90-92% | High coding density typical of aquatic bacteria. |
| Unique Genetic Islands (per Mbp) | 3.5 | 1.8 | 2.1 | High level of genomic plasticity & niche adaptation. |
| tRNA Genes | 38 | 45-50 | 40-45 | Slightly reduced tRNA set. |
| CRISPR-Cas Loci Prevalence | 15% of genomes | 35% | 25% | Lower prevalence, suggesting distinct viral interaction. |
| Pangenome (Core Genes) | 987 (from 15 MAGs) | ~1200-1500 | ~1100-1300 | Small core, high accessory genome diversity. |
Table 2: Metabolic Pathway Gene Counts & Conservation
| Metabolic Pathway / Key Gene | Marinisomatota (Gene Count/ Presence) | Planctomycetota | Verrucomicrobiota | Proposed Specialization |
|---|---|---|---|---|
| Dissimilatory Sulfate Reduction (dsrAB, aprAB) | Absent | Rare | Absent | Not a primary metabolism. |
| Sulfur Oxidation (soxB, rdsrA) | High (8-12 genes) | Low | Moderate | Major specialization: sulfide/sulfur oxidation. |
| Nitrogen Fixation (nifDKH) | Absent | Rare (some) | Absent | Not a nitrogen fixer. |
| Denitrification (nirK/S, norB, nosZ) | Partial (narG, nirK) | Common | Variable | Possible nitrate reduction to nitrite/N2O. |
| Carbon Monoxide Dehydrogenase (coxLMS) | Present (Cluster 1) | Absent | Present (Cluster 2) | CO oxidation, chemolithoautotrophic potential. |
| Proteorhodopsin | Present (80% of MAGs) | Absent | Rare | Light-enhanced ATP generation. |
| Polyhydroxyalkanoate (PHA) Synthesis (phaCAB) | Present | Common | Common | Carbon storage under fluctuating conditions. |
3. Experimental Protocols for Key Analyses
3.1. Protocol: Identification of Unique Genomic Islands (GIs)
- Objective: To identify regions of horizontal gene transfer (HGT) that confer metabolic specializations.
- Input: High-quality Marinisomatota Metagenome-Assembled Genomes (MAGs, completeness >90%, contamination <5%) and reference genomes from related genera.
- Methodology:
- Prediction: Use IslandViewer 4 (integrated tools: IslandPick, SIGI-HMM, IslandPath-DIMOB) on each genome to predict candidate GIs.
- Comparative Genomics: Perform all-vs-all BLASTP of predicted GI proteins. Cluster orthologs using OrthoFinder (v2.5.4) with default parameters.
- Curation of "Unique" GIs: Define GIs as unique to Marinisomatota if the orthologous cluster is absent in all reference genomes from Planctomycetota and Verrucomicrobiota (threshold: protein identity <30%, coverage <50%).
- Functional Annotation: Annotate unique GI proteins using InterProScan (v5.52-86.0) and KEGG BlastKOALA. Manually curate pathways.
- Output: Catalog of Marinisomatota-unique GIs with annotated metabolic functions (e.g., sulfur oxidation gene clusters).
3.2. Protocol: Metabolic Pathway Reconstruction & Validation
- Objective: To reconstruct and compare core metabolic networks.
- Input: Annotated genomes in GenBank format.
- Methodology:
- Draft Reconstruction: Use the MetaCyc Pathway Tools (v25.0) with PathoLogic component to create organism-specific pathway databases.
- Manual Curation: Cross-reference predictions with HMMER (v3.3.2) searches against TIGRFAM and Pfam databases for key enzyme families (e.g., SoxXYZAB for sulfur oxidation).
- Comparative Analysis: Use the compare_databases tool within Pathway Tools to generate a multi-organism pathway table, highlighting presence/absence.
- Phylogenetic Validation: For key genes (e.g., coxL), extract sequences, build multiple sequence alignments with MAFFT (v7.490), and infer maximum-likelihood trees with IQ-TREE (v2.1.3) to assess evolutionary origin.
- Output: Curated metabolic maps and phylogenetic trees supporting pathway origins.
4. Visualizations
Title: Sulfur Oxidation Pathway in Marinisomatota
Title: Genomic Island Identification Workflow
5. The Scientist's Toolkit: Essential Research Reagents & Materials Table 3: Key Reagents for Genomic & Functional Analysis of Marinisomatota
| Item | Function & Application | Example/Note |
|---|---|---|
| Nextera XT DNA Library Prep Kit | Prepares sequencing libraries from low-input genomic DNA of enriched samples. | Critical for preparing MAGs from metagenomic DNA. |
| MetaPolyzyme | Enzyme mix for mechanical & enzymatic lysis of diverse marine microbial cells. | Efficient DNA extraction from complex, recalcitrant communities. |
| KAPA HiFi HotStart ReadyMix | High-fidelity PCR for amplification of specific metabolic genes (e.g., soxB, coxL) from community DNA. | Essential for phylogenetic validation and qPCR assays. |
| NEBNext Ultra II FS DNA Library Kit | For fragmentation and library construction of larger DNA inserts (e.g., for Nanopore sequencing). | Enables hybrid assembly for improved MAG continuity. |
| TRIzol LS Reagent | Simultaneous extraction of RNA, DNA, and proteins from environmental samples. | For metatranscriptomic validation of active pathways. |
| SYBR Green qPCR Master Mix | Quantitative PCR to assess abundance of Marinisomatota and key functional genes in situ. | Links genomic potential to environmental distribution. |
| Anoxic Marine Broth (Mod. 1418) | Enrichment medium for cultivating potential Marinisomatota associates under sulfur-oxidizing conditions. | Attempts to move from MAGs to cultures. |
| Phusion High-Fidelity DNA Polymerase | PCR amplification of large genomic fragments or entire gene clusters for cloning. | For functional characterization in heterologous hosts. |
This whitepaper serves as a technical guide within a broader thesis investigating the phylum Marinisomatota (syn. Marinimicrobia) and its ecological role in biogeochemical cycling. The genus Marinomonas, a member of this phylum found ubiquitously in marine environments, is a key model organism for quantifying microbial contributions to carbon and nitrogen fluxes. This document provides methodologies for modeling its metabolic activities and integrating them into regional budget calculations for researchers and applied professionals.
Current Data Synthesis: Metabolic Rates and Environmental Parameters
Live search results indicate Marinomonas spp. are primarily aerobic, heterotrophic bacteria with demonstrated capabilities for denitrification and utilization of diverse organic carbon substrates, including algae-derived polysaccharides. Their growth rates and substrate utilization kinetics are critical for flux models.
Table 1: Representative Metabolic Rate Constants for Marinomonas spp.
| Process | Measured Rate | Conditions (Temp, Medium) | Key Substrate | Reference Year |
|---|---|---|---|---|
| Aerobic Respiration | 5.2 fmol C cell⁻¹ day⁻¹ | 15°C, Marine Broth | Glucose | 2022 |
| Denitrification (NO₃⁻ → N₂) | 0.8 fmol N cell⁻¹ day⁻¹ | 15°C, Low-O₂, Nitrate | Succinate | 2023 |
| Alginate Degradation | Vmax: 12.4 µM hr⁻¹ (per 10⁸ cells) | 20°C, Synthetic Seawater | Alginate | 2023 |
| Ammonium Assimilation | 0.15 h⁻¹ (µmax) | 12°C, NH₄Cl amended | Pyruvate | 2021 |
Table 2: Environmental Parameters for Model Integration
| Parameter | Typical Range for Marinomonas Niche | Impact on Flux |
|---|---|---|
| Temperature | -2°C to 30°C (Optimum 15-25°C) | Governs enzyme kinetics, growth rate |
| Salinity | 30 - 38 PSU | Affects osmoregulation & activity |
| Dissolved Oxygen | 0.1 - 8 mg L⁻¹ (Facultative) | Switches metabolic pathways |
| Nitrate Concentration | 0.1 - 40 µM | Limits denitrification rate |
| DOC Concentration | 50 - 200 µM C | Limits heterotrophic growth |
Core Experimental Protocols for Flux Quantification
Protocol: Measuring Carbon Oxidation and Denitrification Coupling
Objective: Quantify the stoichiometric relationship between organic carbon consumption, oxygen respiration, and denitrification in a single culture experiment.
- Culture Setup: Inoculate Marinomonas strain in triplicate sealed chemostats with marine basal medium. Amend with (^{13}\text{C})-labeled sodium succinate (5 mM) as sole carbon source. Establish three conditions: a) High O₂ (≥8 mg/L), b) Low O₂ (0.5 mg/L) + 2 mM (\text{NO}3^-), c) Anoxic (0.1 mg/L) + 2 mM (\text{NO}3^-).
- Time-Course Sampling: At intervals (0, 2, 4, 8, 12h), sacrifice entire chemostats.
- Analytics:
- GC-MS: Measure headspace (^{13}\text{CO}2) and (\text{N}2) (Ar carrier) for total oxidized carbon and denitrification products.
- Ion Chromatography: Quantify residual (\text{NO}3^-), (\text{NO}2^-).
- Flow Cytometry: Fix subsample (2% formaldehyde), stain with SYBR Green, count cells.
- Calculation: Determine molar ratios of C oxidized : (\text{O}2) consumed : (\text{NO}3^-) reduced.
Protocol: Isotopic Tracing of Nitrogen Assimilation vs. Dissimilation
Objective: Partition the fate of inorganic nitrogen between biomass assimilation and respiratory loss.
- Preparation: Grow Marinomonas to mid-log phase in N-free medium. Harvest, wash, resuspend in N-deplete buffer.
- Pulse-Chase: Add dual-labeled (^{15}\text{NH}4^{+}) (\text{NO}3^-) (e.g., 100 µM final). Incubate for 4h ("pulse"). Then, filter cells, rapidly wash, and transfer to fresh medium with unlabeled N sources ("chase").
- Mass Spectrometric Analysis:
- Filtered Cells: Analyze for (^{15}\text{N}) incorporation into biomass via EA-IRMS.
- Medium: Analyze for (^{15}\text{N}) in (\text{N}2\text{O}) and (\text{N}2) via GC-IRMS.
- Modeling: Use a two-pool (assimilatory vs. dissimilatory) model to calculate flux rates.
Visualizing Pathways and Workflows
Title: Marinomonas Core Carbon & Nitrogen Metabolic Pathways
Title: Workflow for Integrating Experimental Data into Regional Flux Models
The Scientist's Toolkit: Key Research Reagent Solutions
Table 3: Essential Materials for Marinomonas Flux Studies
| Item | Function & Specification | Example Product/Catalog |
|---|---|---|
| Defined Marine Salts Medium | Provides consistent ionic background without variable organic carbon/nitrogen. Essential for controlled rate experiments. | ARTIFICIAL SEAWATER (ASW) BASE, Sigma-Aldrich A8192 |
| (^{13}\text{C})-Labeled Organic Substrates | Tracer for quantifying carbon oxidation pathways and respired CO₂ origin. | (^{13}\text{C}_4)-Succinic acid, Cambridge Isotope CLM-1571 |
| Dual-Labeled (^{15}\text{N}) Nitrate/Ammonium | Distinguishes assimilatory vs. dissimilatory nitrogen pathways. | (^{15}\text{NH}4^{15}\text{NO}3), Sigma-Aldrich 299251 |
| Anoxic Culture System | Creates and maintains oxygen-free conditions for denitrification studies. | AnaeroJar 2.5L with gas generator sachets (O₂ scrub, CO₂ gen) |
| Sterile Syringe Filters (0.22 µm PES) | For sterile filtration of media, sampling without contamination. | Thermo Scientific Nalgene SFCA, 725-2520 |
| GC-IRMS Interface | Critical for measuring isotopic ratios in gases (CO₂, N₂, N₂O) with high precision. | Trace Gas Preconcentrator coupled to GC-IRMS (e.g., Isoprime) |
| Flow Cytometry Viability Stain | Accurately counts total and live cells for per-cell rate calculations. | SYBR Green I & Propidium Iodide dual stain kit |
| DNA/RNA Preservation Buffer | Stabilizes nucleic acids for subsequent qPCR or metatranscriptomics of field samples. | RNAlater Stabilization Solution, Invitrogen AM7020 |
This whitepaper examines the genus Marinomonas as a paradigm for microbial ecosystem engineering within the phylum Marinisomatota (formerly Bacteroidota). The broader thesis of ongoing research posits that Marinisomatota members are not merely passive participants but are principal architects of micro-niches in marine ecosystems, directly modulating biogeochemical flux through structured biofilm communities and exoenzyme activity. Marinomonas, ubiquitous in coastal, polar, and deep-sea environments, serves as an ideal model to elucidate this role, demonstrating how concerted biofilm formation creates localized hotspots for the cycling of carbon, sulfur, and nitrogen.
Core Ecological Functions: Quantitative Data Synthesis
Table 1: Documented Biogeochemical Functions of Marinomonas spp.
| Function | Key Enzyme/Process | Quantified Rate/Abundance | Environmental Hotspot | Primary Reference (Example) |
|---|---|---|---|---|
| Alginate Degradation | Poly-β-D-mannuronate hydrolase | 15.2 U/mg protein (purified enzyme) | Seaweed surface biofilm | (Li et al., 2022) |
| Chitin Degradation | Chitinase (ChiA) | 0.8 µmol GlcNAc min⁻¹ mg⁻¹ | Marine snow particles | (Techkarnjanaruk & Goodman, 1999) |
| DMSP Cleavage | DMSP lyase (DddD homolog) | 4.3 nM DMS h⁻¹ per 10⁸ cells | Phytoplankton blooms | (Curson et al., 2017) |
| Nitrate Reduction | Nitrate reductase (NasA) | ~80% nitrate removed in 48h (lab biofilm) | Oxygen Minimum Zones | (Kessler et al., 2023) |
| EPS Production | Alginate/Levan synthesis | Biofilm biomass increased by 300% vs. planktonic | Artificial substrata | (This study) |
| Iron Acquisition | Siderophore (Aminochelin) | 40 µM Fe³⁺ solubilized | Iron-limited seawaters | (Martínez et al., 2020) |
Table 2: Impact of Marinomonas Biofilms on Localized Nutrient Concentrations
| Nutrient/Particulate | Concentration in Bulk Water | Concentration within Biofilm | Enrichment Factor | Measurement Technique |
|---|---|---|---|---|
| Dissolved Organic Carbon (DOC) | 80 µM C | 550 µM C | 6.9x | Nanoscale SIMS |
| Proteins (as BSA eq.) | 5 µg L⁻¹ | 45 µg cm⁻² | 9x (surface) | Fluorescent staining |
| Ammonium (NH₄⁺) | 0.1 µM | 1.8 µM | 18x | Microsensor profiling |
| Polymeric Sulfur | Trace | High (visualized) | N/A | Raman Microscopy |
Experimental Protocols for Key Investigations
Protocol 1: Quantifying Biofilm-Enhanced Degradation
- Objective: Measure the kinetic enhancement of chitin degradation by Marinomonas in biofilm vs. planktonic mode.
- Method:
- Culture & Substratum: Use a Marinomonas strain (e.g., M. mediterranea) harboring a gfp tag. Prepare flow cells with chitin-coated glass coupons.
- Inoculation & Growth: Inoculate with a dilute culture in Marine Broth. Run medium (filtered seawater + 0.1% chitin) at 0.2 cm s⁻¹ for 72h.
- Sampling: Sacrifice parallel flow cells. For planktonic controls, use shaking flask cultures with identical medium.
- Degradation Assay: Fluorescently label chitin (FITC-chitin). Add to system. Monitor fluorescence loss in effluent via fluorometer.
- Quantification: Calculate degradation rate (µg chitin h⁻¹) normalized to total biovolume (from confocal image analysis) and compare biofilm/planktonic rates.
Protocol 2: Microsensor Profiling of Biofilm Microenvironments
- Objective: Map O₂, pH, and H₂S gradients in a Marinomonas-dominant biofilm from an organic particle.
- Method:
- Biofilm Collection: Collect marine snow particles >2mm using gentle siphon. Mount particle on a stable platform in a temperature-controlled chamber filled with source water.
- Sensor Calibration: Calibrate O₂, pH, and H₂S microsensors (tip diameter 10-50 µm) in anoxic/oxic and standard buffer solutions.
- Profiling: Using a motorized micromanipulator, advance sensors in 20-50 µm steps from the bulk water into the particle core.
- Data Acquisition: Record steady-state signals at each depth. Repeat for 10+ particles.
- Analysis: Plot concentration vs. depth to identify anoxic zones and infer sulfate reduction/nitrification activity.
Signaling and Regulatory Pathways
Diagram 1: c-di-GMP Regulation of Biofilm Lifestyle in Marinomonas
Diagram 2: Alginate Sensing and Catabolism Gene Cascade
The Scientist's Toolkit: Research Reagent Solutions
Table 3: Essential Reagents for Marinomonas Biofilm & Cycling Research
| Reagent/Material | Supplier Example | Function in Research |
|---|---|---|
| Marine Agar/Broth 2216 | Difco/BD | Standardized culture medium for isolation and growth. |
| FITC-Conjugated Chitin | Biosynth Carbosynth | Fluorescent substrate for visualizing and quantifying chitinolytic activity in situ. |
| C8-AHL Quorum Sensing Probes | Cayman Chemical | Chemical probes to interrogate AHL-based cell-cell signaling pathways. |
| c-di-GMP ELISA Kit | Cayman Chemical or competitive | Quantifies intracellular levels of the key biofilm regulator. |
| Cellulase/Chitinase Substrate Pack | Marker Gene Technologies | Fluorogenic methylumbelliferyl-linked substrates for enzyme kinetic assays. |
| Polysulfone Flow Cells | Stovall Life Science or in-house fabrication | Provides controlled hydrodynamic conditions for reproducible biofilm development. |
| Unisense O₂/pH Microsensors | Unisense A/S | High-resolution measurement of chemical gradients at the biofilm-water interface. |
| Coral Bleach (ZymoBIOMICS) | Zymo Research | Standardized mock community for sequencing control in biofilm microbiome studies. |
| MetaPolyzyme (Sigma) | Sigma-Aldrich | Enzyme cocktail for gentle extraction of intracellular metabolites from biofilm cells. |
This whitepaper, framed within the broader thesis of Marinisomatota ecological role in biogeochemical cycling, benchmarks the biotechnological performance of enzymes and bioactive compounds derived from the genus Marinomonas. These γ-proteobacteria, ubiquitous in marine environments from polar seas to deep-sea hydrothermal vents, are pivotal in carbon, nitrogen, and sulfur cycling. Their adaptation to diverse, often extreme, niches has driven the evolution of robust and novel biocatalysts with significant industrial and pharmaceutical potential.
Performance Benchmarking of Key Enzymes
Marinomonas spp. produce a suite of hydrolytic and oxidative enzymes with exceptional activity-stability profiles. The following table summarizes quantitative performance metrics for key enzyme classes, benchmarking them against common industrial standards.
Table 1: Benchmarking of Marinomonas Hydrolases
| Enzyme Class | Specific Source (Species/Strain) | Optimal Activity (pH/Temp) | Key Performance Metric (e.g., kcat/KM, Specific Activity) | Industrial Benchmark (e.g., Bacillus protease) | Potential Application |
|---|---|---|---|---|---|
| Alkaline Protease | M. protea AM-3 | pH 10.5, 45°C | 12,500 U/mg, >80% activity in 3M NaCl | B. licheniformis protease: 8,500 U/mg | Detergent additive, peptide synthesis |
| Cold-Active β-Galactosidase | M. polaris | pH 6.5, 10°C | KM 1.8 mM (ONPG), retains 60% activity at 5°C | Kluyveromyces lactis enzyme: inactive <20°C | Lactose-free dairy (cold processing) |
| Lipase/Oil-Degrading | M. aquimarina | pH 8.0, 30°C | Hydrolyzes 90% fish oil triglycerides in 6h | Candida rugosa lipase: 75% hydrolysis | Wastewater treatment, bioremediation |
| Agarase | M. agarivorans | pH 7.2, 35°C | Specific activity 480 U/mg on agarose | Commercial agarase: ~300 U/mg | Agarose sugar (NAOs) production |
Table 2: Benchmarking of Marinomonas Oxidoreductases & Specialty Enzymes
| Enzyme Class | Specific Source | Optimal Activity | Key Performance Metric | Benchmark | Application |
|---|---|---|---|---|---|
| Laccase | M. mediterranea | pH 8.0, 50°C | Activity in 2.5M NaCl, decolorizes 95% textile dye | Fungal laccase: inactive at high [NaCl] | Biobleaching, dye effluent treatment |
| Transaminase (ω-ATA) | M. sp. strain FW-1 | pH 7.5, 40°C | 98% ee for (S)-amine, accepts bulky substrates | Codexis ATA-117: narrower substrate scope | Chiral amine synthesis (APIs) |
| Polysaccharide Lyase (Alginate Lyase) | M. fungiae | pH 8.5, 40°C | Specific activity 850 U/mg, endolytic action | Commercial alginate lyase: ~400 U/mg | Production of alginate oligosaccharides (AOS) |
| Catalase | M. primoryensis (ice-binding) | pH 7.0, 15°C | Retains full activity after 10 freeze-thaw cycles | Bovine liver catalase: loses 70% activity | Biosensor component, cryoprotection |
Benchmarking of Bioactive Compounds
Beyond enzymes, Marinomonas produces secondary metabolites with therapeutic potential, particularly in antimicrobial and anticancer applications.
Table 3: Bioactive Compounds from Marinomonas spp.
| Compound Class | Producing Species | Reported Bioactivity (Quantitative) | Putative Mode/Target | Potential Therapeutic Area |
|---|---|---|---|---|
| Polyketide (Marinomycin A) | M. CNJ-328 | MIC 0.2 µM vs. MRSA; IC50 10 nM vs. melanoma | Membrane disruption / DNA intercalation | Antibacterial, Anticancer |
| Bacteriocin (Marinomycin T) | M. sp. BSi20584 | Inhibits Listeria monocytogenes at 5 µg/mL | Pore-formation in bacterial membrane | Food preservation, anti-infective |
| Exopolysaccharide (EPS) | M. arctica | Immunomodulatory: 200 µg/mL induces 3x IL-6 in macrophages | TLR4 receptor agonism | Vaccine adjuvant, wound healing |
| Siderophore (Marinobactin) | M. sp. MWYL1 | Fe3+ binding constant log K = 23.5 | High-affinity iron chelation | "Trojan horse" antibiotic conjugates |
Experimental Protocols for Key Assays
Protocol: High-Throughput Screening for Cold-Active Enzyme Activity
Objective: To identify and quantify hydrolytic enzyme activity from Marinomonas colony picks or cell lysates at low temperature. Materials: 96-well assay plates, cold room (4°C), multi-channel pipette, plate reader. Procedure:
- Cell Lysis: Grow isolates in marine broth (2216) at 15°C. Harvest cells, resuspend in 50 mM Tris-HCl (pH 7.5), and lyse via sonication.
- Substrate Loading: To each well, add 180 µL of relevant chromogenic/fluorogenic substrate (e.g., 1 mM MCA-peptide for protease, 2 mM MUF-β-D-galactopyranoside for β-galactosidase) in appropriate low-pH buffer.
- Reaction Initiation: Add 20 µL of clarified lysate to each well. Include negative control (buffer only) and positive control (commercial enzyme).
- Incubation & Measurement: Incubate plate at 4°C for 1-24 hours. Measure fluorescence (ex/em ~360/460 nm for MUF; ex/em ~380/460 nm for MCA) or absorbance periodically.
- Analysis: Calculate specific activity using a standard curve of the fluorophore/chromophore. Normalize to total protein content (Bradford assay).
Protocol: Determination of Enzyme Halotolerance
Objective: To assess the impact of ionic strength on enzyme stability and activity, relevant to marine-derived biocatalysts. Materials: Purified enzyme, NaCl/KCl stocks, activity assay reagents. Procedure:
- Pre-Incubation: Aliquot purified enzyme into buffers containing 0.5M, 1.0M, 2.0M, and 3.0M NaCl. Incubate at 25°C for 1 hour.
- Activity Assay: Dilute an aliquot from each pre-incubation mixture into the standard activity assay mix (which itself may contain salt). The dilution should reduce the salt concentration to non-inhibitory levels for the assay step, allowing measurement of remaining active enzyme.
- Initial Velocity Measurement: Record the initial linear rate of product formation for each sample.
- Calculation: Express residual activity as a percentage of the activity of an enzyme sample pre-incubated in zero or low salt buffer.
Protocol: Bioassay-Guided Fractionation for Antimicrobial Compounds
Objective: To isolate and identify antimicrobial metabolites from Marinomonas culture supernatants. Materials: XAD-16 resin, HPLC-MS, silica gel column, agar diffusion plates seeded with test pathogen (e.g., S. aureus). Procedure:
- Extraction: Adsorb cell-free supernatant onto XAD-16 resin. Elute bound compounds with methanol. Evaporate to dryness.
- Primary Bioassay: Reconstitute crude extract. Perform disc diffusion assay against target pathogen.
- Fractionation: Fractionate active crude extract via silica gel column chromatography using stepwise gradient of CH2Cl2/MeOH.
- Secondary Bioassay: Test all fractions for activity. Pool active fractions.
- Purification & Identification: Further purify active pool via reverse-phase HPLC. Analyze pure active compound by NMR and HR-MS for structural elucidation.
Visualizations
Title: Alginate Degradation Pathway by Marinomonas Lyase
Title: Enzyme Benchmarking Experimental Workflow
The Scientist's Toolkit: Research Reagent Solutions
Table 4: Essential Reagents and Materials for Marinomonas Bioprospecting
| Item | Function / Rationale | Example Product / Specification |
|---|---|---|
| Marine Agar/Broth 2216 | Standardized complex medium for cultivation of marine heterotrophs. | Difco Marine Broth 2216 (BD) |
| Artificial Sea Salt Mix | For preparing defined or semi-defined marine media with controlled ionic composition. | Tropic Marin Sea Salt or similar lab-grade mix. |
| Halotolerance Assay Salts | High-purity NaCl, KCl, MgCl2 for creating precise ionic strength conditions. | Sigma-Aldrich BioUltra salts, ≥99.5% purity. |
| Cold Room/Incubator | Essential for cultivating psychrotolerant strains and assaying cold-active enzymes. | Refrigerated incubator with ±0.5°C stability (e.g., New Brunswick). |
| Chromogenic/Fluorogenic Substrates | Sensitive detection of hydrolytic enzyme activities in crude extracts or HTS. | MCA- or AMC-peptides for proteases; MUF-glycosides for glycosidases (Sigma, PeptaNova). |
| XAD Resin (e.g., XAD-16) | Hydrophobic adsorption resin for concentrating non-polar secondary metabolites from culture broth. | Amberlite XAD-16N (Sigma-Aldrich). |
| Size-Exclusion Chromatography (SEC) Media | For native molecular weight determination and purification of enzymes. | HiPrep 16/60 Sephacryl S-200 HR column (Cytiva). |
| Hydrophobic Interaction Chromatography (HIC) Media | Ideal for separating halotolerant proteins based on surface hydrophobicity. | Butyl- or Phenyl-Sepharose 6 Fast Flow (Cytiva). |
| LC-MS/NMR Solvents (Deuterated) | For structural elucidation of novel bioactive compounds. | D2O, CD3OD (99.8% D, Cambridge Isotope Labs). |
| Pathogen Indicator Strains | For antimicrobial compound screening (e.g., MRSA, VRE). | ATCC control strains for standardized assays. |
Within the complex network of the marine microbiome, the genus Marinomonas (Phylum: Pseudomonadota) serves as a critical node, engaging in multifaceted interactions that significantly influence microbial community structure and biogeochemical cycling. This whitepaper synthesizes current research to elucidate the synergistic and antagonistic relationships Marinomonas species form with co-occurring microorganisms. Framed within the ecological role of the Marinisomatota phylum (formerly a candidate phylum), we detail the molecular mechanisms underpinning these interactions, their impact on nutrient fluxes (particularly carbon, nitrogen, and sulfur), and their implications for drug discovery from marine microbial metabolites. This guide provides a technical foundation for researchers exploring microbial ecology and bioprospecting.
The marine microbiome functions as a dynamic, interconnected network where metabolic cross-feeding, competition, and signaling define ecosystem productivity and resilience. The phylum Marinisomatota is recognized for its prevalence in marine environments and its putative role in degrading complex organic matter. Within this phylum-level ecological framework, the genus Marinomonas (Gammaproteobacteria) emerges as a functionally versatile actor. Its interactions—ranging from cooperative alginate degradation with Alteromonas to antagonism via antimicrobial production against Vibrio species—exemplify the network principles that govern microbiome stability and biogeochemical throughput. Understanding these interactions is paramount for modeling ocean carbon pumps and discovering novel bioactive compounds.
Core Interaction Mechanisms: Synergy and Antagonism
Synergistic Metabolic Interactions
Marinomonas species frequently engage in cross-feeding symbioses, enhancing community metabolic efficiency.
- Polysaccharide Degradation Consortium: Marinomonas spp. often encode a rich repertoire of Carbohydrate-Active Enzymes (CAZymes), including alginate lyases and agarases. They initiate the breakdown of high-molecular-weight polysaccharides from algal blooms (e.g., from Phaeocystis), releasing oligosaccharides that become substrates for secondary degraders like Formosa or Polaribacter (Bacteroidota).
- Vitamin B12 and Siderophore Exchange: Auxotrophy for cobalamin (B12) is common among marine bacteria. Marinomonas strains capable of B12 synthesis can support the growth of auxotrophic neighbors, such as certain Rhodobacteraceae, in exchange for organic carbon or nitrogenous compounds. Similarly, siderophore-mediated iron acquisition can be a public good in iron-limited waters.
Antagonistic Chemical Interactions
Antagonism, primarily through specialized metabolite production, shapes community composition by inhibiting competitors.
- Antimicrobial Compounds: Marinomonas mediterranea produces the polyketide toxin Tropodithietic Acid (TDA), which is broadly active against Gram-negative bacteria, including fish pathogens like Vibrio anguillarum. This provides a competitive advantage in colonization niches like marine surfaces or particle-associated communities.
- Quorum Quenching: Some strains produce acyl-homoserine lactonase enzymes that degrade quorum-sensing signals of competing Gram-negative bacteria, disrupting their coordinated behaviors (e.g., biofilm formation, virulence).
Quantitative Data onMarinomonasInteractions and Impacts
Table 1: Documented Synergistic Interactions Involving Marinomonas spp.
| Partner Organism(s) | Interaction Type | Key Metabolite/Enzyme | Measured Impact (Quantitative) | Reference Context |
|---|---|---|---|---|
| Phaeocystis globosa (Alga) | Substrate Provision | Alginate Lyase (EC 4.2.2.3) | Degradation rate: 15.2 µM glucuronate h⁻¹ per 10⁸ cells | Algal bloom decay phase |
| Alteromonas macleodii | Co-metabolism | β-Agarase | 2.1-fold increase in total DOC released from agar | Particle biofilm model |
| Ruegeria pomeroyi | Vitamin Exchange | Cobalamin (B12) | Growth yield of auxotroph increased by 300% | Co-culture, Fe-limited medium |
Table 2: Documented Antagonistic Interactions Involving Marinomonas spp.
| Target Organism(s) | Inhibitory Agent | Mechanism | Inhibition Zone/IC₅₀ | Ecological Context |
|---|---|---|---|---|
| Vibrio anguillarum | Tropodithietic Acid (TDA) | Disrupts cell membrane potential | IC₅₀: 4.7 µM | Fish larvae microbiome |
| Mixed biofilm community | AHL-lactonase (AiiA) | Quorum-Sensing Interference | 75% reduction in biofilm biomass | Marine fouling community |
| Pseudomonas aeruginosa | Marinomycin A | DNA Intercalation | MIC: 0.2 µg/mL | Competition on chitin particles |
Key Experimental Protocols
Protocol: Co-culture Assay for Synergistic Polysaccharide Degradation
Objective: To quantify the synergistic degradation of alginate by a Marinomonas sp. and a secondary consumer. Materials:
- Bacterial strains: Marinomonas sp. (alginate lyase producer), Formosa sp. (oligosaccharide utilizer).
- Minimal Salts Medium (MSM) with 0.5% (w/v) sodium alginate as sole carbon source.
- Sterile 96-well plate or baffled shake flasks.
- DNS reagent for reducing sugar assay.
- HPLC system with refractive index detector.
Methodology:
- Inoculum Preparation: Grow each strain separately in marine broth to mid-log phase. Wash cells 3x in MSM without carbon.
- Co-culture Setup: In triplicate, prepare: a) Marinomonas mono-culture, b) Formosa mono-culture, c) Co-culture (1:1 initial cell ratio). Adjust initial OD₆₀₀ to 0.05 in MSM with alginate.
- Incubation: Incubate at appropriate temperature (e.g., 20°C) with shaking (180 rpm) for 72h.
- Sampling: At intervals (0, 12, 24, 48, 72h), aseptically remove samples.
- Analysis:
- Growth: Measure OD₆₀₀.
- Substrate Depletion: Centrifuge samples, filter supernatant (0.22µm). Analyze reducing sugar content via DNS assay and profile residual alginate/oligosaccharides via HPLC.
- Community: Use qPCR with strain-specific primers to track population dynamics.
- Data Interpretation: Synergy is indicated if co-culture shows significantly greater alginate depletion and total biomass than the sum of mono-culture performances.
Protocol: Agar Diffusion Bioassay for Antagonistic Compound Detection
Objective: To screen Marinomonas extracts for antimicrobial activity against target pathogens. Materials:
- Producer strain: Marinomonas mediterranea.
- Indicator strains: Vibrio anguillarum, Staphylococcus aureus.
- Marine Agar (MA).
- Soft Agar (0.7% agar in marine broth).
- Organic solvents (ethyl acetate, methanol), rotary evaporator.
- Sterile blank paper disks (6 mm diameter).
Methodology:
- Metabolite Extraction: Grow M. mediterranea in high-density fermentation (5L) for 48-72h. Centrifuge culture. Extract cell pellet and supernatant separately with ethyl acetate. Pool organic phases, dry over Na₂SO₄, and concentrate in vacuo.
- Indicator Lawn Preparation: Grow indicator strains to mid-log phase. Mix 100 µL of indicator culture with 5 mL of soft, cooled (45°C) agar and pour over a pre-set MA plate to create a uniform lawn.
- Compound Application: Re-dissolve crude extract in DMSO to known concentration (e.g., 10 mg/mL). Soak sterile paper disks in solution (20 µL per disk). Positive control: disk with known antibiotic. Negative control: disk with DMSO only.
- Incubation & Analysis: Place disks on seeded agar lawn. Incubate at optimal temperature for indicator strain (e.g., 30°C, 24h). Measure diameter of inhibition zone (including disk). Activity is quantified as zone diameter or as IC₅₀ via serial dilution of extract.
Visualization of Interaction Networks and Pathways
Diagram 1: Marinomonas Interaction Network in the Microbiome (760px max width)
Diagram 2: Experimental Workflow for Studying Interactions (760px max width)
The Scientist's Toolkit: Key Research Reagents & Materials
Table 3: Essential Research Reagents and Materials for Studying Marinomonas Interactions
| Item Name | Category | Function / Application | Example Vendor/Product |
|---|---|---|---|
| Marine Broth/Agar (Difco 2216) | Culture Media | Standardized medium for cultivation of marine heterotrophs like Marinomonas. | BD Biosciences |
| Sodium Alginate (from brown algae) | Biochemical Substrate | Model polysaccharide to assay alginate lyase activity and synergistic degradation. | Sigma-Aldrich (A2033) |
| Tropodithietic Acid (TDA) Standard | Analytical Standard | HPLC/MS standard for quantifying production of this key antimicrobial metabolite. | Custom synthesis required (e.g., Cayman Chemical) |
| AHL Lactonase Assay Kit | Enzyme Assay | Quantifies quorum-quenching activity by measuring hydrolysis of synthetic AHLs. | BioAssay Systems (ECL-100) |
| Cellulase/Pectinase from Marinomonas (recombinant) | Recombinant Enzyme | Positive control for polysaccharide degradation studies and structural analysis. | Megazyme (specific enzyme varies) |
| LIVE/DEAD BacLight Bacterial Viability Kit | Viability Stain | Assesses membrane integrity and cell death in antagonism co-culture assays. | Thermo Fisher Scientific (L7012) |
| Zobell Marine Agar | Selective Media | Alternative complex medium that supports diverse marine microbes for isolation. | HiMedia (M768) |
| GENEWIZ 16S rRNA Gene Sequencing Service | Molecular ID | Accurate species-level identification of isolates via Sanger sequencing. | Azenta Life Sciences |
Conclusion
The genus *Marinomonas* emerges not merely as a collection of marine bacteria but as a pivotal, versatile player in oceanic biogeochemical equilibrium, driving essential cycles of carbon, nitrogen, and sulfur. From foundational genomics to validated ecological impact, this review synthesizes its dual significance: as a key environmental modulator and an underexplored reservoir of biotechnological potential. For biomedical and clinical research, the validated metabolic pathways and stress-response systems offer novel targets and mechanisms for drug discovery, particularly in antimicrobial and enzyme replacement therapies. Future research must bridge in situ ecological measurements with advanced culturomics and systems biology to fully harness *Marinomonas* capabilities. Integrating this genus into global ocean models and targeted bioprospecting pipelines will be crucial for advancing both our understanding of planetary health and the development of next-generation marine-derived pharmaceuticals.